Trade Review – $RUT April Core Income Butterfly Options Trade
Overview:
The April 2016 CIB was closed on March 3, 2016 for around the maximum loss (-$688 Gross, -$805 Net, or a roughly -3.92% return on the sample account). In hindsight, I would have preferred to take a slightly smaller loss and need to be more conscious of commissions when creating a rough loss estimate.
Please note that the adjustments below are only one part of the story. There are some interesting observations about volatility at the bottom of this post that are important as well.
The position was publicly tracked on a daily basis with live video, written comments, and a tracking spreadsheet. In other words, I’m not sugar coating the outcome, backtesting to optimize the trade, or cherry picking a good winning trade (obviously). My goal is to present the trade as accurately as possible while helping you understand the process of trading options income trades. The reality is that sometimes we have losses and this was the first, but surely not the last, public loss for the CIB. All systems have losing trades at times and we need to accept that.
Click here to access the Live Trade Page for the April position.
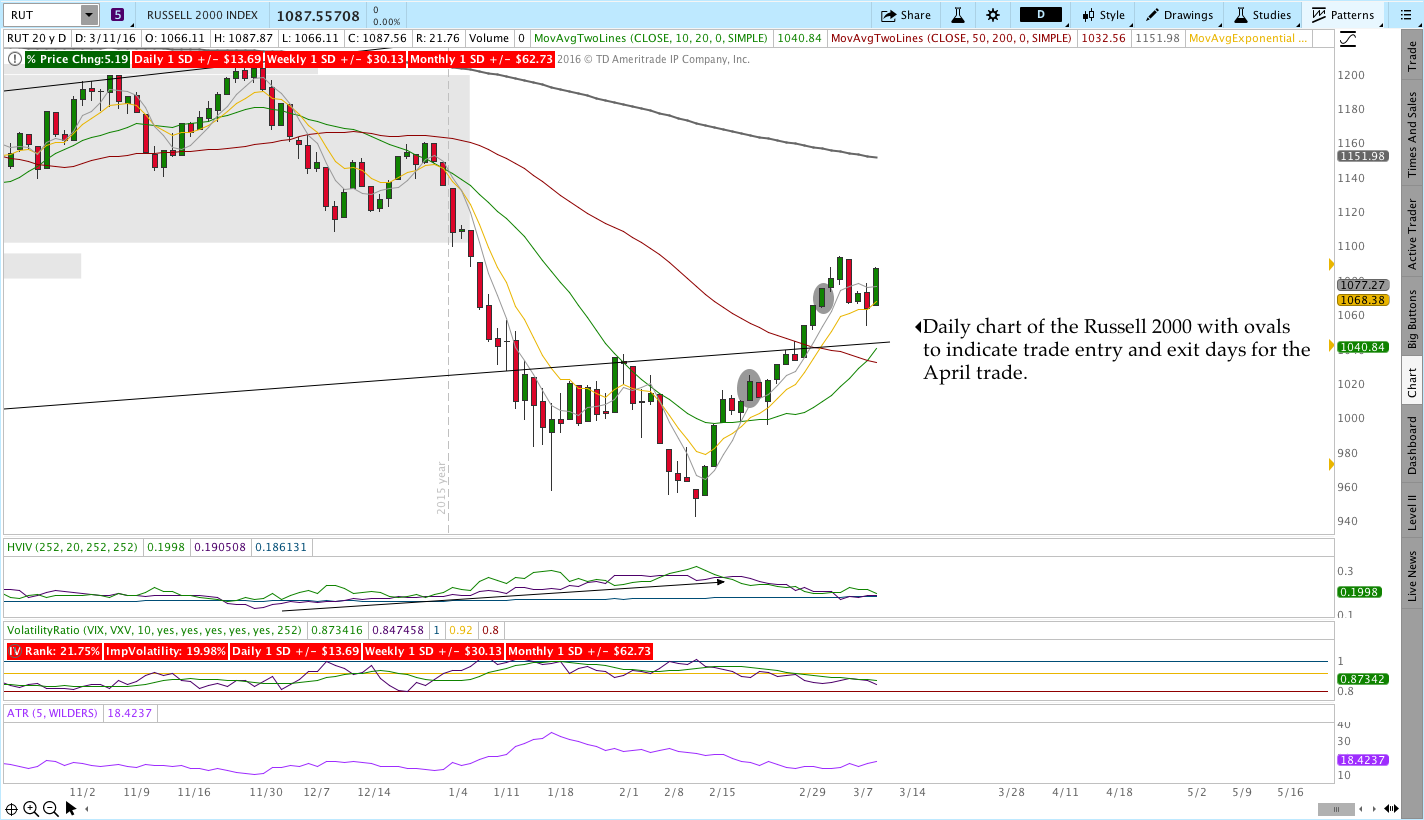
The Russell 2000 was essentially vertical over the life of the trade, which made it difficult to keep up with the market. Ultimately, non-directional strategies are successful when markets stabilize and/or range contracts. When markets trend strongly in one direction, it can be difficult to keep up. That being said, the CIB has a much easier time keeping up on the downside because the trade tends to benefit from rising volatility. For more on why that’s the case, read this post.
Click here to read about the CIB Trading Course that covers this strategy in detail.
Initiation:
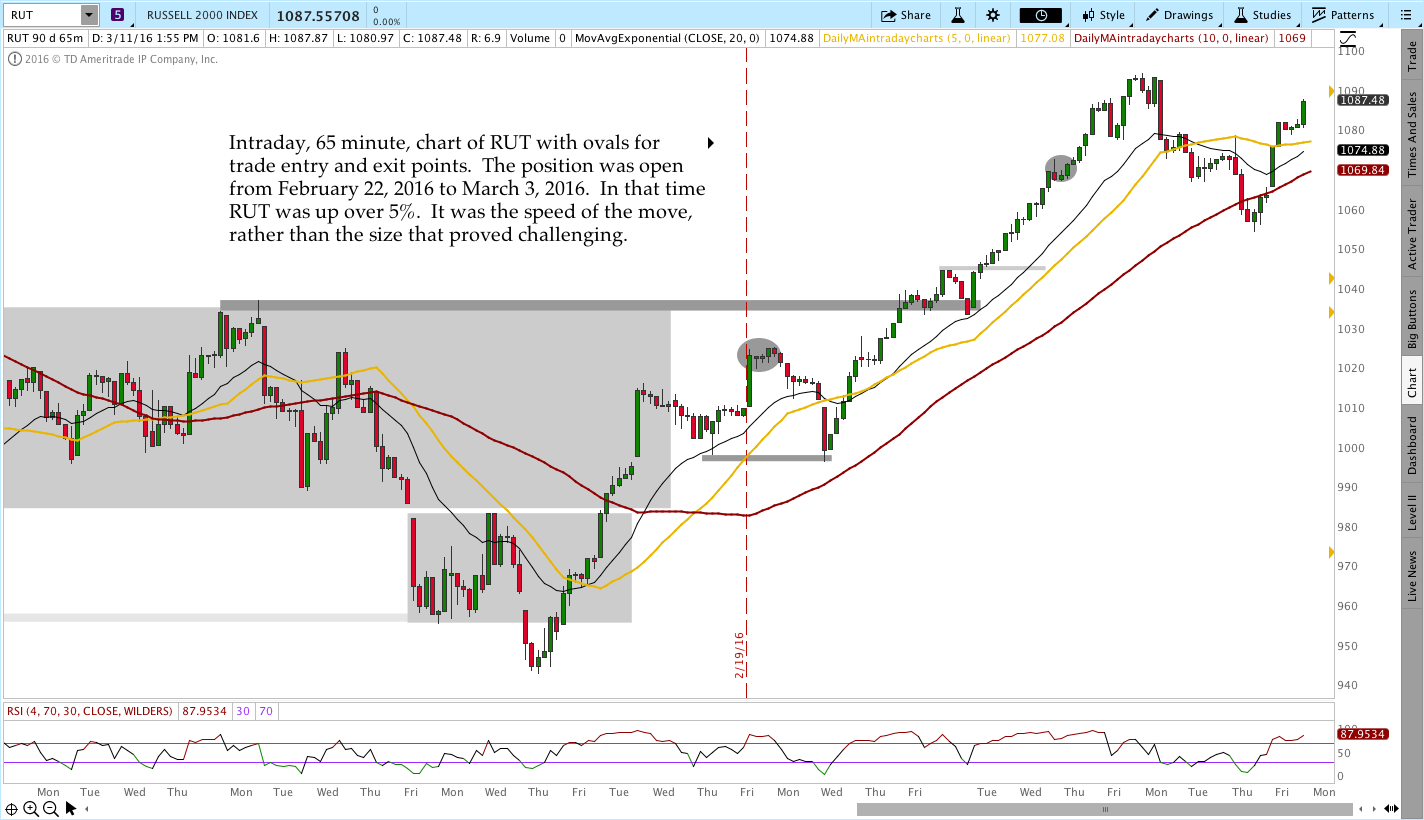
The trade was initiated on February 22, 2016 with RUT trading around 1020. At the time of entry, RUT had moved from 945 to the 1020 area in 7 trading days and was short term overbought. From that level the market paused briefly and went on to become very overbought by trading up to around 1100.
Daily Chart:
Intraday Chart:
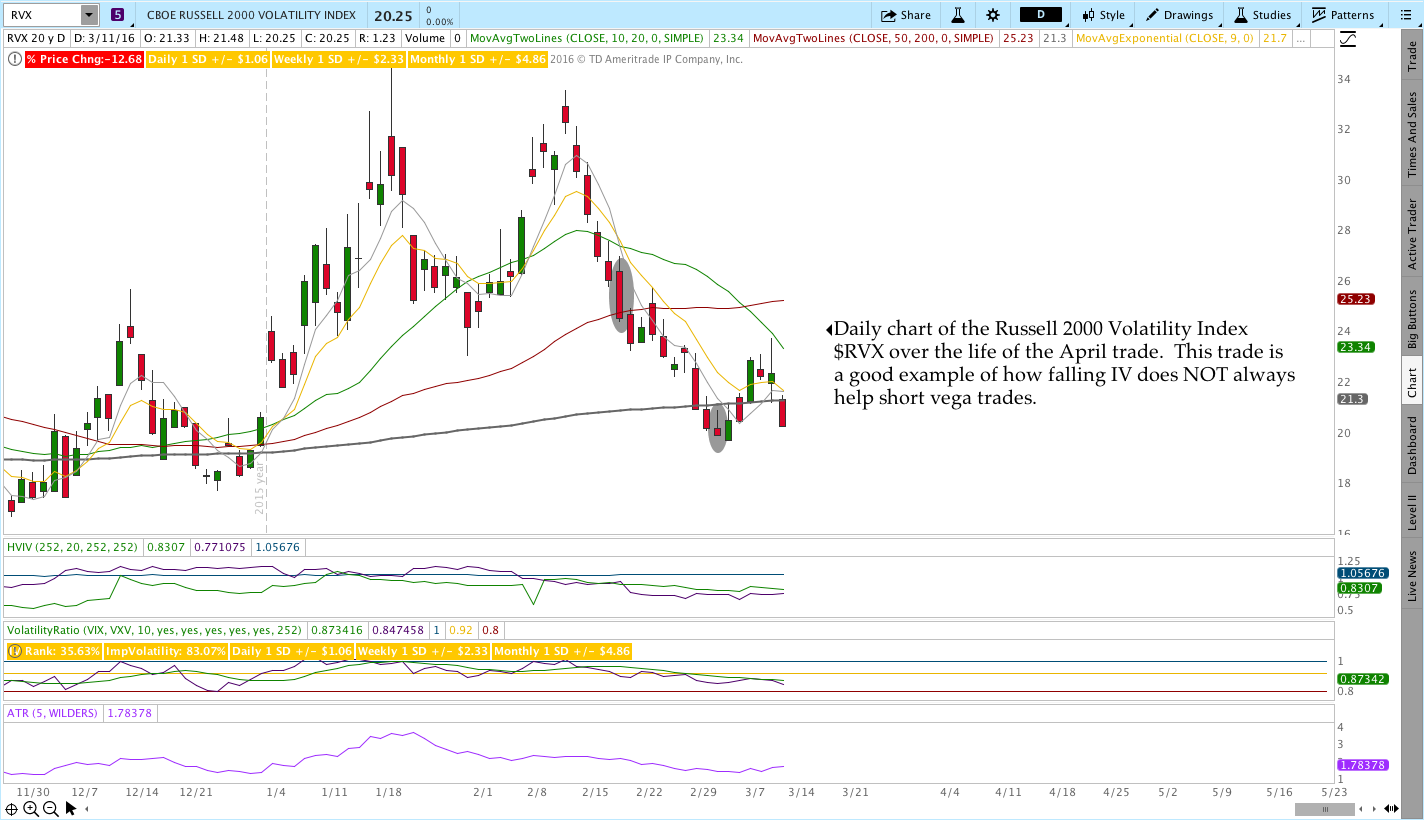
Volatility ($RVX):
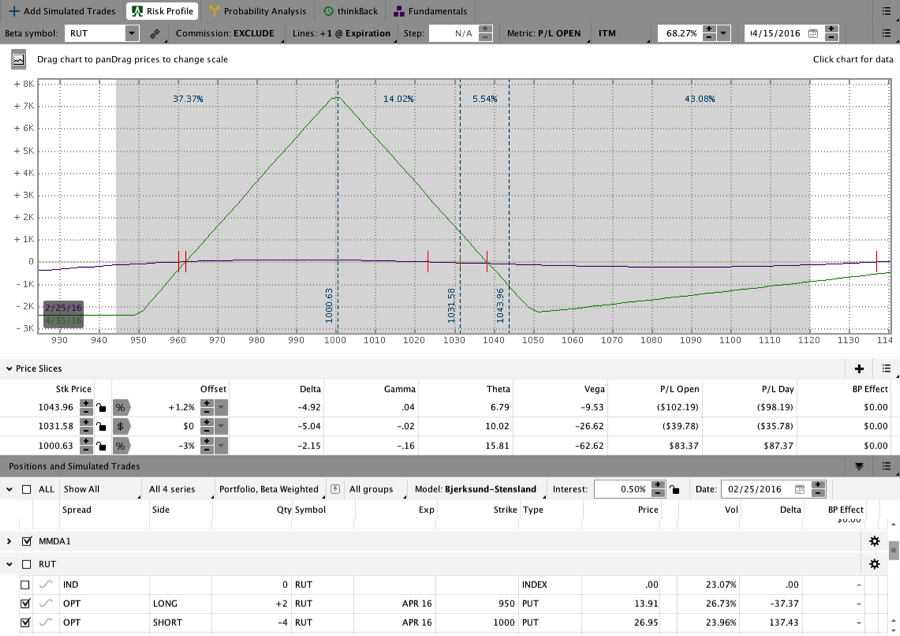
Initial Trade:
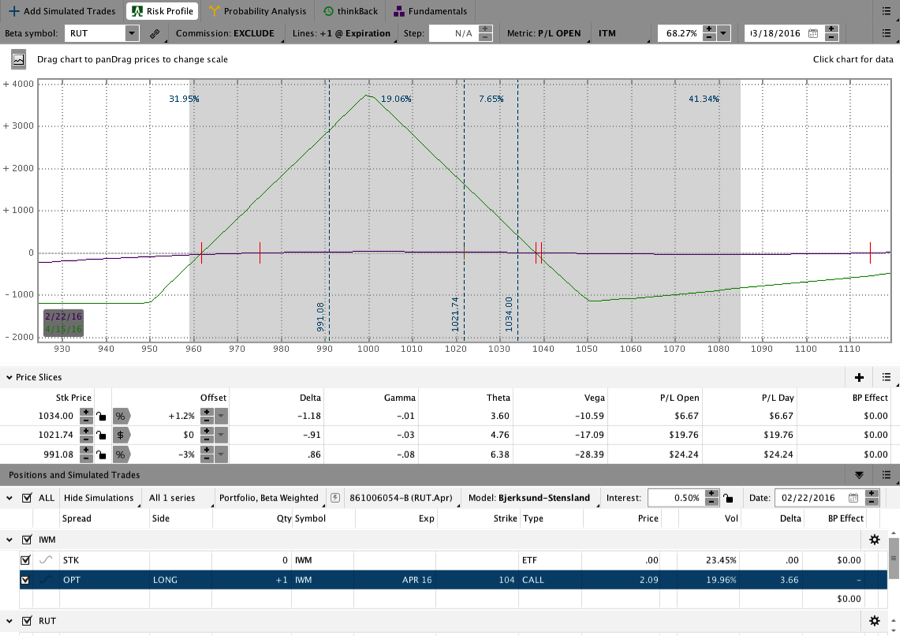
The initial trade was entered February 22, 2016 with RUT around 1020. The image below shows the position at the end of the first day. At entry and over the first few days of the trade everything went well.
Adjustment #1 – Add A Second Butterfly and Call:
The first adjustment made to the April position was to increase size. At the time the trade was entered, I was still in the March position. When that position was closed, I doubled size on the April CIB to reflect the larger capital allocation for the sample account. A better alternative would have been waiting and entering a different CIB in another expiration a week or two later. As mentioned at the bottom of this post, a trade in SPX would also have been a good choice.
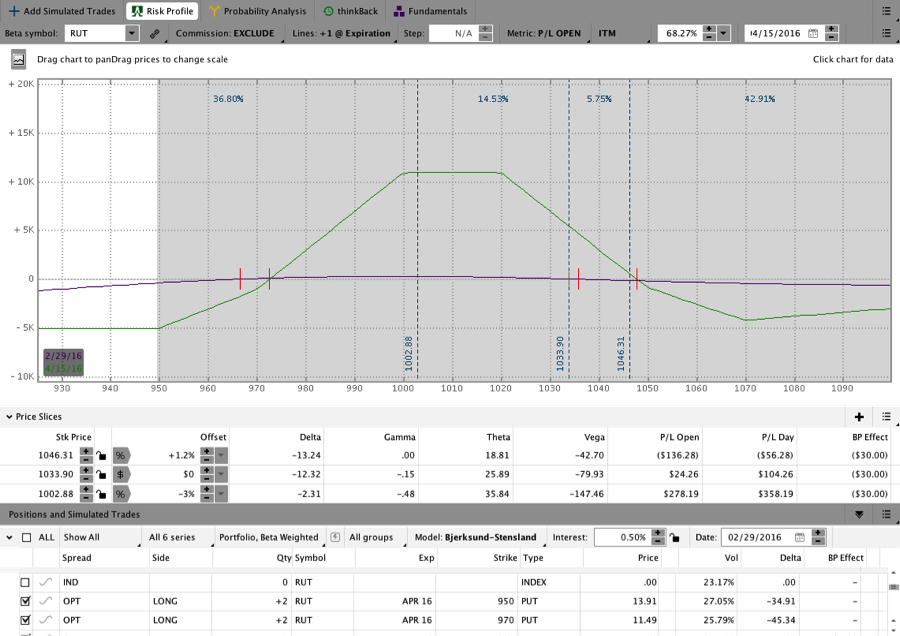
Adjustment #2:
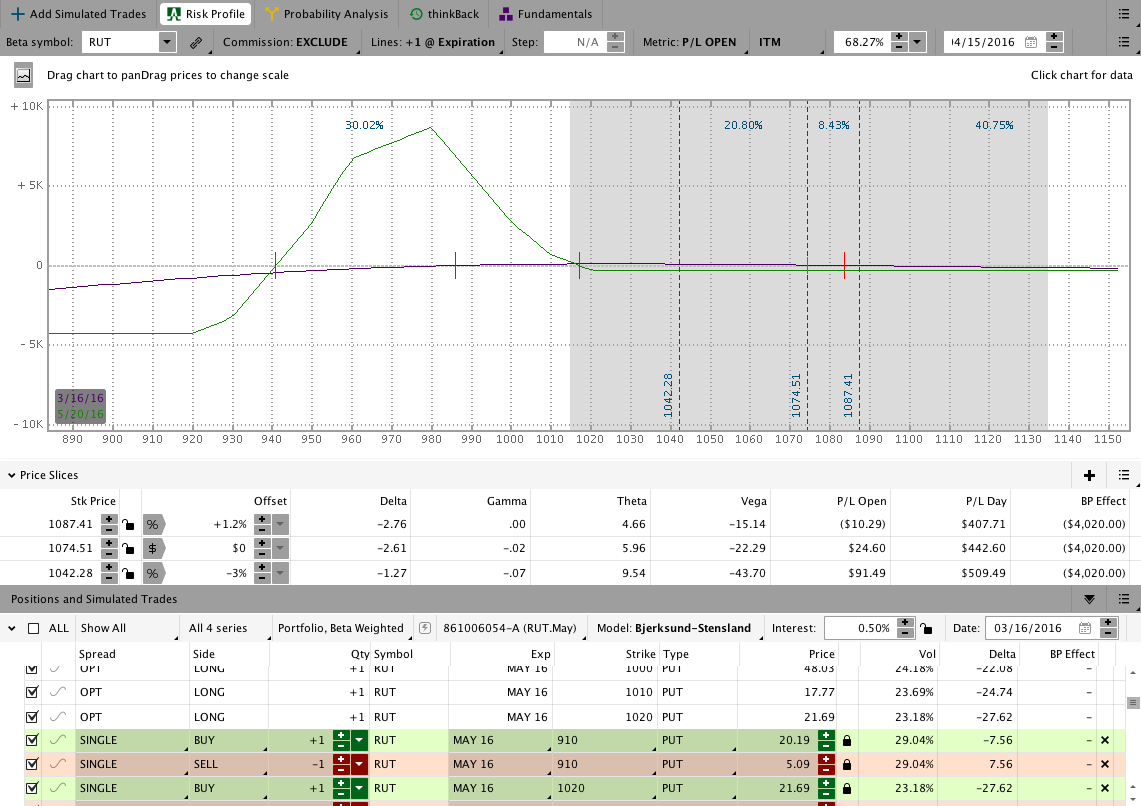
A couple/few days after adding the second fly, the market began the move higher and pushed up and above the upside break even point. As a result, the position was adjusting by adding two additional flies and long IWM calls. The resulting image is shown below with the market sitting around 1033.
Note that 1035 was the top of a larger consolidation area (985-1035) that was discussed regularly on the daily videos for both the April and March trades. Once RUT broke through that level, the market headed higher with conviction.
Adjustment #2:
The following day the market was higher yet again and I added another two flies to the position with long calls to bring the trade up to full size. At this point in the trade I thought the market might back off a bit or at least slow down. I was wrong.
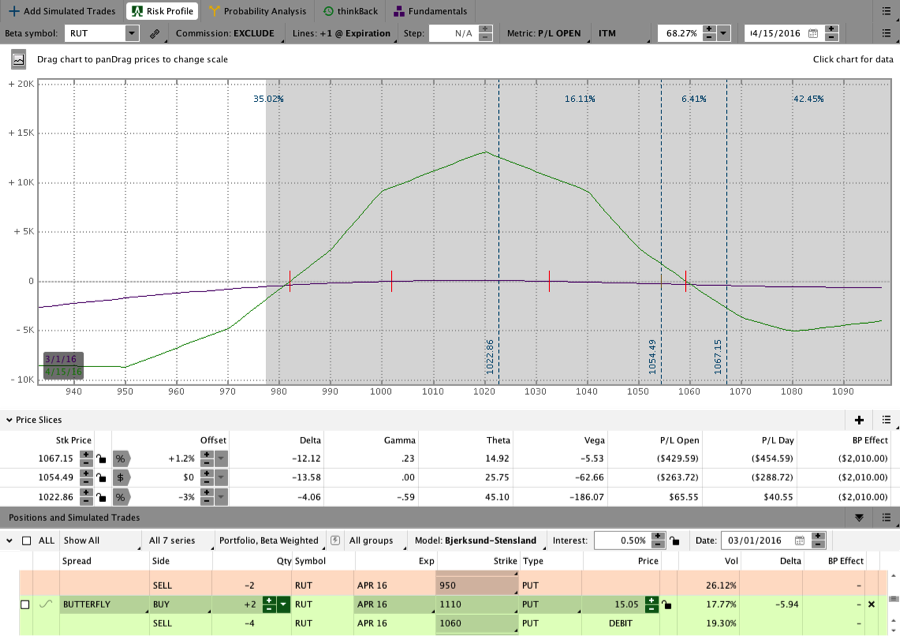
Adjustment #3:
The following day, RUT traded higher yet again and I was forced to roll up two of the two lowest flies. Unfortunately, the market continued to move higher. At the same time, ATM skew was steepening on the rally and (as discussed below) that contributed to the open loss on the trade.
Full Close:
The image above is the last image I have of the position and it was taken the night before the full close. The following morning the market was higher again and the trade was getting hurt by the falling IV. I let the trade hover around max loss for a while before deciding that the market was not making an effort to move lower. That decision proved to be the right decision as RUT traded higher over the following days.
It’s important to point out that at the time of the exit we were able to keep up with the market, but the open losses were stacking up and that made it time to exit. Personally, I’m not willing to incur large open losses with the “hope” that things will work out in the end. Large open losses suggest that something is going wrong and that it’s time to move on to the next trade. Winning on every trade is not a realistic expectation.
Lessons:
This wasn’t a great cycle for the CIB, but every system has losing trades and periods. A shortcoming on my part is that I wasn’t exceptionally bullish into the move higher. Had I been more bullish I would likely have rolled up the after adding the second butterfly rather than adding a third. In this trade, that decision would have helped significantly. We can’t predict where the market will go, but I could have done a better job of recognizing the potential for a fast Bear market rally.
A variation I’ll likely use going forward is to roll rather than add after the second fly when that adjustment point is reached shortly after adding the second fly. Rolling higher gives the position more room on the upside and reduces potential drawdowns if the market continues higher. When it becomes necessary to make multiple upside adjustments day after day after day, it suggests that the market is migrating higher with conviction. We should recognize that conviction and adapt.
Implied Volatility Lessons:
While the directional challenge this cycle was a factor, steepening ATM skew was another major factor. Going back through the individual options on the spreads I was able see where the losses took place. My calculations suggest that around 50% of the loss on the trade was due to Vega. The initial Butterflies began with a relatively flat ATM skew that steepened considerably by exit. Had the market moved less quickly, we may have been able to overcome the steepening skew through time (think Theta). When you combine steeping skew with a fast move higher, the outcome of the trade makes sense. Incorporating skew into trading decisions is something I’ll be working on more going forward.
For more information on skew, check out this post and this one too. The major point is that rising or falling implied volatility isn’t the only thing that matters for a “short vega” trade. ATM or slightly bearish butterflies frequently benefit from rising, rather than falling, implied volatility due to skew changes that tend to accompany that movement.
What about $SPX?
I’ve had some readers ask about trading the CIB in SPX and it’s something I’ve wondered about myself. While I’ve done some back testing in SPX using a variation of the CIB, I just started trading the first SPX CIB. Based on end of day data using TOS ThinkBack, a SPX position entered the same day as this RUT position would still be open and healthy using the SPX CIB variation. There are benefits to diversification and I would have been better off if I had traded one RUT CIB and one SPX CIB rather than two of the same RUT positions.
Click here for the Live Trade Page for the current April5 $SPX CIB. The page is being updated daily with video and comments. You’ll want to check it out if you haven’t already.
Click here for the CIB Trading Course covers the strategy in detail.
The link below takes you to the spreadsheet where you can see the Greeks for the position on a daily basis including the open profit/loss. There are multiple tabs and the daily Greeks are below the order list.
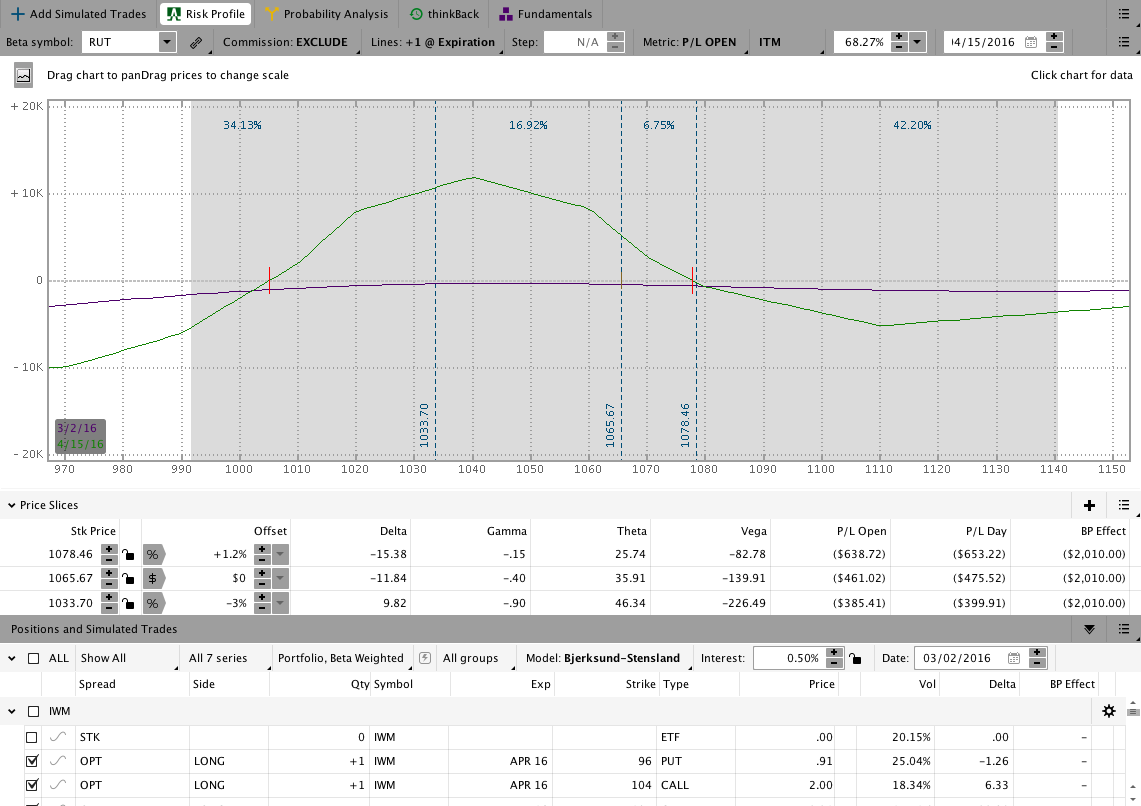
Preview of things to come . . .
During the recent rally, I was also trading broken wing butterfly positions in both RUT and SPX. Those positions have handled the move higher without issue. For those of you following me on Twitter, you’ve likely seen some images of the trades when I tweet out orders/adjustments. The image below shows one of the RUT BWB’s as of the close yesterday. Note that this position was initiated two days after the CIB and at a worse entry price. The order history for the trade is listed on the results tab.
If you read this far, you probably like what you’re reading. Want to receive an alert when new content is posted?

Sign up for my email list and stay up to date with the latest information on options trading.
Click here to sign up for the list, get a copy of the Theta Trend Options Trading System, the Trade Tacker I use, and information about new systems.
Even better . . . it’s all totally free.