Live Trade With Daily Updates – $SPX April5 2016 Core Income Butterfly
Overview:
This post tracks the progress of the $SPX April5 2016 CIB Trade and is updated daily. As always, the information is being presented for educational purposes only and this is not a recommendation to take a trade.
Additional Information on the CIB can be found here and here and the premium course that covers the trade in detail is available here.
I do my best to Tweet trades as they take place and you can click here to follow me on Twitter.
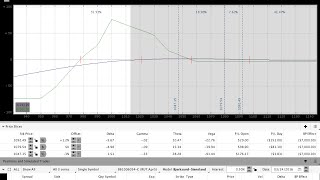
Position Greeks and Order Details (updated daily after the close):
Click here to view the full spreadsheet in another window/tab. Note that the spreadsheet has multiple tabs for previously closed trades.
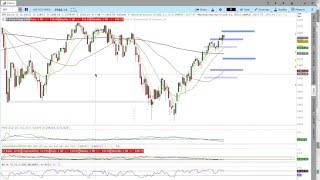
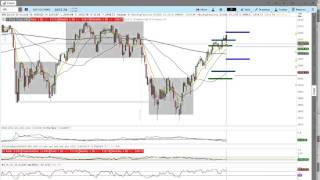
Daily Market and Trade Update Videos:
I do my best to upload videos by 6 p.m. EST.
Due to family issues, I may be unable to post a video every day. At a minimum, I’ll update the spreadsheet and daily comments (below).
-
-
4/11/2016 $SPX Options Income Trading Daily Video
-
9
-
-
-
4/8/2016 $SPX, $RUT Options Income Trading Daily Video
-
9
-
-
-
4/7/2016 $SPX Options Income Trading Daily Video
-
9
-
-

-
4/6/2016 $SPX Options Income Trading Daily Video
-
9
-
-
-
4/5/2016 $SPX Options Income Trading Daily Video
-
9
-
-
-
4/4/2016 $SPX Options Income Trading Daily Video
-
9
-
-
-
4/1/2016 $SPX Options Income Trading Daily Video
-
9
-
-
-
3/29/2016 $SPX Options Income Trading Daily Video
-
9
-
-

-
3/28/2016 $SPX Options Income Trading Daily Video
-
9
-
-
-
3/24/2016 $SPX, $RUT Options Income Trading Daily Video
-
9
-
-
-
3/23/2016 $SPX, $RUT Options Income Trading Daily Video
-
9
-
-
-
3/22/2016 $SPX Options Income Trading Daily Video
-
9
-
-
-
3/21/2016 $SPX Options Income Trading Daily Video
-
9
-
-
-
3/17/2016 $SPX Options Income Trading Daily Video
-
9
-
-
-
3/16/2016 $SPX Options Income Trading Daily Video
-
9
-
-
-
3/15/2016 $SPX, $RUT Options Income Trading Daily Video
-
9
-
-
-
3/14/2016 $SPX Options Income Trading Daily Video
-
9
-
Trade Updates/Video:
April 14, 2016:
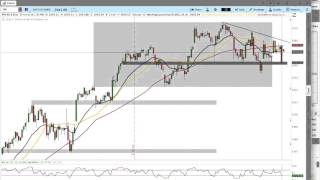
Rather than stay in the trade and test our luck, today I closed the April5 trade for a smaller than desired gain. The spreadsheet above has been partially updated and I’ll fill in the remaining numbers within the next day or two. The position was well inside of 20 DTE and with the move higher, it didn’t make sense to stay in the trade. The market continues to make higher highs and higher lows. Until that pattern breaks, the trend remains sideways to slightly higher. The markets in general are fairly extended and “should” have some sort of pause, but we haven’t seen any signs of that happening yet.
April 12, 2016:
I won’t be able to get a video out this evening, but in terms of price everything remains roughly the same. The S&P found support at the 2040-2043 level early in the day and rallied from there to end the day up slightly. At the same time, the market hasn’t gotten back above the 2066 level on the upside. For the time being the chop continues, but at some point that will come to an end. The April5 CIB is healthy. If we have a slight pullback tomorrow I may simply exit the trade.
April 11, 2016:
The S&P 500 sold off a bit into the close and the market is yet again around the 2040-2043 area. It’s a little premature to expect another large move lower, but when the market repeatedly comes to a level it frequently goes through it at some point. I wouldn’t be surprised to see the market test the lower side of the balance around 2020-2025 or even lower towards the 200 day simple moving average around 2015.
If the market begins to break sharply lower, I’ll be looking for a fast exit on the April5 CIB that is now a BWB. We’ve been in this trade for a while, we’re close to expiration, and it makes sense to keep a close eye on the market. I have toyed with some adjustments that float the entire trade above the zero line, but they won’t do much to significantly increase the profit potential of the position.
April 8, 2016:
Both the Russell 200 and the S&P 500 continued the drift sideways today. SPX sold off early in the day and again found support around the 2043 area we’ve been watching. The bias remains neutral for the time being, with a slight upward bias. Violating key support levels on the downside will obviously make the outlook more bearish and getting back above the recent highs would be more bullish. For now we’re drifting sideways and that’s fine by me.
The April5 CIB that is now a BWB is doing well and safe. If the market can continue to sit still for a while longer we may be able to close the position next week.
April 7, 2016:
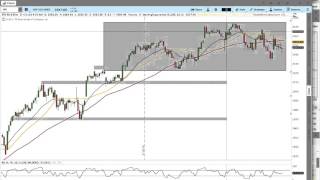
Ahh, I’ve always loved red candles. Today the market pulled back in what looks like a short term reversal of the move we saw yesterday. The market tested the 2043 area we’ve been discussing and finally fell through that level, traded lower, and then reversed to close right around it at the close. In the short term my bias is starting to turn a little more neutral, but if SPX can get back up and above the recent intraday high around 2066 it will shift back to more neutral to bullish. On the downside we should keep an eye on levels in the 2015-2025 area.
The area around 2020-2025 is a recent intraday low and violating that level would create a more significant lower low on the intraday timeframe. The 2015 level represents the widely watched 200 day simple moving average. Since the 200 day SMA is used by many participants to assess the longer term market trend, it’s importance becomes something of a self-fulfilling prophecy.
It’s important to keep in mind that markets can both trend and balance or consolidate. Right now it seems like the market may be balancing a bit after this big move higher because we’re seeing more overlapping candles on a daily basis and more range bound price action.
The April5 CIB that was converted to a BWB is still chugging along and healthy for another day. I added to the June1 BWB yesterday and forgot to make mention of that at the time. For those of you who follow the results spreadsheet, you may have seen the order entered there yesterday. The video above goes through both positions.
April 6, 2016:
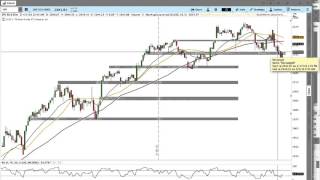
The market made another higher high on the shorter term timeframes and the potential for SPX to push up and above the 2075 area still exists. For now the shorter term price action remains neutral to bullish. The 2055 level we discussed yesterday is where the market found support intraday before running up into the close. On the downside, support around 2043 will be important going forward. The market has tested that level several times now and failed to break lower. Failure there would be reason to question the advance. The goal in looking at price levels is to identify locations where a change might take place. For now, the market hasn’t given us a reason to think anything has changed even though price is very extended beyond the February lows.
The April5 CIB was effectively converted to a Broken Wing Butterfly today in an effort to protect the open profit on the trade. The position is very close to expiration and had a significant amount of price risk that I didn’t feel comfortable carrying. If the market had moved definitively higher, we would have struggled to adjust the trade with such a limited number of DTE. See this video for more information on the adjustments.
April 5, 2016:
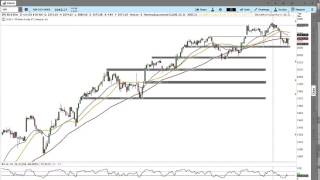
The market had a little more of a definitive pullback today and closed below the rising 10 day simple moving aver for the first time since late February. At the same time, the market hasn’t violated any key downside levels. Going forward, we’ll want to keep an eye on the 2020-2025 area on the downside and the 2055 area on the upside. Getting below the lower level would create a lower low on the 65 minute timeframe and be reason to question the advance. Getting back up and above the 2055 level would indicate that the market may continue to move sideways to higher in the short term.
The position is in good shape as of the close today and I’m hoping for an opportunity to exit this week. The trade has 24 days to expiration.
April 4, 2016:
We did see a little bit of a pullback in the market today, but it’s still too early to get overly excited about the downside. The market continues to hold previous support levels and it makes sense to remain cautious on the upside. At the same time, it’s good to recognize the distance the market has traveled and recognize that the potential for a pullback exists. The question is when. On the downside, I’ll be watching the 2055 level to see if the market can get below and hold below that level. Doing that would be encouraging on for the downside.
The April5 CIB appreciated the pullback today and the trade is back to an open profit. For the time being there’s nothing to do other than wait. We’re at 25 days to expiration and my hope is that we’ll close the trade sometime this week or early next week at the latest.
April 1, 2016:
Despite the fact that the market has made a large move and “seems” overbought, it continues to find support on the short term timeframes (65 minute) and it still hasn’t given us reason to question the advance. SPX is getting very close to touching the late December high around 2,082 and slightly beyond that lies the 2,100 level. On the downside, the first level to watch is around 2,040 where the market found support this morning. That being said, we haven’t seen any reason to expect a breakdown.
I adjusted the CIB today by adding a second fly on the upside when the market clearly did not want to move lower. I’ve been slow to adjust the position higher because we’re so extended, but the pattern of higher highs and higher lows continues. We also look at the June1 BWB in the video and talk about some potential scenarios on that trade. The spreadsheet is up to date as of the close.
March 31, 2016:
I’m not in a position to make a video this afternoon either, but I hope to be able to get one out tomorrow. The spreadsheet has been updated and the position is just the upper butterfly and one long call. We’re close to expiration and if there’s a little bit of a pullback the position will likely be closed for a small profit. Due to other positions in the sample account, I have not added another butterfly to the trade and am just sitting in the single fly.
The market continues to hold up and above the 2057 level, but an advance from there has been slow to materialize. It will be interesting to see if the market holds that level through the end of trading tomorrow. On an intraday basis, both yesterday and today saw some selling at the close and given the size of the recent advance I’m starting to question the markets ability to push higher in the short run. I guess we’ll just have to wait and see what tomorrow holds.
March 30, 2016:
I’ve been away from the computer today and will not have a chance to post a daily video. I’ll update comments and the spreadsheet this evening. I did close the lower butterfly this morning, but did not add to the position.
March 29, 2016:
It looks like ‘ol Janet is on a path to save the markets yet again. The S&P 500 pushed higher today on the back on some Fed comments, but the move was much smaller than the move in RUT. We can be thankful that the CIB is in SPX right now because the market has been making more controlled moves.
Despite the move higher, SPX failed to get up and above the recent highs around 2057. If the market does push through and hold that level tomorrow I’ll be adjusting the trade on the upside. I did get filled on the Reverse Harvey adjustment that was discussed in yesterdays video and that adjustment protected the upside with the move higher today.
The main level to watch tomorrow is around 2057. A definitive break above and holding that level will be reason to make an upside adjustment. I won’t make an adjustment if the market fails to hold that level.
March 28, 2016:
The market closed unchanged. Again. And it’s a wonderful thing that options sellers should all be excited about!
The technical levels are still the same and we haven’t seen the market violate any key levels in either direction. We do see implied volatility ticking higher slightly while historical or realized volatility continues to contract. In the video we look at the Apr5 CIB and the June1 BWB. Both trades are healthy and well within guidelines.
March 24, 2016:
It’s sort of like a Friday so I thought I’d give you a little bonus in the daily video today. Specifically, the daily video has a sneak peek at some Broken Wing Butterfly trades that I’ve been testing. That content begins around the 11 minute mark in the video.
The trades are a RUT BWB that I’ve been trading since late February through the move higher and a new BWB that was opened in SPX yesterday. The RUT trade shows you how the position morphs over time with adjustments. The SPX trade shows you the position at inception.
It was a relatively uneventful week in the markets and both the S&P 500 and Russell 2000 seem to be drifting slightly sideways on a shorter term basis. The April5 CIB is open and healthy.
March 23, 2016:
The equity markets pulled back a bit today, but the move lower was controlled and no key levels were violated. For the time being the short term trend remains neutral to higher, but the Russell 2000 looks weaker than the S&P 500 on both an intraday and daily basis.
I wish the market had given us more reason to be bearish. I made a Reverse Harvey adjustment to the SPX April5 CIB to protect the position if the market does trade higher. While that scenario “seems”unlikely, it is entirely possible. For now the market continues to drift and volatility has been contracting. Order details for the Reverse Harvey are included in the updated spreadsheet above.
March 22, 2016:
The market was unchanged again today and the CIB appreciates the slow movement. For the time being, the market continues to hold short term support levels and make new highs. On the downside, violating and holding below the 2040 level will be reason to look for a move towards 2025. If we have a minor pullback like that we’ll likely be adjusting the trade to lock in profit and flatten the T+Zero line.
The trade is starting to get a little short delta, but I have been slow to make any upside adjustments. With the move higher the potential for a slight pullback exists and any adjustment means we’ll give up some of the profit on a move lower. The tradeoff is that we’ll take a little more pain if the market moves higher quickly.
March 21, 2016:
The markets had an essentially unchanged day today with a slow chop slightly higher. In many cases sideways price activity precedes a pullback and I’m starting to wonder if we might have a slightly pullback towards the rising 5 and 10 day simple moving averages. At the same time, the market continues to hold higher levels and drift up.
The CIB is still open and healthy, but is starting to get a touch short delta. I’ver been slow to adjust the delta because any adjustment will make a potential pullback less favorable. If the market trades through and holds 2060, we’ll be rolling up the lowest butterfly.
March 18, 2016:
There won’t be a video posted on Friday, March 18th. I’m traveling and won’t have internet access. Market comments and the spreadsheet will be updated on Saturday.
March 17, 2016:
The market continued the move higher today and filled the January 4th gap we’ve been talking about. All of the major equity markets have had fairly significant runs and it wouldn’t be surprising to see a slowing of the trend and/or some consolidation. The recent swing from early February to today sits around 13% in the S&P 500 and that percentage is similar to previous percentage swings that corrected.
The April5 CIB was adjusted on the upside today with a split strike butterfly or condor. I chose to use a split strike variation to keep the T+Zero line slightly flatter in case the market does continue to 2060 or higher. The position is sitting at 43 DTE and will begin to decay relatively quickly over the next week or two. As of the close today the trade is healthy and the Greeks are under control.
March 16, 2016:
Today the market had a small pop higher following the Fed announcement, but the larger push to fill the gap from January 4th still hasn’t happened. Prior to the announcement I chose to Reverse Harvey the SPX CIB to protect the open profit in the case of a significant move higher. I knew that I would be unable to watch the market all afternoon and that was a factor in my decision.
On the shorter term timeframes, SPX remains in a short term uptrend and has not violated any significant downside levels or given us reason to question the rally. The 2010 area acted as support again today and violating that would likely take the market down into the 1990-1995 area. The more critical short term support is down around 1970. If the market continues higher up and above 2040 I’ll be looking to add a second butterfly to the trade with a corresponding SPY call. As of the close, the trade is healthy and the Greeks look good.
March 15, 2016:
Quick note – the daily video tomorrow will be released later than normal. My hope is that it will be available by 8-9 pm EST.
The S&P 500 had a relatively uneventful, choppy day ahead of the Fed announcement tomorrow. On the shorter term timeframes, the market remains in an intermediate uptrend and has not significantly broken down. The market is very close to filling the January gap lower that sits around the 2045 area and it wouldn’t be surprising to see that gap filled in the near future. On the downside, violating the 1970 area would give us reason to question the recent rally.
The Russell 2000 was off quite a bit more than the S&P 500 today, but remains in a short-term sideways to uptrend. On the intraday, 65 minute timeframe, the market has not made a lower low even though it has made a lower high. The price action seems more neutral than the $SPX, but violating the 1055 area on the downside would be reason for concern.
From a trading standpoint, I won’t make any predictions about the Fed announcement. Our job is to react to, rather than predict, changes in the market. We do, however, care about when the market has the potential to move. The $SPX CIB and other Broken Wing Butterfly trades in the sample account have healthy buffers for typical market moves.
March 14, 2016:
For those of you who have been wanting to see the CIB in $SPX, it’s your lucky day! Today we opened a new CIB using $SPX options. The trade is in the Apr5 $SPX weeklies rather than $RUT because I have existing positions in that series that would have created some overlap issues.
The short term themes in the market are bullish even though the longer term picture is more likely distribution or decline. On the upside, a key area will be the 2040-2045 neighborhood where $SPX gapped lower on January 4th. That gap remains open and we are close to a fill. On the downside, 1970 will be an important short term support level for the market.
With the Fed speaking on Wednesday the market has the potential to move. If we don’t fill the 2040 gap tomorrow, I wouldn’t be surprised to see a stop run up to that level following the Fed. The market has traveled a significant distance in a relatively short amount of time, but the short term price action remains in a pattern of higher highs and higher lows.
Don’t miss out. Want to receive an alert as soon as new content is posted?

Sign up for my email list and stay up to date with the latest information on options trading.
Click here to sign up for the list, get a copy of the Theta Trend Options Trading System, the Trade Tacker I use, and information about new systems.
Even better . . . it’s all totally free.