Implied Volatility Riddles – Do I Stand Corrected On Vega?
In a word, no . . .
 The other day I presented the CIB to the Capital Discussions audience. One of the things I mentioned is that it seems like the CIB tends to benefit from an increase in Implied Volatility despite the fact that it’s a negative Vega trade. Based on a few anecdotal conversations with other traders, they’ve have similar experiences.
Since Butterflies are negative Vega trades, we’d obviously expect the trade to lose a little money with an increase in implied volatility. The reality is that things don’t always play out that way in real life and that phenomenon is something I discussed a while back in this post.
In the comments of that post someone brought up the fact that a slightly bearish Butterfly is short Delta and that the short Delta is more the reason for the increase in value. I don’t disagree that Delta plays a role, but the negative Vega is also lying to you. Specifically, the relative changes in implied volatility of the individual options can impact Butterflies in ways you wouldn’t expect when you look at Vega for the position as a whole. (Wow, that was a mouthful). The example discussed in the post above illustrates that concept. IV rose across the board and Vega helped, rather than hurt, the position.
In this post we’re going to go back through that example and hopefully this explanation will shed a little more light on how an increase in Implied Volatility doesn’t always hurt a short Vega trade.
Context:
For simplicity and ease of comparison, I’ll use the same position discussed in the post that’s drawing the questions. You may want to read that post first for some initial background.
This post looks at the same IWM Butterfly on 11/26/2014 when IWM closed at 118.45. We’re interested in the changes that are taking place between that date and 12/1/2014 when IWM closed at 114.87. Over those 5 days, the market fell around 3% and Implied Volatility increased. How much Implied Volatility increased is open to interpretation, but all of the options in the Butterfly increased in IV and RVX went from 17.47 to 21.68 so I think we can reasonably say that it increased.
The image below gives a break down of the individual options and their prices:
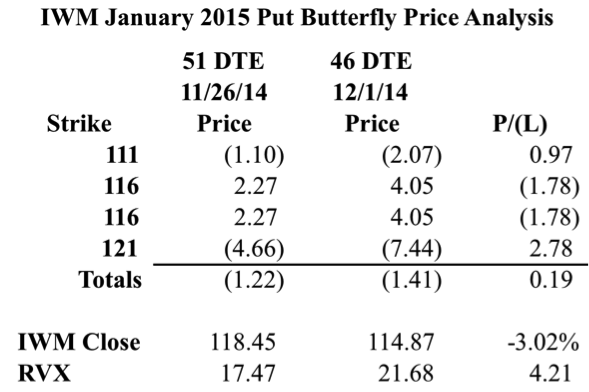
In the image above we can see that the trade was up a little bit of money even though the market moved down and IV increased. We also know that the position was short Delta and Vega and positive Theta when it was entered. The question is whether or not we can attribute any of the open profit to an increase in Implied Volatility. I say we can.
Calculating Changes in Implied Volatility
In order to know if an increase in IV helped the position, we need to look at where and how IV changed. In the image below, I’m looking at the IV changes for the individual options. I’ve calculate the actual change and then something I’m calling the expected change.
To calculate the expected change I averaged the implied volatility of the individual options. I took the averages on both dates and the difference is what I’m calling the expected change. In reality, the specific value for expected change doesn’t really matter that much. The point is to see the impact of increasing the IV of all of the options by a fixed amount. When you say your position is short Vega, you are doing just that. You’re looking at the sum of Vega and applying a change to the position as a whole.
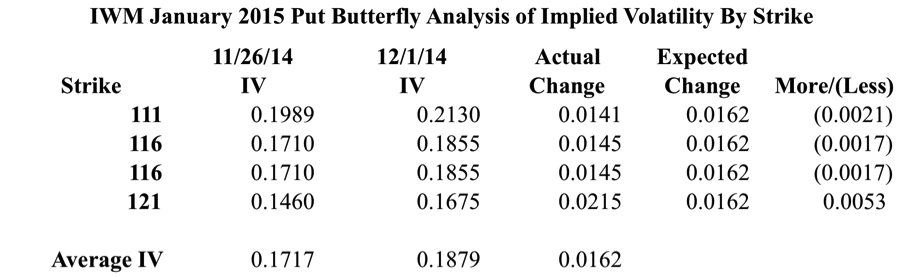
One of the really interesting observations in the table above is that the options that were originally OTM all increased less than we would have expected. Additionally, the originally ITM option had a spike in IV that was greater than we expected. The ITM option is what’s interesting because it’s the part of the position where IV is helping the Butterfly.
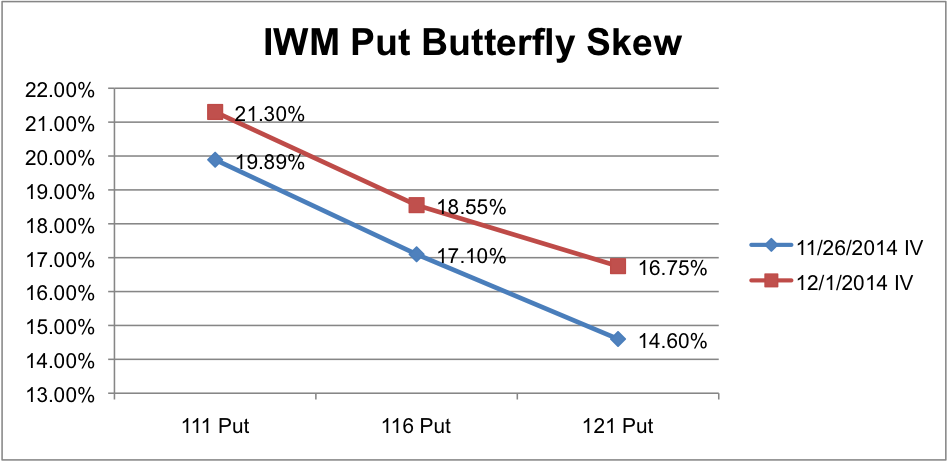
The image below shows the IV skew for the position on the two dates. Notice how the 121 strike bumps up more than the other options.
What about Dolla Billzzz?

Knowing the changes in IV is great, but it’s more relevant to translate those changes into dollars. The next step in the analysis is to see how the Actual and Expected Changes “should” have impacted the position.
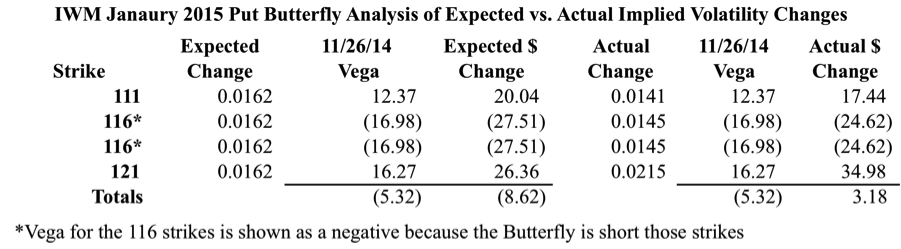
As you can see in the image below, Vega for the position as a whole is negative. The long options carry positive Vega while the short options carry negative Vega. Based on the expected increase in IV, we’d expect the position to be hurt by the increase in IV. In reality, something different happens.
When you take the Actual Change in IV for the individual options and multiply it by the Vega, you show a small profit for the Butterfly. This is the crux of the issue and where reality diverges from what we’d expect.
The challenge in this discussion is isolating the change in IV and how it impacts the position. While the discussion up to this point seems convincing, it does make sense to validate what we’re seeing using some sort of pricing model.
Okay, so what does the pricing model say?
I know traders can be skeptical people (myself included). Since the numbers above might still draw criticism, we’ll drop the same scenario into an Excel Black Scholes pricing model. One of the interesting things is that the model prices the options slightly under the market price, but for our analysis that shouldn’t matter.
In the scenarios below, I looked at the Price Change, Day Change, and IV Changes for the Butterfly. In the first scenario we’re looking at the Expected Change or what happens when you look at Vega as a whole. In the second scenario, we’re looking at the Actual IV Change by strike and the theoretical Profit/(Loss).
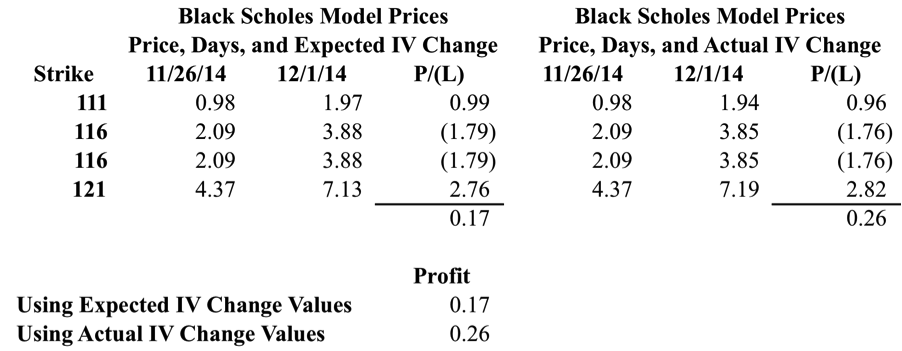
What we’re seeing in the table above is that the theoretical profit on the position is greater when we use the Actual IV changes. In other words, the trade can benefit from an increase in Implied Volatility even though the position is “Short Vega.” When we say that an IV increase will hurt a short Vega position, we’re not taking into account changes in skew.
What’s the take away?
The point is that a change in implied volatility isn’t the only thing that matters. In fact, when we hear that the VIX is up, it doesn’t necessarily mean anything even if we’re short Vega. The relative changes of the individual options (skew) is what ultimately drives the spread.
There are a lot of myths and riddles around options pricing and I’m interested in hearing your thoughts on the discussion above. Let me know what you think in the comments below . . .
Please share this post if you enjoyed it.
Want to receive an alert when new posts come out?

Sign up for my email list and stay up to date with the latest information on options trading.
Click here to sign up for the list, get a copy of the Theta Trend Options Trading System, the Trade Tacker I use, and information about new systems.
Even better . . . it’s all totally free.