Weekend Market Commentary 3/18/2016 – $SPX, $VIX, $VXV
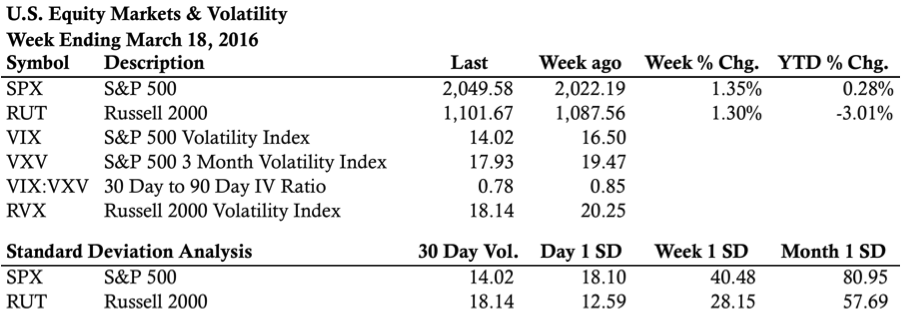
Market Stats:
Big Picture:
Recognizing our biases in the context of what’s playing out is essential for long term success in the markets. For example, I recognize that I almost always believe stocks should decline. At the same time, I understand that historically they’ve moved higher. The entire investment industry is built on the notion that stocks always rise over time and, given enough time, that notion has been true. *It pains me to write that.*
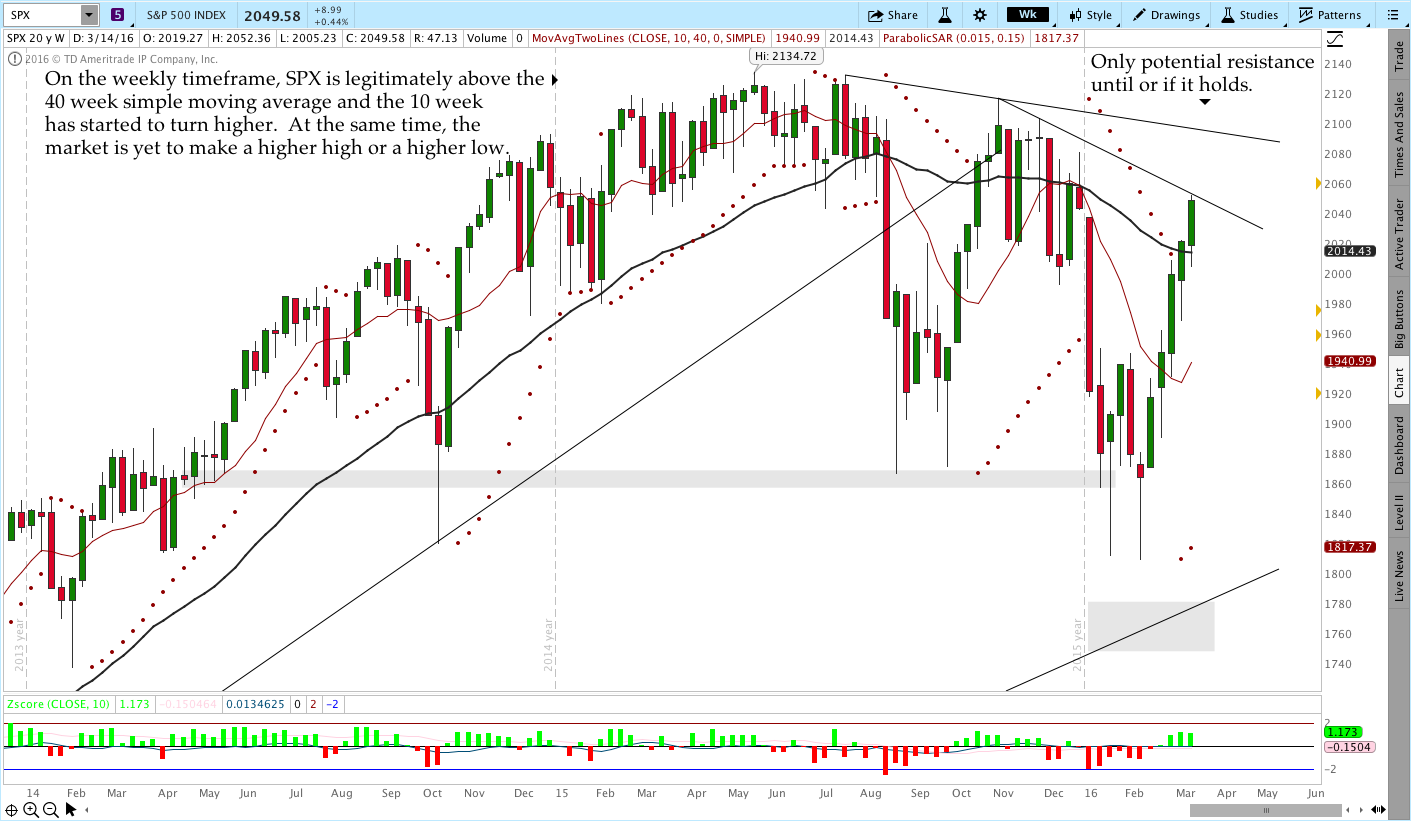
I’ll be the first to admit that the market has staged an impressive short-term, short covering, likely government aided swing higher in recent weeks, but I’m not ready to give up the dream of a bear market this year. We do need to recognize that the short or intermediate term uptrend is starting to trickle into the higher timeframes. That behavior gives us reason to recognize the potential for a shift in direction. For now, any sort of shift is still only potential.
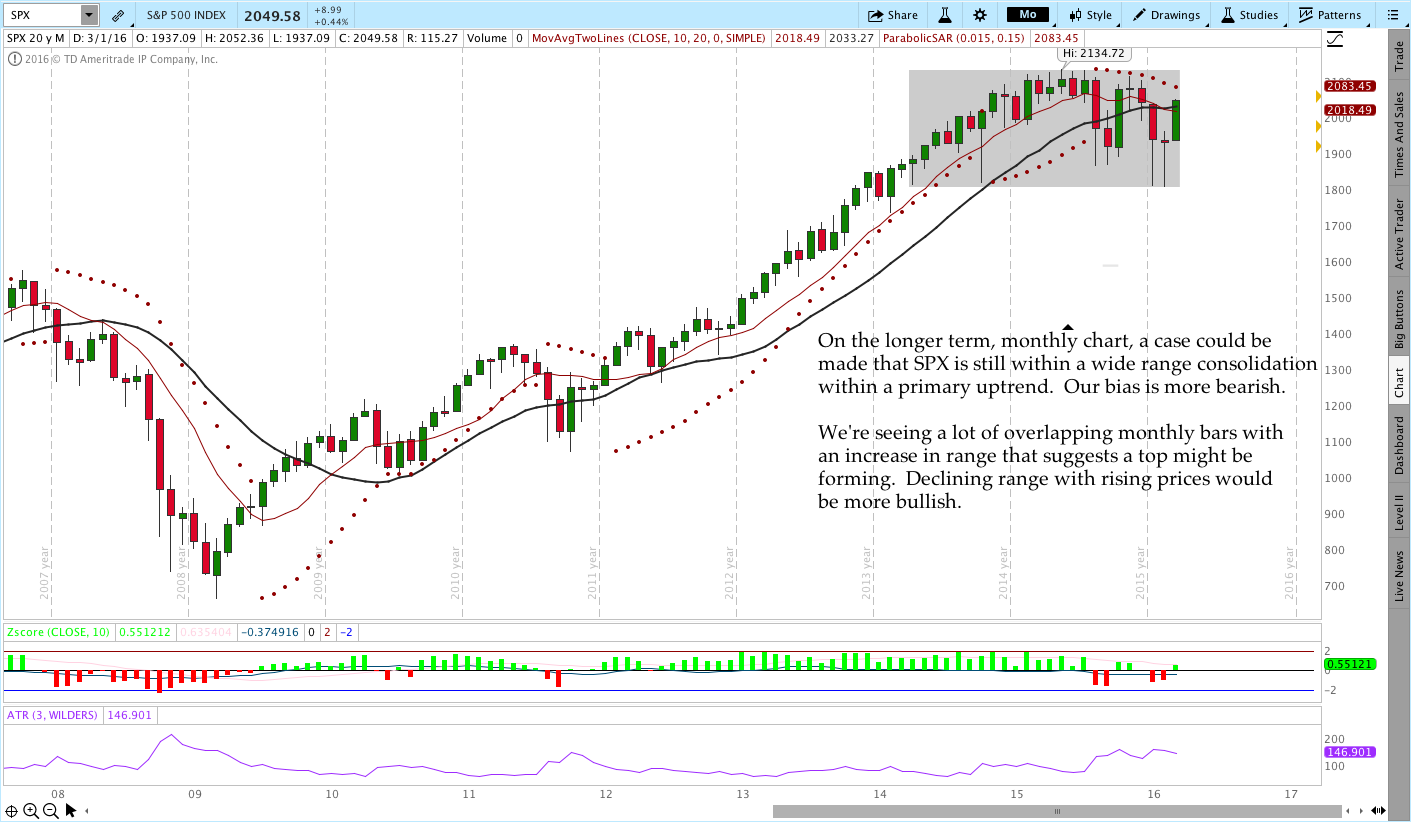
On the longer term timeframes we’re still within a larger consolidation or distribution and it’s premature to get overly excited about the potential for the next bull market. On that same note, some (more optimistic) participants might say that the we’re just in a consolidation within a primary uptrend.
Volatility:
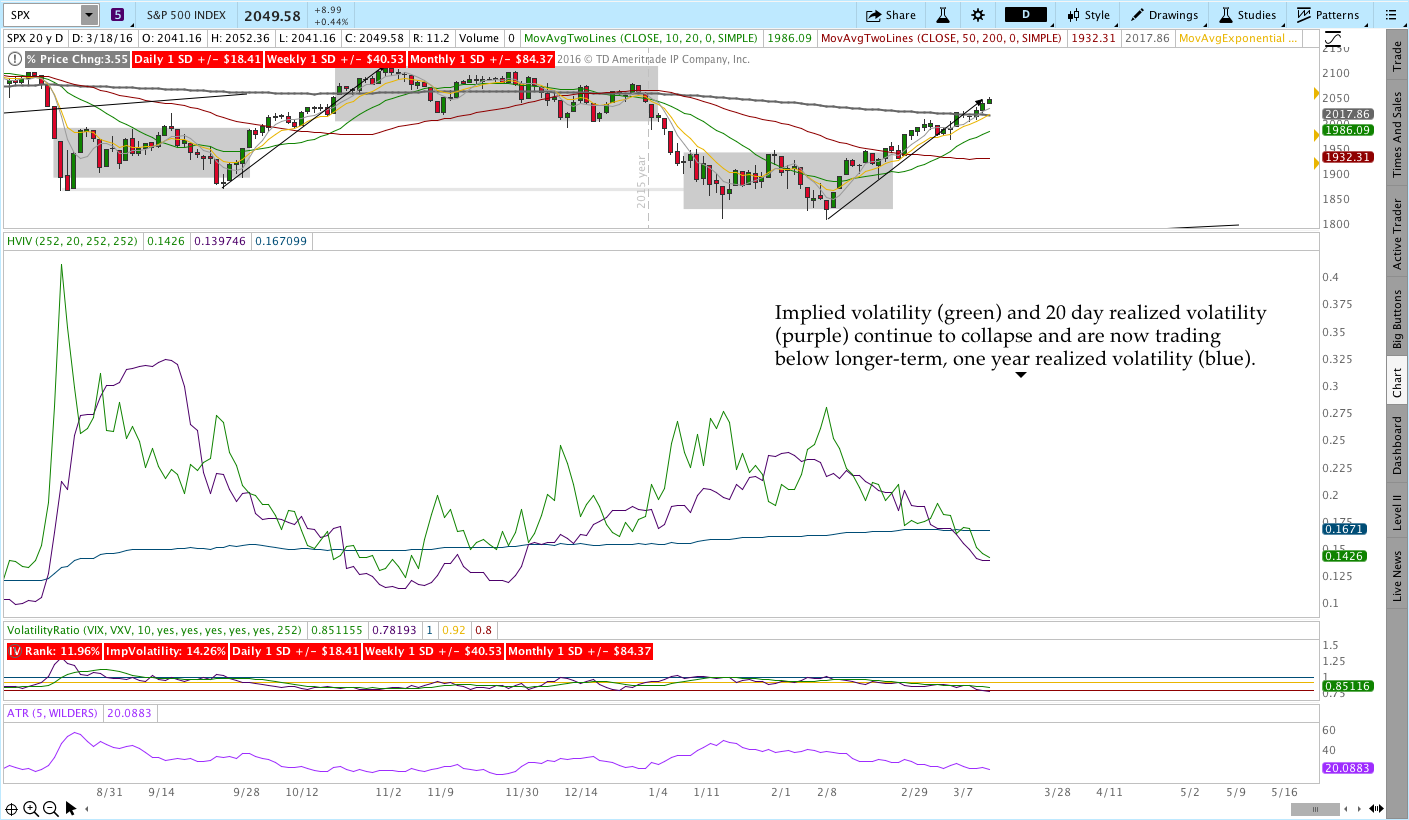
I’ve said it before, but volatility has been a great confirming indicator in 2016. Earlier this year we saw a divergence in the VIX:VXV ratio during the February low. Clearly that divergence confirmed the recent move higher. Around the same time, we also saw a collapse in implied volatility and a divergence in short term realized volatility. Additionally, volatility never suggested panic during the move lower in January. In other words, volatility has been leading and getting it right.
As of the close on Friday, volatility is giving us some reasons for short term caution. We know that volatility, like the market, tends to move in waves. Periods of low volatility tend to be followed by rising volatility. At the same time, low volatility can persist for a surprisingly long period of time. The longer term trend in volatility (via 1 year realized) is still rising. If that trend continues, we can expect realized and implied volatility to rise in the near future.
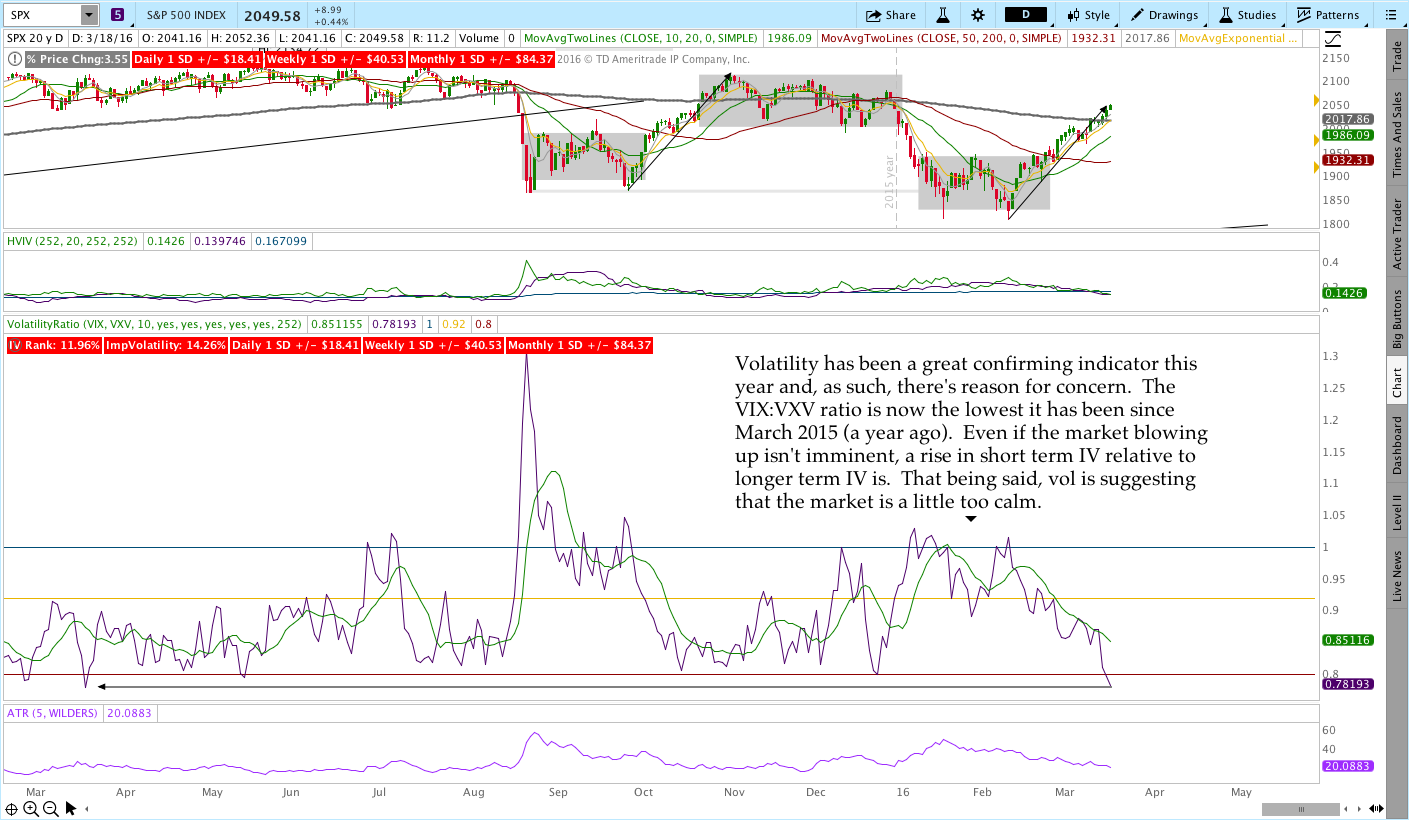
There’s so much complacency in options land that the VIX:VXV ratio is now back to early 2015 levels. My hunch is that people have been quick to sell premium with the move higher and now short term premium is depressed in price. In general, volatility is suggesting a “healthy market.” However, price action in the market is far less clear. In the coming weeks and months we’ll see what happens, but volatility as an indicator is either setting up for a great market call or a great bull trap. Time will tell.
Levels of Interest:
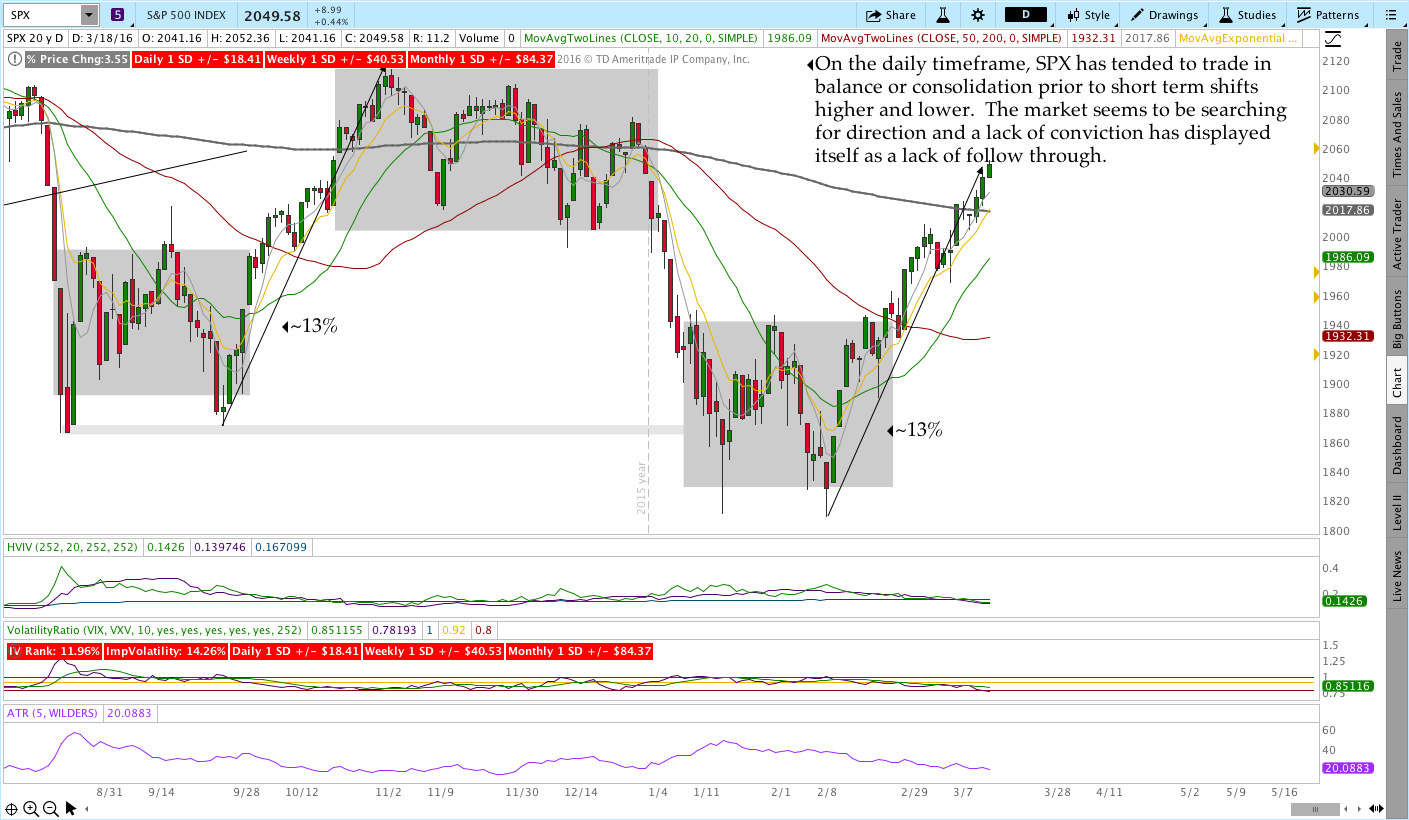
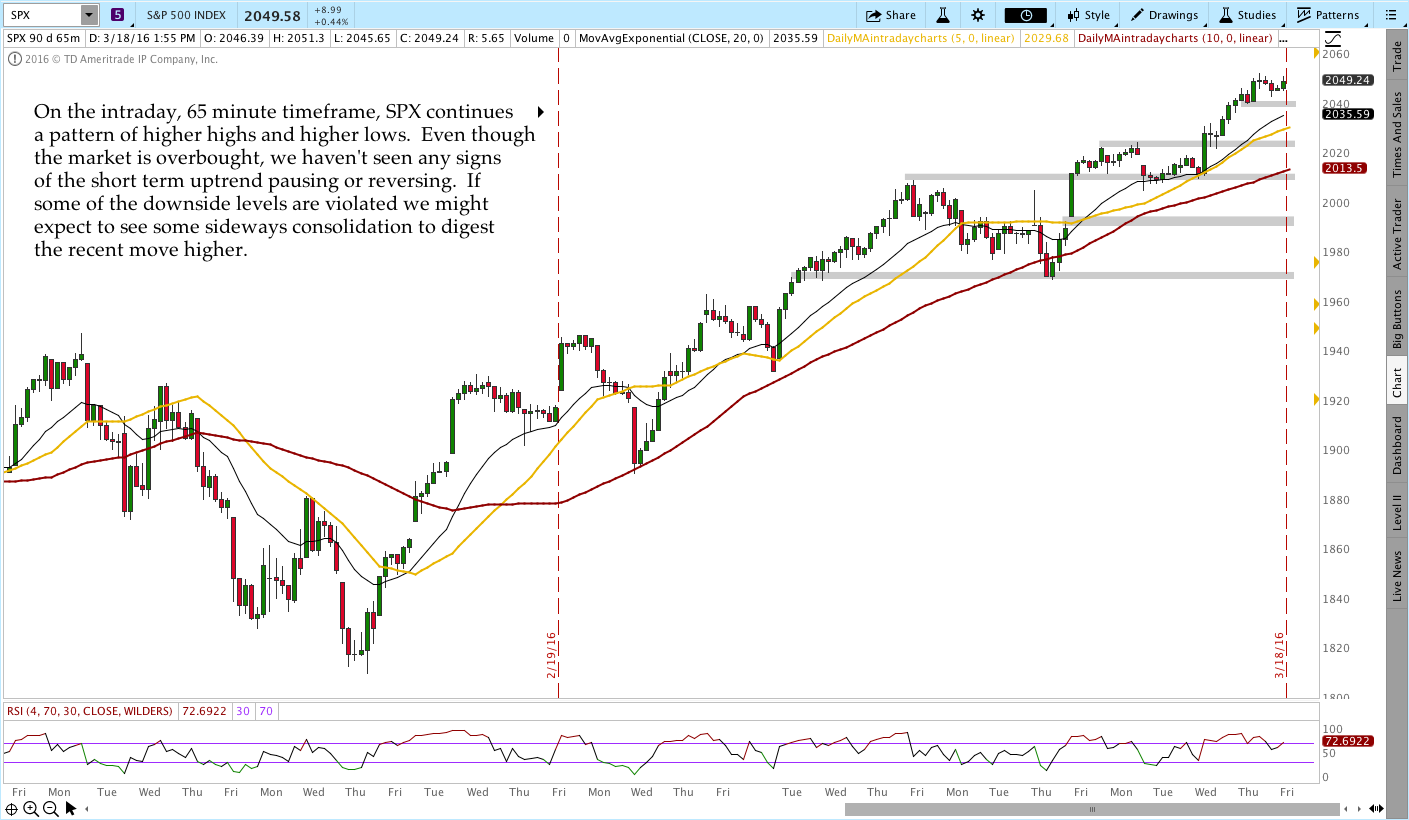
In the levels of interest section, we’re drilling down through some timeframes to see what’s happening in the markets. The analysis begins on a monthly chart, then weekly chart, moves to a daily chart, and finishes with the intraday, 65 minute chart of the S&P 500 (SPX)). Multiple timeframes from a high level create context for what’s happening in the market.
S&P 500 – $SPX (Monthly, Weekly, Daily, and 65 Minute Charts):
Live Trades . . .
The “Live Trades” section of the commentary focuses on actual trades that are in the Theta Trend account. The positions are provided for educational purposes only.
——————————
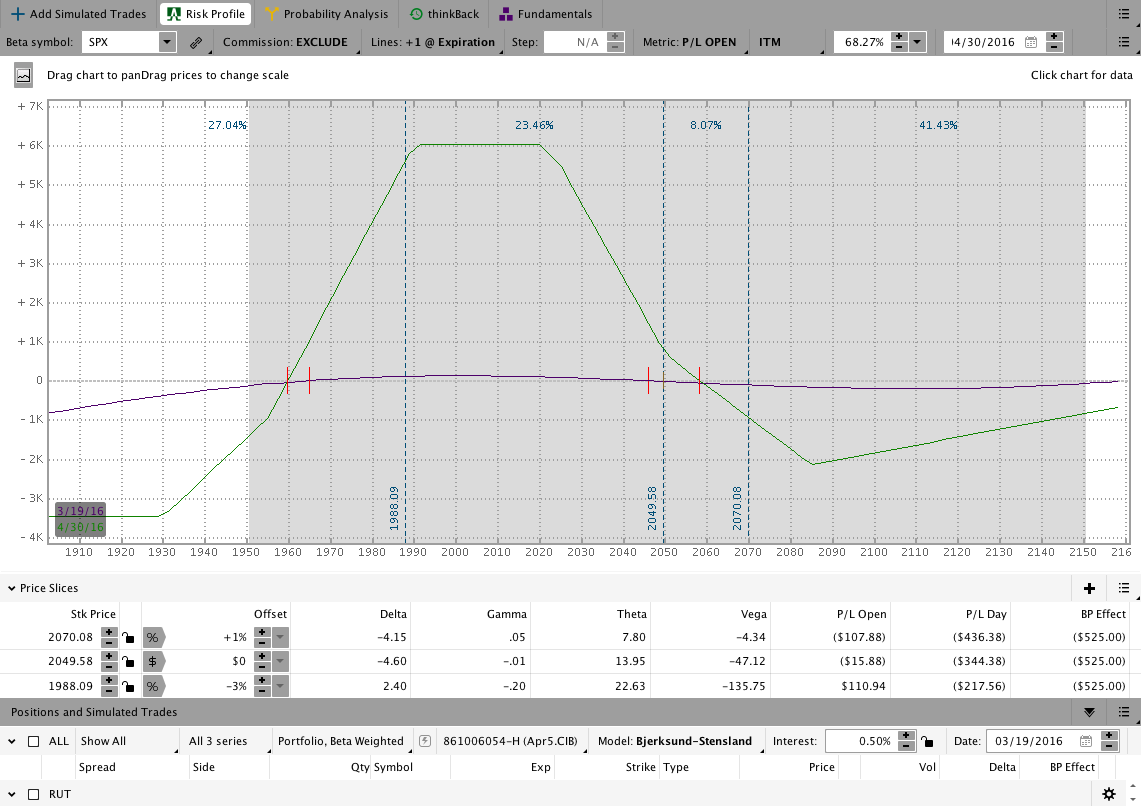
The April5 $SPX CIB is open and healthy. We’ve had a bit of a move up in $SPX this week, but the range and movement has been far less volatile than $RUT. An image of the position as of Friday is shown below.
For more information on this trade, check out the Live Trade Page with daily video updates and comments.
$SPX April5 2016 Core Income Butterfly Trade:
If you want to learn a safer, less painful way to trade options for income, check out the Core Income Butterfly Trading Course.
Looking ahead, etc.:
It’s my view that volatility is telling us things are a little too okay, but we haven’t seen any signs of price breaking down. Fast moves higher are resolved over time and/or through price. Due to the size of the recent swing, some pause wouldn’t be unlikely. At the same time, I don’t expect significantly lower prices in the near future and some part of me thinks we could see a vertical blow off to finish the recent move.
Have a great weekend and please share this post if you enjoyed it.
Click here to follow me on Twitter.
Want to receive an alert as soon as the next market commentary is posted?

Sign up for my email list and stay up to date with the latest information on options trading.
Click here to sign up for the list, get a copy of the Theta Trend Options Trading System, the Trade Tacker I use, and information about new systems.
Even better . . . it’s all totally free.