Consistent Income Butterfly – Another Options Trading Strategy For Small(er) Accounts
 Have you ever taken a big loss on an Iron Condor or a Vertical Spread?
Do you know what it feels like to sell a weekly vertical spread (DANGER!) only to see the market rip towards your short strike and tear your face off? Alternatively, have you sold an Iron Condor right before the market went racing higher or lower?
Did you adjust or just panic and get out only to watch the market reverse before expiration? Trust me, I know the pain. I’ve been there. Nobody ever said trading would be fun, did they?
Fast directional movement is one of the biggest challenges we face as non-directional options income traders. While there are numerous ways to avoid, hedge, or adjust for market movement, an even simpler way is to begin with a position that doesn’t care what happens.
Specifically, I’m talking about the Consistent Income Butterfly (CIB or CI Butterfly) that I’ve been trading since last summer. You’ve also seen the CI Butterfly in the Weekend Market Commentary. The CIB is more dynamic than the Migrating Butterfly and has a much greater potential profit with more less delta risk. The CI Butterfly could be traded with as little as $5,000, but $7,500-$10,000 per position is recommended.
The CIB is a non-directional, market neutral Butterfly options strategy. The trade begins with a very flat T+Zero line and moves with the market to avoid big losses. While the CIB isn’t the simplest trade in the world and requires some active management, the risk/reward is very favorable. I’m a pretty risk adverse trader and that played a big role in how I designed the trade.
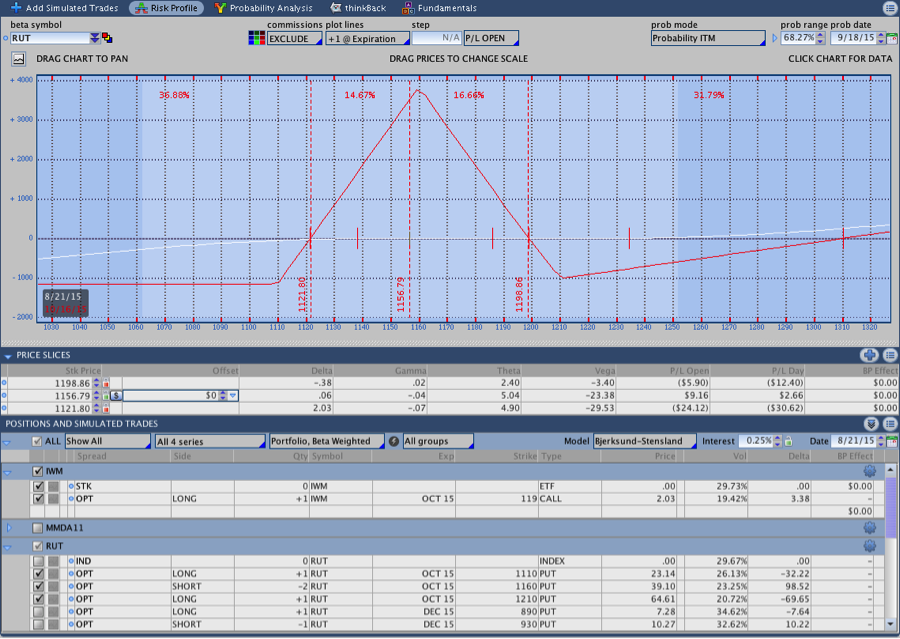
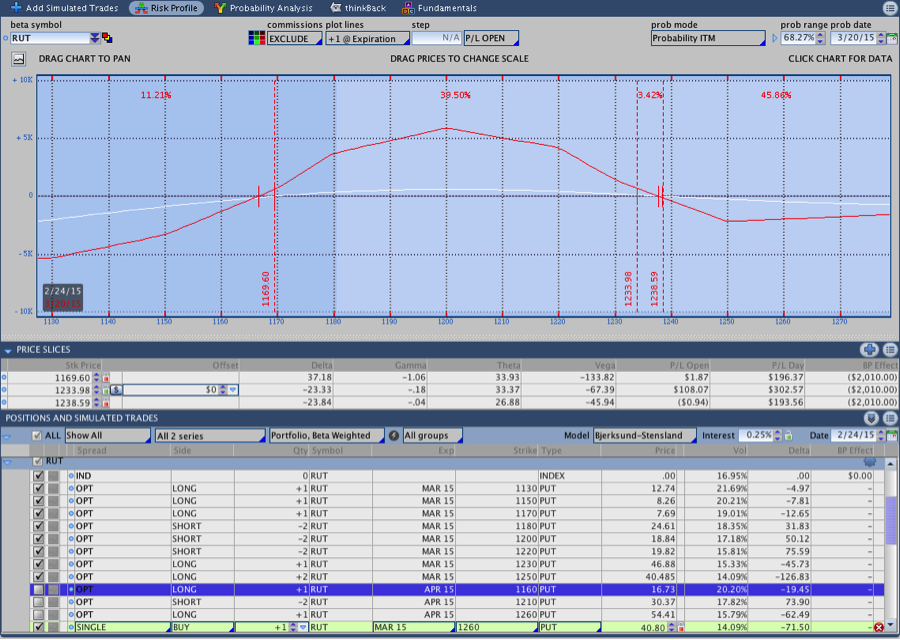
The image below shows a CI Butterfly shortly after the trade was initiated. In this case, price began higher and traded into the center of the Butterfly. Notice that the trade has very little directional risk.
Risk and Position Comparison:
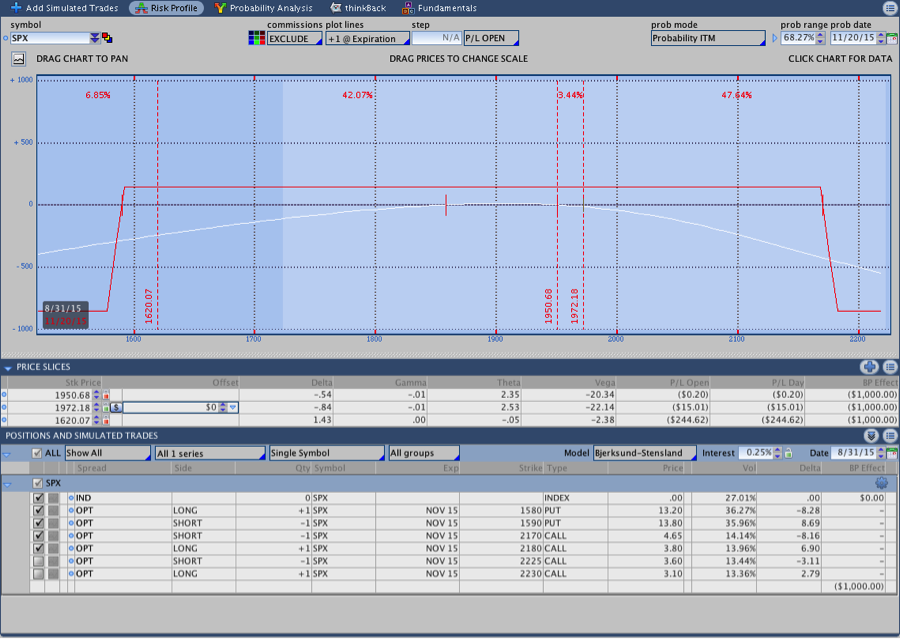
In the images below we’re looking at a typical Iron Condor in $SPX and the CI Butterfly. One of the big things to note is that the absolute dollar risk in the CIB is slightly greater than the Iron Condor. However, the potential profit is significantly greater.
One of the reasons I began trading Butterflies in general is that they have the potential to provide a much more favorable risk:reward ratio. Borrowing from what I learned as a trend following trader, I always look for ways to maximize winning trades. The CI Butterfly provides an opportunity to win many times the intended loss in the right market environment.
Iron Condor:
CI Butterfly Options Trade:
If you revisit the CI Butterfly shown above, you can see the initial risk is slightly over $1,000 with the potential to make close to $4,000. While we’re targeting a very small portion of the potential gain, a good market environment can make the trade much more profitable. The image below shows another CI Butterfly that is close to expiration.
CI Butterfly Trading Philosophy:
The rules provided here aren’t all inclusive, but they do give you a general idea of how the trade works. The trade begins with a 50 point wide $RUT Put Butterfly with a long $IWM call (you could also use an Iron Fly). I target an initial risk:reward of around 25-32% for the starting Butterfly. For example, a Butterfly that has 50 point wings and costs 11.00 has a risk:reward of 11/(50-11) = 11/39 = 28.2%.
The center of the Butterfly is positioned 10-20 points below the money, which gives the trade more room on the downside and a slightly bearish bias. Due to the slight bias, I make an effort to time my entry. Timing the trade perfectly will not make or break the trade, but it can make adjusting the trade easier.
Initiate the position 40-50 days to expiration. I was originally trading the strategy with 50-60 days to expiration, but found that I was frequently spending the first 10 days losing money. As a result, I moved the entry window back and generally enter 45-50 days out.
If you’re looking to time your entry more dynamically, initiating the trade earlier tends to work better when both implied and realized volatility are lower.
If the market trades lower, the Butterfly and long call are closed and rolled lower. On the upside, I add to the position up to two times before rolling up the lowest Butterfly. The philosophy behind the trade is that we stay smaller and more nimble when the market is moving down and willing to take on a little more risk on the upside. Since the trade is designed to stay below the money, a pull back generally helps the position.
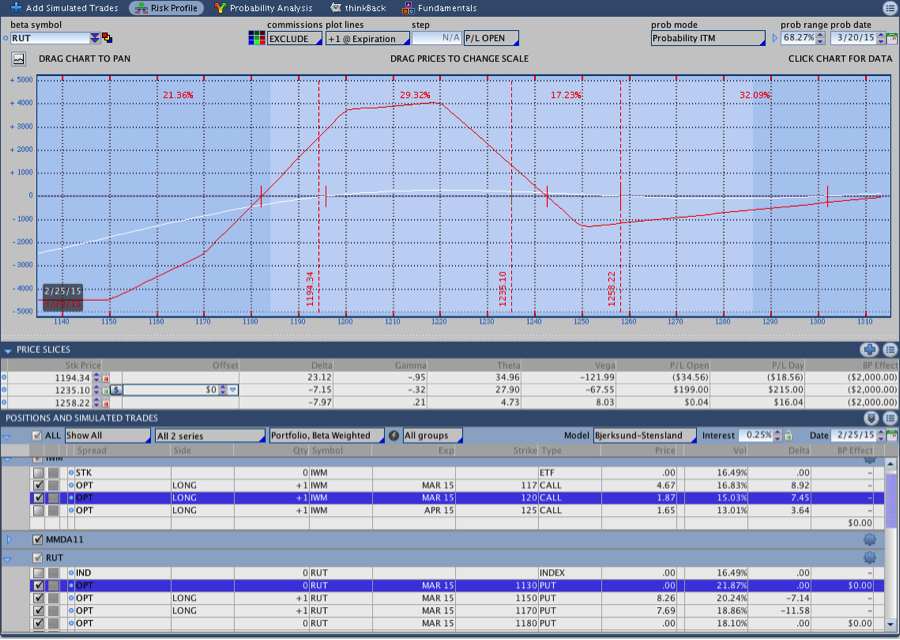
The image below shows a CI Butterfly trade after two upside adjustments:
A more conservative way to trade the position is to add only once on the upside and then roll. By only adding to the position once, you reduce the dollars at risk and keep the greeks smaller overall.
The absolute max loss I’m willing to take on a CI Butterfly is around $300, which is similar to my target gain. Like most higher probability options trades, the trade wins most of the time so a 1:1 risk:reward ratio keeps the trade profitable.
It’s also worth noting that a $250-$300 gain/loss on a $10,000 account represents 3% of capital, which is the target return for the trade.
Click here to check out the Premium Course that covers the CIB Trade in Detail
Sample Trades:
I’ll be posting a recap of the October Butterfly once we’re through the cycle because the strategy has evolved over the past year. The links below are some examples of previous trades, but keep in mind that my butterfly adjustment rules have changed slightly.
March 2015 Butterfly Partial Close
RUT Options Butterfly Trade Adjustment
RUT Options Butterfly Adjustment (Video)
We’re barely scratching the surface here and I’ll be posting additional information about the CI Butterfly options trade going forward. Let me know what questions you have in the comments below or via email. Your feedback allows me to make the discussion both more relevant and helpful for you!
Stay up to date on new options strategies & get a copy of the Original Theta Trend Trading System. Click here.

Sign up for my email list and stay up to date with the latest information on options trading.
Click here to sign up for the list, get a copy of the Original Theta Trend Options Trading System, the Trade Tacker I use, and information about new systems.
Even better . . . it’s all totally free.
Hi Dan!
Thanks for the post; its really interesting. I’ve some doubts.
What are your adjustment points?
How many CIB did you close with losses?
Do you have any other exit rule besides max loss?
Thanks!
Hi David and thanks for the comment,
Having doubts is good; read the post below. The results might surprise you:
http://www.thetatrend.com/range-profit-things-wings-rut-iron-condors-butterflies/
On to your questions . . .
The general idea is that I adjust when price trades outside of the expiration break even point on the upside. That being said, I allow myself a little leeway and I do make decisions based on what I think might happen in the market.
Yesterday morning is an interesting example. Price traded up to 1170 (my adjustment point) and began to fade. As price came off, the adjustment Butterfly I wanted to add became increasingly expensive (remember, they’re bearish) so I never got filled and didn’t adjust. If RUT heads back up then I’ll make the adjustment.
On the downside, I adjust before it exits the expiration break even and simply roll the position lower. In other words, I’m more aggressive in timing adjustments on the downside and want to keep positions small if we’re going down.
In addition to the basic adjustments above, I sometimes make adjustments based on the greeks as the trade approaches expiration. Specifically, I’ll sometimes roll up short puts by either 5 or 10 RUT points to flatten delta and cut down negative gamma.
In the past year (14 months really) I’ve traded the strategy in almost every expiration cycle (I missed one or two due to moving). The trade has not lost yet, but I’m sure it will at some point. The October expiration has been challenging, but the trade is still healthy and starting to show a profit. If I had initiated the October trade one day earlier, I might have taken the max loss. It was, however, initiated the Friday before “Black Monday.”
Max loss is my primary exit rule. I’m also willing to pull off the trade if I show a 15% profit within 2 weeks of initiation. That rule cuts market exposure and reduces the profit potential, but a 15% return in two weeks on capital at risk is good in my mind. Another option would be to take off half rather than the full position.
Let me know if that raises any new questions.
-Dan
Hi Dan
Great thread. In percentage terms, Typically how much of your portfolio is capital at risk?
Thanks
/Claes
Many gifts for last time, Dan! 🙂
Glad you liked it!
Hi Dan
Great article. Typically how much of a portfolio do you put into one CBI? Also – what is your profit target and stop loss levels? Do these vary with time (as John Lockes M3 trade)?
Thanks for a great site
Claes
Hi Claes and thanks for the comment.
I consider $10,000 the base unit of risk for one CIB, but that’s for risk sizing purposes rather than because I put that amount of capital into a trade. The trade can use up to roughly $5,000 of capital once it’s full size after starting with $1200-1400 when it’s opened.
I am a conservative trader and like to keep risk under control at all times. I target a maximum loss and gain of $300 (a 1:1 risk:reward) per position, which is 3% of capital. I’m working on controlling the Greeks as the trade approaches expiration with the intention of bringing in more money on the position, but for now I operate with the $300 target.
I employ an optional early exit rule, which is the only real variation on profit taking. Specifically, I am willing to close the position within 2 weeks of opening if the trade is up $150-$200. That gain represents around a 15% return on the position and around 1.5% on allocated capital. Another option would be to scale out of half of the trade if multiple positions were being traded.
I’ve seen some information on John Locke’s M3, but I can’t say that I’m familiar enough with his strategy to comment on his exits. I maintain the same profit and loss targets over the course of the trade with the exception of the early exit rule. From a practical standpoint, if a trade is up say $200ish per position that profit should be protected by controlling the Greeks and directional risk rather than letting the trade reverse and hit max loss.
Hope that helps and let me know if it raises any new questions. Thanks!
Hi Dan!
Thanks for your explanation! Regarding the greeks. Do you add Flys on the upside based on the greeks (i.e. when for instance delta/theta, delta/vega or vega/theta ratio reach a certain point) or do you have specific points in underlying @ where you add to position? Also, when managing the trade by the greeks closer to expiry, do you have certain ratios you want to keep your trade close to (ex. 10% delta/theta etc).
Thanks!
Claes
Hi Claes,
Sure, glad it helped. I only add Butterflies to the trade when price trades beyond the expiration break even on the upside. Even then, I give the market a little wiggle room (maybe 5 or so extra points). I use the Greeks to assess the position, but I don’t necessarily look for a specific ratio. Rather, I try to keep the trade slightly short delta with as little gamma as possible while remaining positive theta and negative vega. If price remains within the body of the Butterfly the Greeks are usually fine. The exception is when the trade sits untouched for a while and then the market moves higher.
If the trade sits for a while the long call (OTM) begins to decay and the T+Zero line will start to dive within the body of the Butterfly. In those cases, I roll up a long put to flatten out the T+Zero line. The obvious danger is that price will trade lower shortly after making that adjustment. I consider that adjustment important if short Delta becomes < -5 for one Butterfly (initial position), < -8 for 2 Butterflies (after adding once), or <-13 for 3 Butterflies (after adding twice).
Something else to point out is that I don't use hard and fast rules. I'm watching the trade, the Greeks, the T+Zero line, and asking myself if the trade has the potential to get into trouble. How, you ask? I usually consider my directional opinion on the market (which is frequently wrong) and what a 1 day 1 standard deviation move would do to the position. If a 1SD move would cause a major problem, I'll be looking for an adjustment to mitigate that risk.
Hope that helps and thanks again!
-Dan
Hi Dan
Thanks for your explanation.
/Claes
Sure thing Claes. Feel free to get in touch anytime.
I also trade butterflies (John Locke’s Bearish Butterfly and M3). I have written a tool to determine a “fair” mid price (looking at calls and puts and the Iron Butterfly). But it needs Interactive Brokers. So it might not be useful for you (because you use Think or Swim), but maybe some readers will find it useful: http://www.bbpricer.com/
Hi Uwe and thanks for sharing your tool! I have IB as well, but I don’t use that account for options trading. I’ll need to see if I have a data subscription that allows it to work. Sounds like a good weekend project . . .
Yes, it tries to subscribe to RUT (which needs extra market data). Options market data was included in the big bundle in the past, but IB changed it. Now it costs a little bit, but is waived if you trade a little bit.
But you would not need the underlying market data – please let me know, if the program misbehaves in this case.
Gotcha, that makes sense. I’m considering moving my options trading to IB anyway so it might not be an issue for long. Thanks again.
hi Dan,
thanks for sharing your insight
why do you use IWM as hedge instead of RUT?
i wonder if i can use this with bullish bias?
butterfly with positive delta and put hedge
i will try it on paper
Hey aw,
Sure thing. I use IWM because I’m looking for a 1:10 ratio and 1 RUT call to 1 RUT Butterfly would be way too much delta for a single Butterfly.
Dan
What is the benefit of this trade over a broken wing butterfly with the upper leg that is locking in profit from the outset? I saw this as a variation on The Road Trip Trade. I haven’t compared the greeks, or width of the spread, on the two trades, but the BWB seems like it may be a little easier to manage, as the upside doesn’t need a hedge. I would love to hear your thoughts, as I’m sure you’ve compared the CIB strategy to many others. Thanks.
Hi Brandon,
Thanks for the comment. You’re correct that I’m always, always comparing different trade structures. A RT trade with an upper leg above the T+Zero line is structurally a different trade. They’re both butterflies, but they’re very different. On the upside, you’re correct that the RT will require less management. It will, however, take more heat on a down move. The other major difference is that the yield on BWB’s opened for a small debit (or even a credit) tends to be lower. I think they both have their place for different reasons and/or depending on your personal preferences.
As an aside, I’ve also started trading some BWB trades that are different than the RT, but have a higher yield. They’re sort of the middle ground between trades like this and the RT. More to come on that . . .
For a little more info on various butterfly trades, you might check out this post:
http://www.thetatrend.com/the-shocking-range-of-profit-on-butterflies-broken-wing-butterfly-options-trades/
Hope that helps!
Dan
Hi Dan, thanks for this great article and strategy. I was wondering if one can use this strategy, or maybe some variation of it, to generate weekly income, instead of waiting to be profitable 3-4 weeks out?
Thanks
MS
Hi MS,
My preference has always been to stay a little further out in time because positions move slower and have more adjustment options. Consequently, I haven’t looked into trading it on a shorter term timeframe. I know of one person who planned to trade a variation of the strategy on a weekly timeframe, but I don’t know much about it other than that. My concern is always that it’s hard to control the T+Zero line as you get closer and the trade is more likely to get hurt on a significant move.
Dan