Weekend Market Commentary 9/11/15 – $RUT, $RVX, $SPX, $VIX, $VXV
Big Picture:
Did anyone else like how I called that bottom last week?! Right after I said I was bearish we had a nice roughly 2% higher week. Sometimes I’m just wrong. This is one of those times.
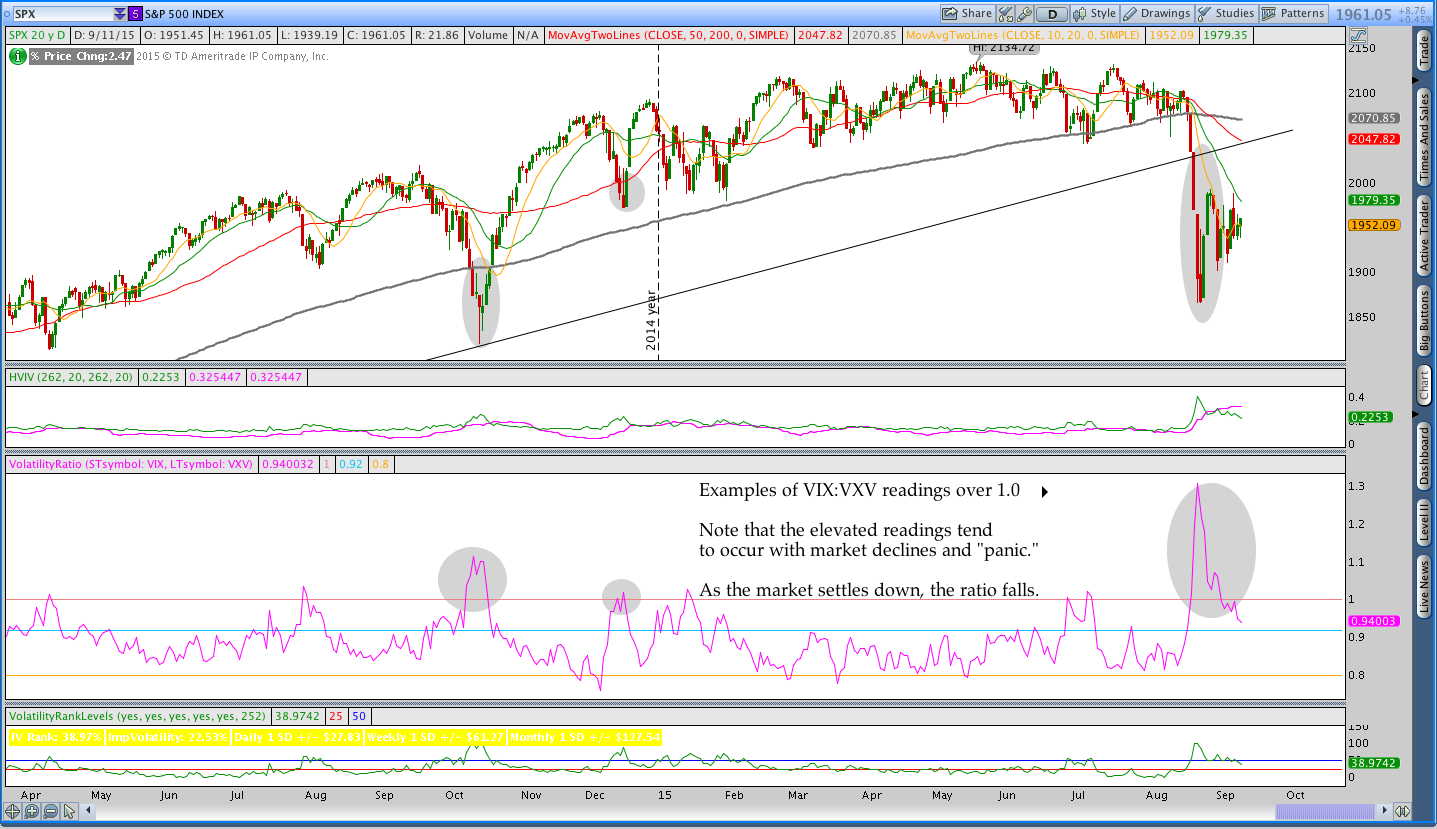
I want to talk about a ratio that I’ve started following. That ratio is the VIX/VXV ratio, which roughly represents 30 day to 3 month volatility in S&P 500 options. Mathematically we’re talking about a simple relationship: VIX / VXV. When the numerator increases more than the denominator, the ratio increases. If the numerator becomes larger than the denominator, the ratio becomes greater than one.
When the market is calm or in an uptrend, front month volatility ($VIX) tends to trade at a discount to 3 month volatility ($VXV). As a result, the ratio is usually less than 1.0 and is frequently less than 0.92. We all know (I hope) that implied volatility tends to increase when the market gets a little rocky or declines. However, volatility doesn’t rise equally across all months and front month IV (VIX) tends to rise more than longer dated, back month implied volatility (VXV).
In terms of the VIX/VXV ratio, readings above .92 coincide with turmoil in the market and readings above 1.0 take place when things get to a panic. For example, the ratio was 1.31 a couple of weeks ago when the market fell, but it settled down to around .94 at the close on Friday. The chart below illustrates the ratio.
So what does the ratio suggest about where the market is heading? Unfortunately, we don’t really know. Data is historical, not forward looking. We’re the ones who manipulate data with the objective of looking forward, but we don’t really know what will happen.
We do know that implied volatility is suggesting that we’re not in panic mode anymore, but we’re not back to “normal” either.
The media is telling us that this will be a big week with the Fed making an interest rate announcement. That event has the potential to move the market.
Will there be follow through? Will the market go higher or lower? What does it mean a week from now, two weeks from now, etc?
All we can do is quantify what has happened in the market and know when the potential for change exists. This week we have the potential for change, but we don’t know what that change might be or if it will even take place. We’ll just have to wait and see.
Market Stats:
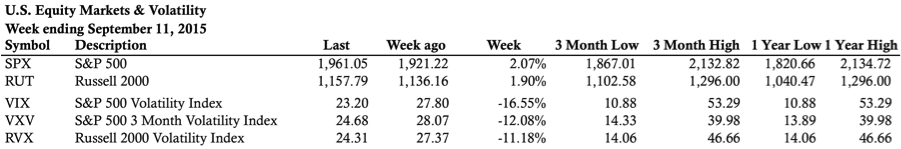
Levels of Interest:
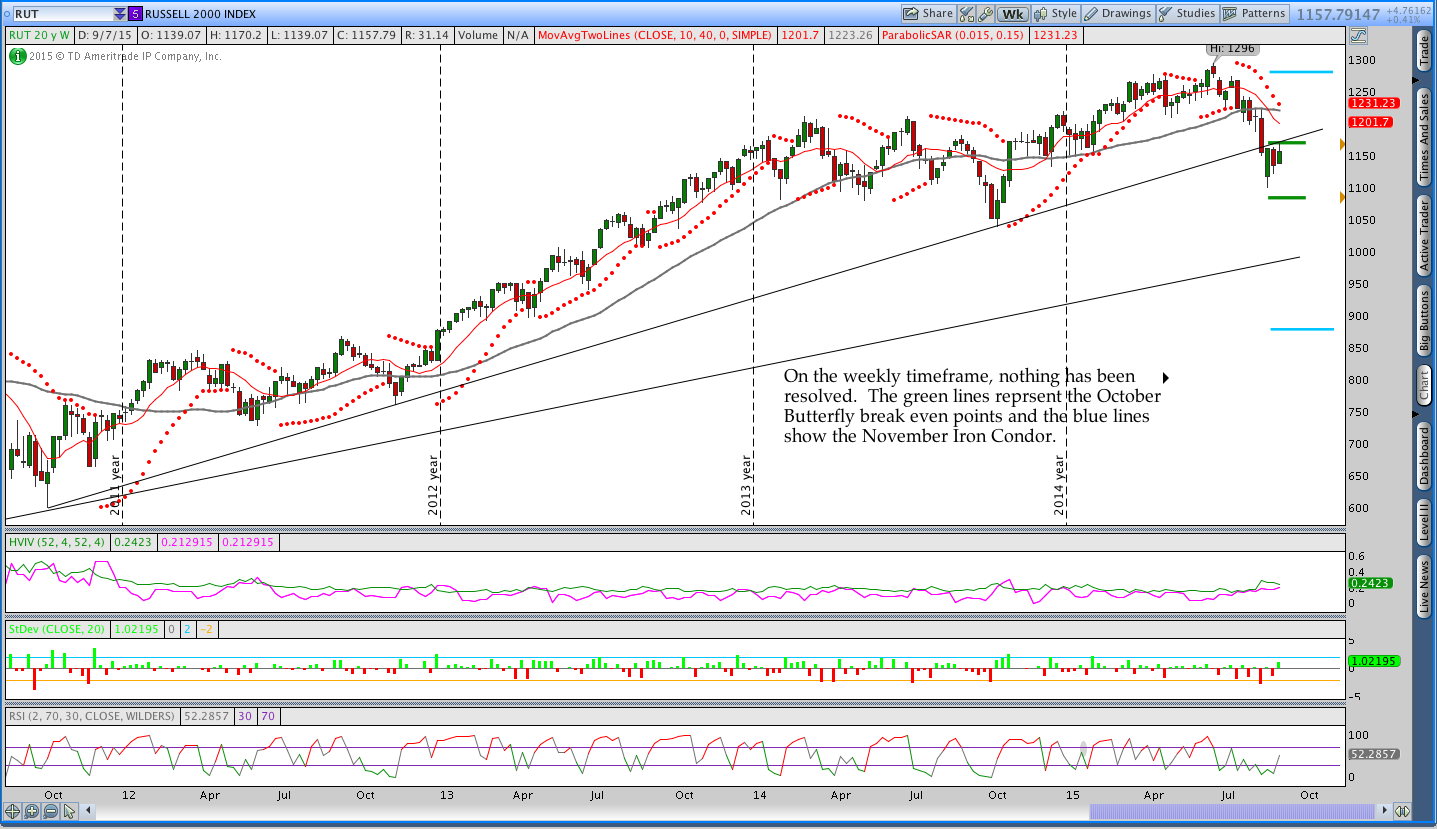
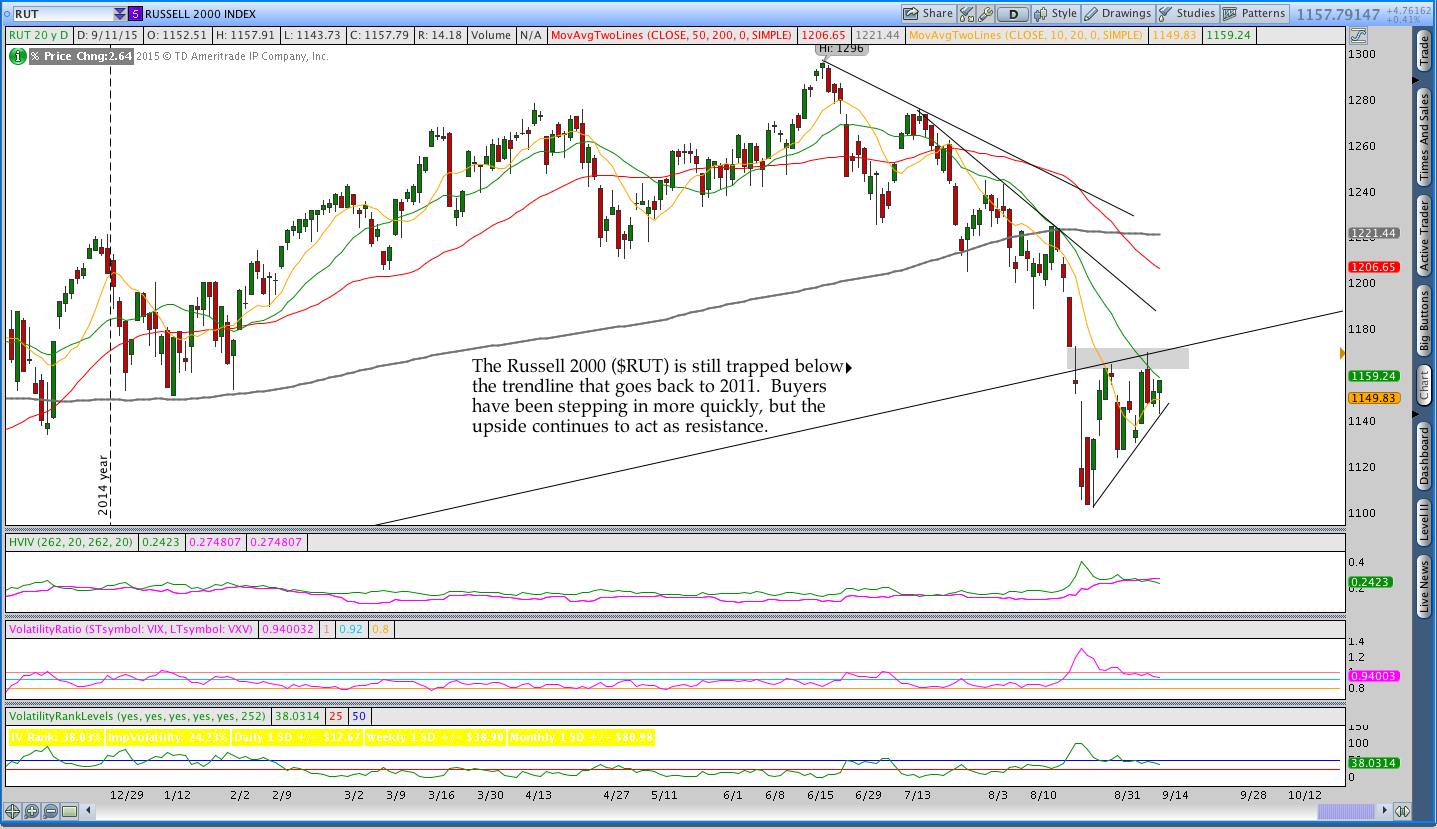
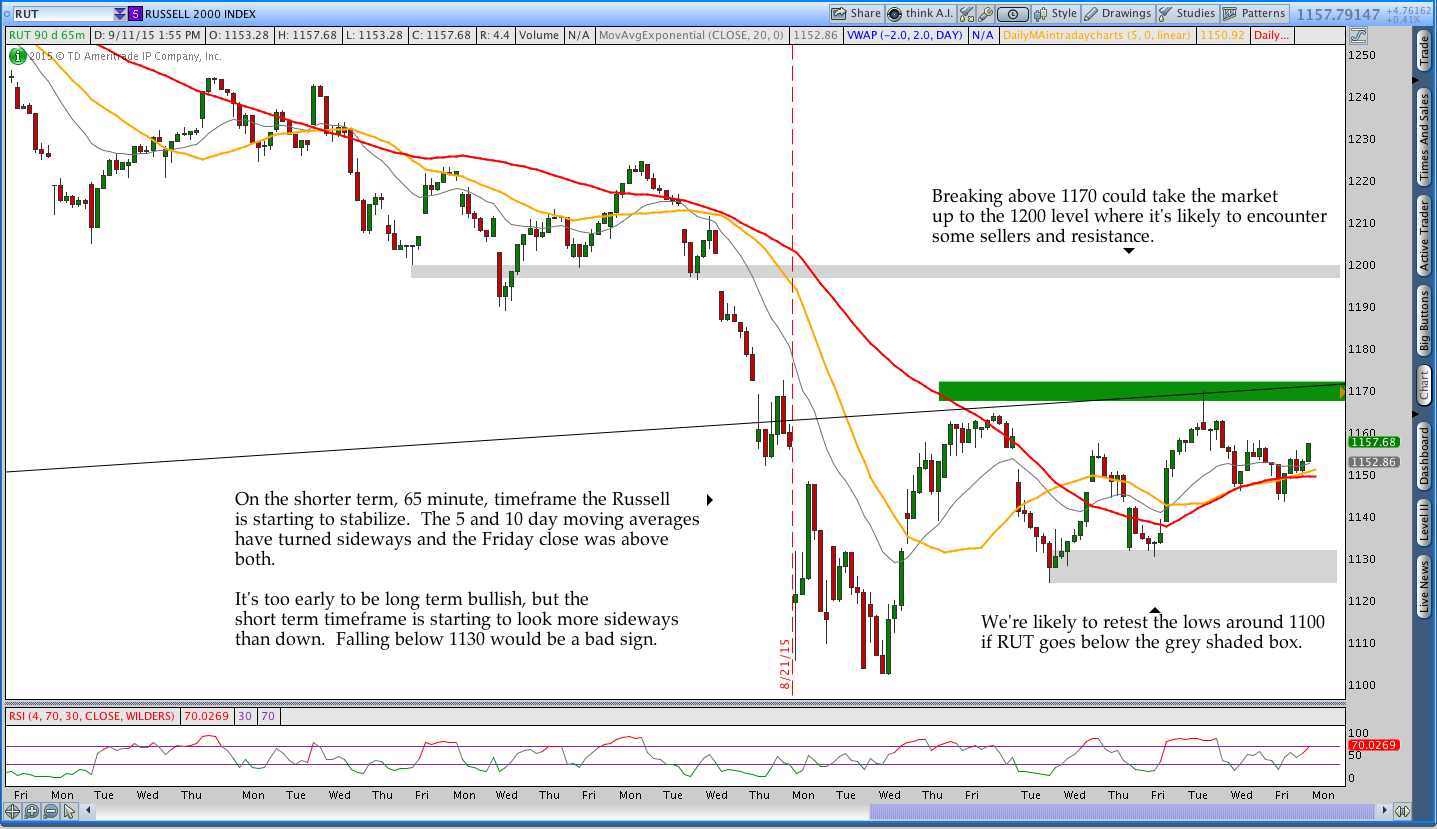
In the levels of interest section, we’re drilling down through some timeframes to see what’s happening in the markets. The analysis begins on a weekly chart, moves to a daily chart, and finishes with the intraday, 65 minute chart of the Russell 2000 ($RUT). Multiple timeframes from a high level create context for what’s happening in the market.
Volatility:
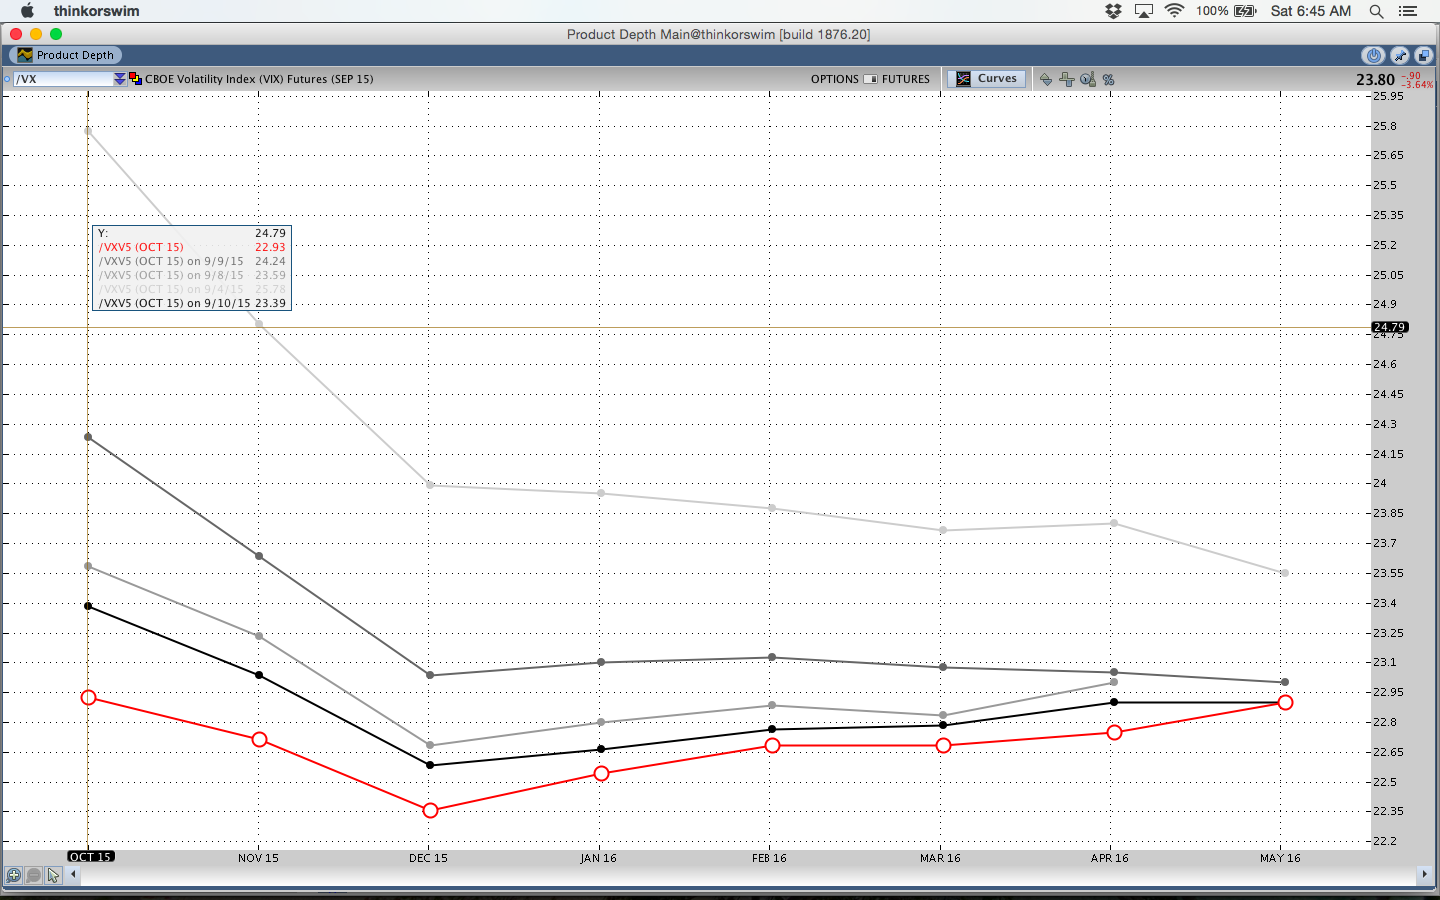
In a calm market, the front month VIX Futures contract generally trades at a lower price than the subsequent months (Contango). Right now the term structure is still in Backwardation (Friday is the red line), but the curve flattened out and shifted down this week. All isn’t rosy just yet, but things aren’t as ugly as they were last week either.
Live Trades . . .
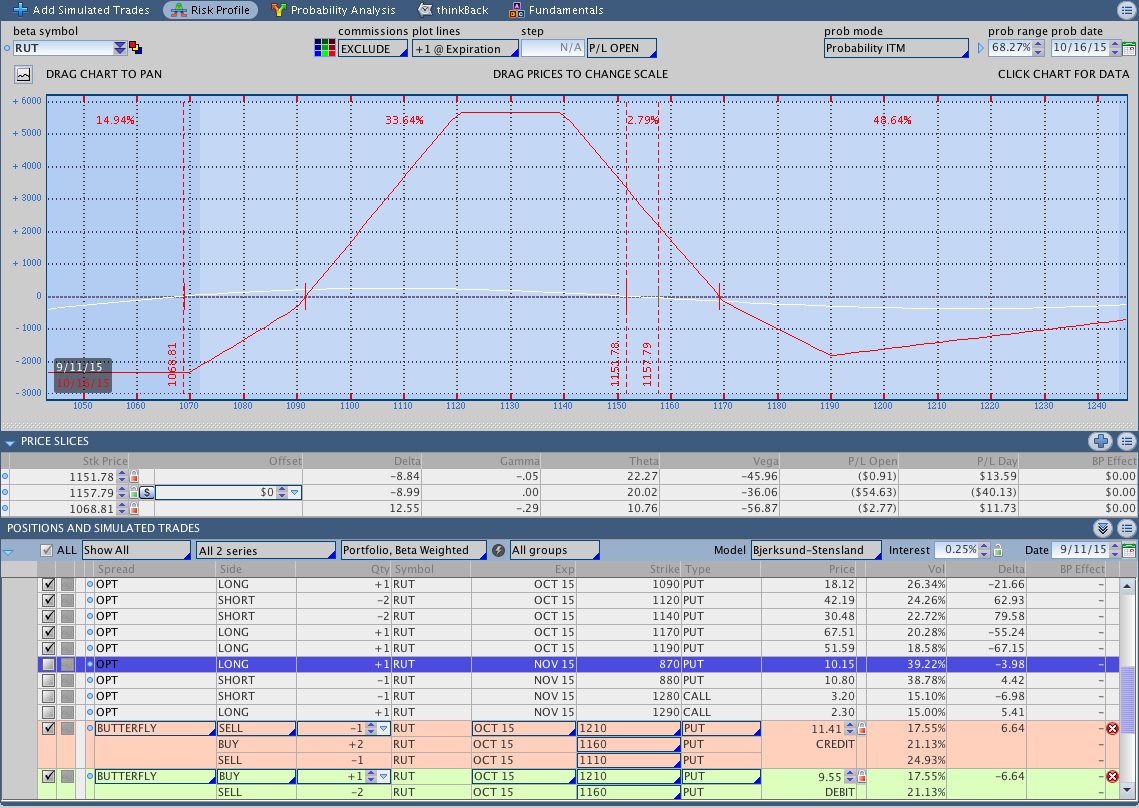
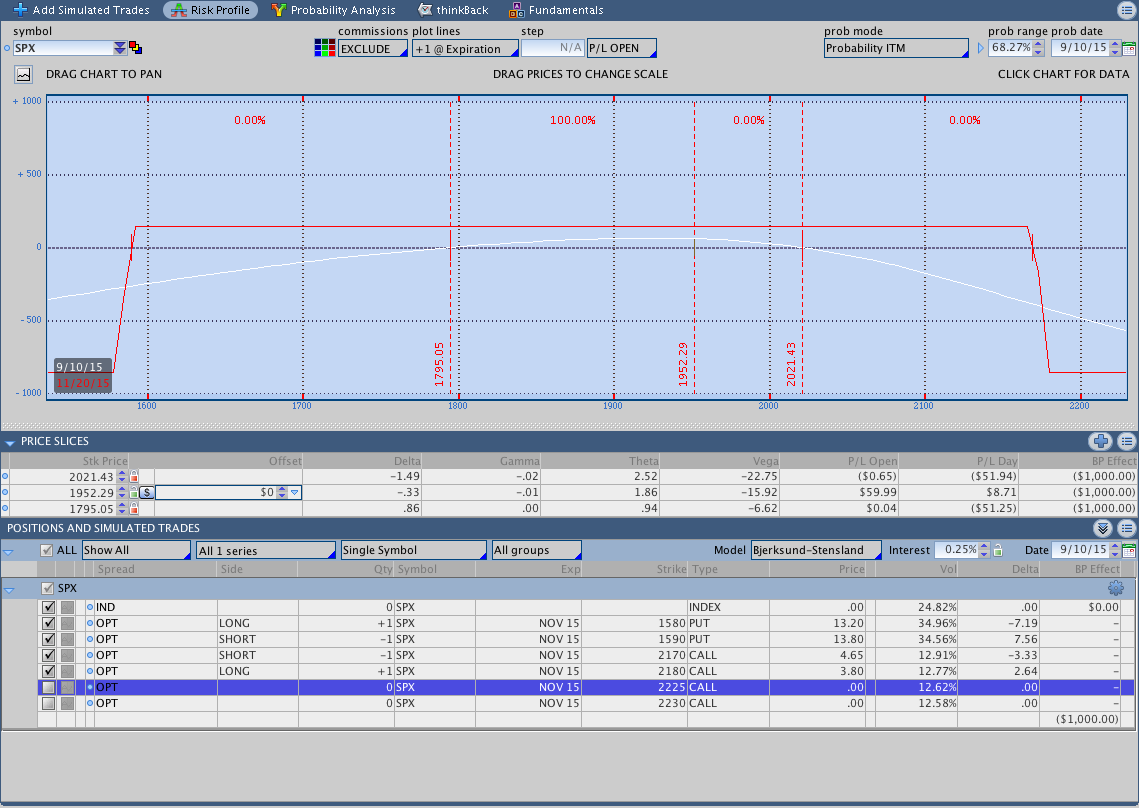
The “Live Trades” section of the commentary focuses on actual trades that are in the Theta Trend account. The positions are provided for educational purposes only.
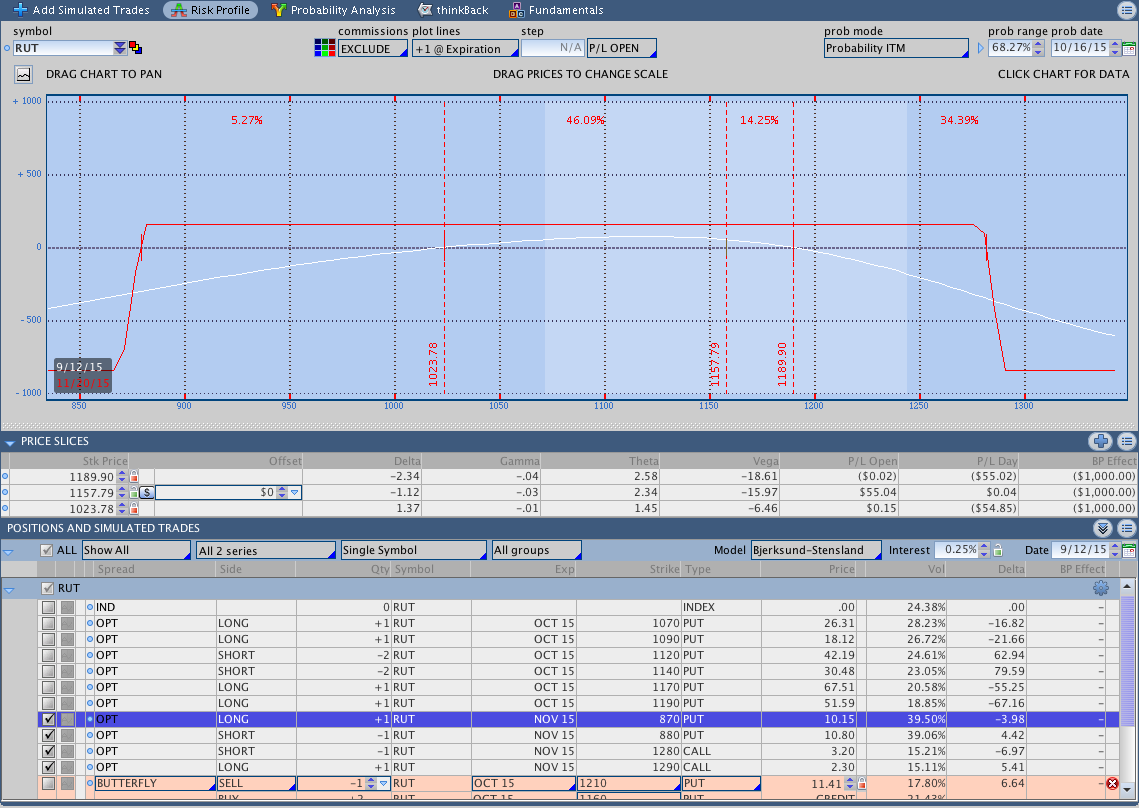
This was a relatively quiet trading week. I sold a November $RUT call spread to complete a November Iron Condor and closed a November $SPX call spread for a nickel to free up some margin. The Russell pushed up to my adjustment point for the October Butterfly, but I didn’t have a chance to make the adjustment before price fell away from that level (around 1170).
If we see the market move higher this week, I’ll need to adjust the October Butterfly on the upside. For now everything is sitting around looking relatively okay.
Looking ahead, etc.:
Every week the market gives us new information and we adjust. This week the market told us things aren’t as scary as they were a week ago, but that doesn’t mean things can’t or won’t change. If we want to trade tomorrow, we need to assess the risk in our positions and have a plan to control the risk when things go wrong.
What we know is that the market has the potential for a big move this week. We don’t know what direction the market will go and we don’t know if a big move will happen at all. All we can do is trade the plan and be aware of when a change might take place.
Please share this post if you enjoyed it.
Click here to follow me on Twitter.
Want to receive an alert as soon as the next market commentary is posted?

Sign up for my email list and stay up to date with the latest information on options trading.
Click here to sign up for the list, get a copy of the Theta Trend Options Trading System, the Trade Tacker I use, and information about new systems.
Even better . . . it’s all totally free.