The Shocking Range Of Profit On Butterflies – Analysis Of Broken Wing Butterfly Options Trades
As income traders we’re always evaluating strategies and ways to trade that increase profitability, reduce risk, or are just easier. This post looks at some of the characteristics of Broken Wing Butterflies and how they can be used to construct positions with little directional risk and a potentially wide range of payoff.
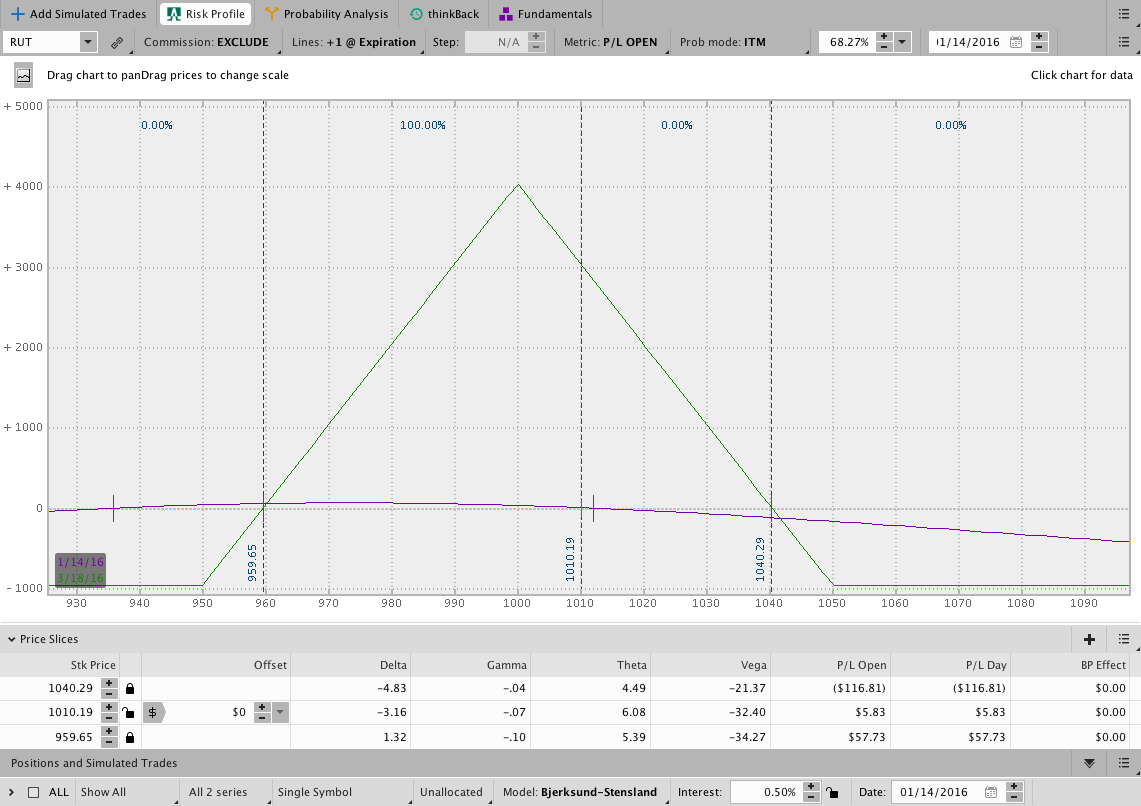
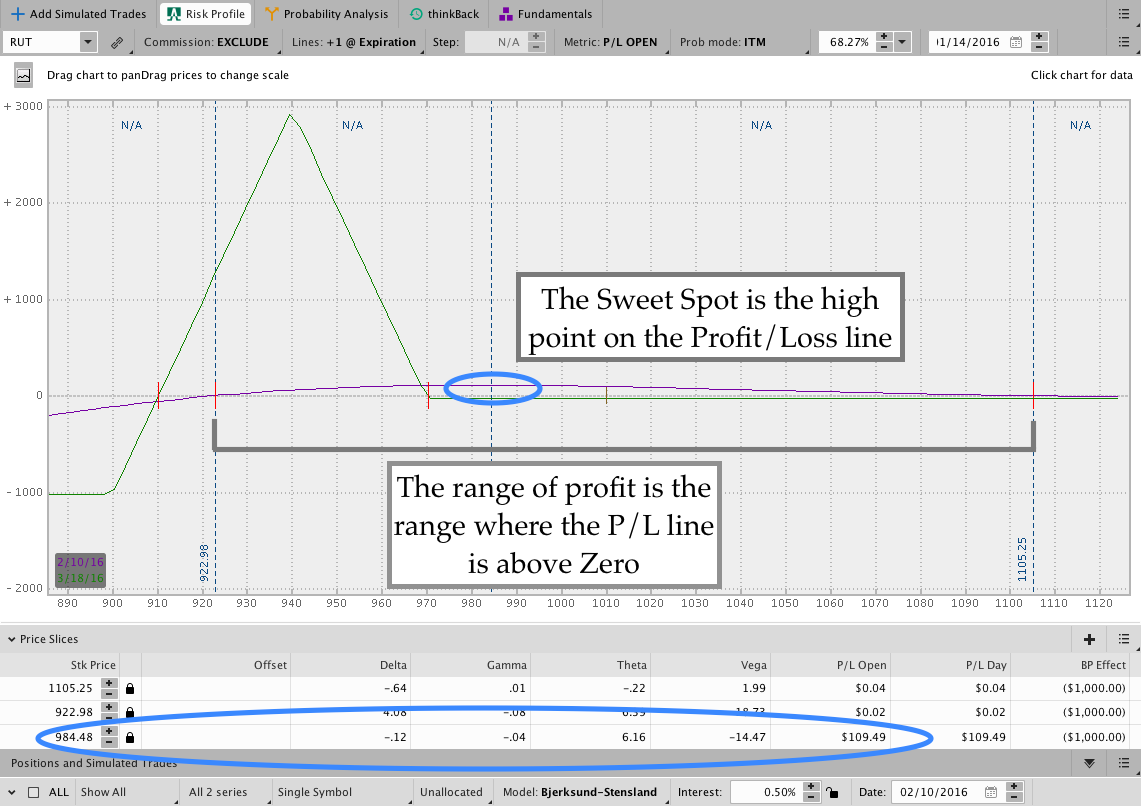
Normally when we think about trading Butterflies, we imagine a position that looks like this:
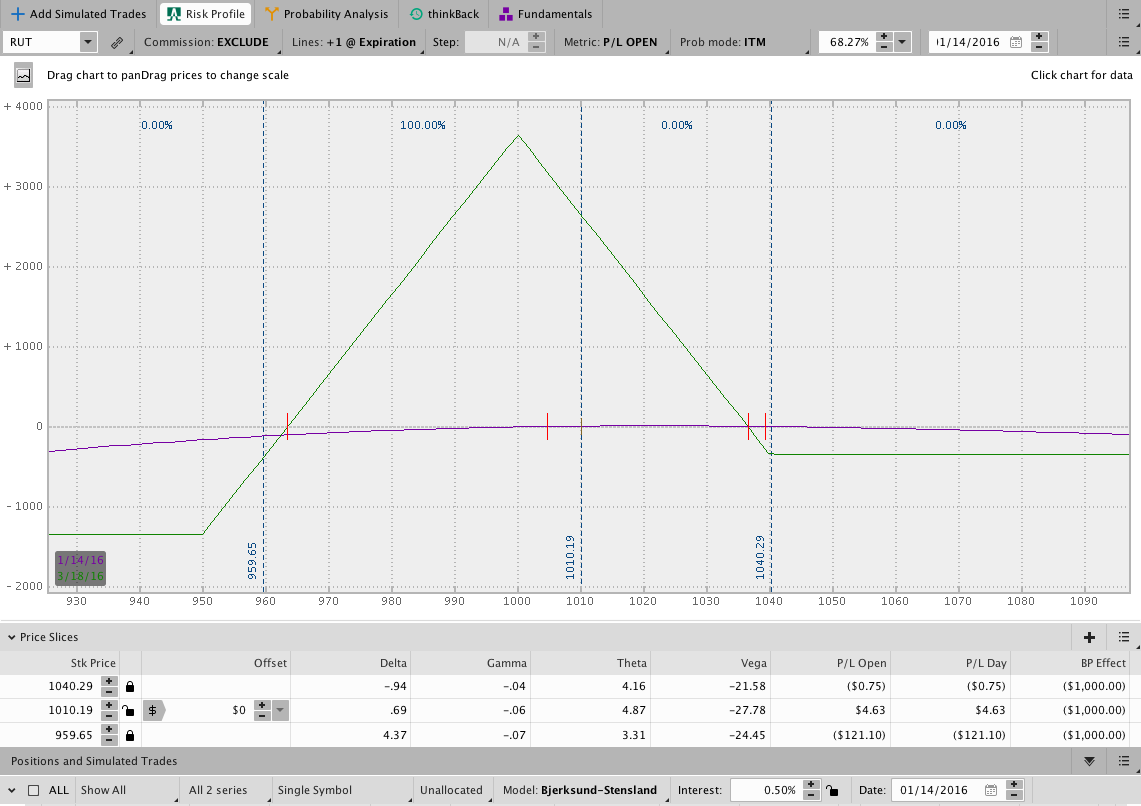
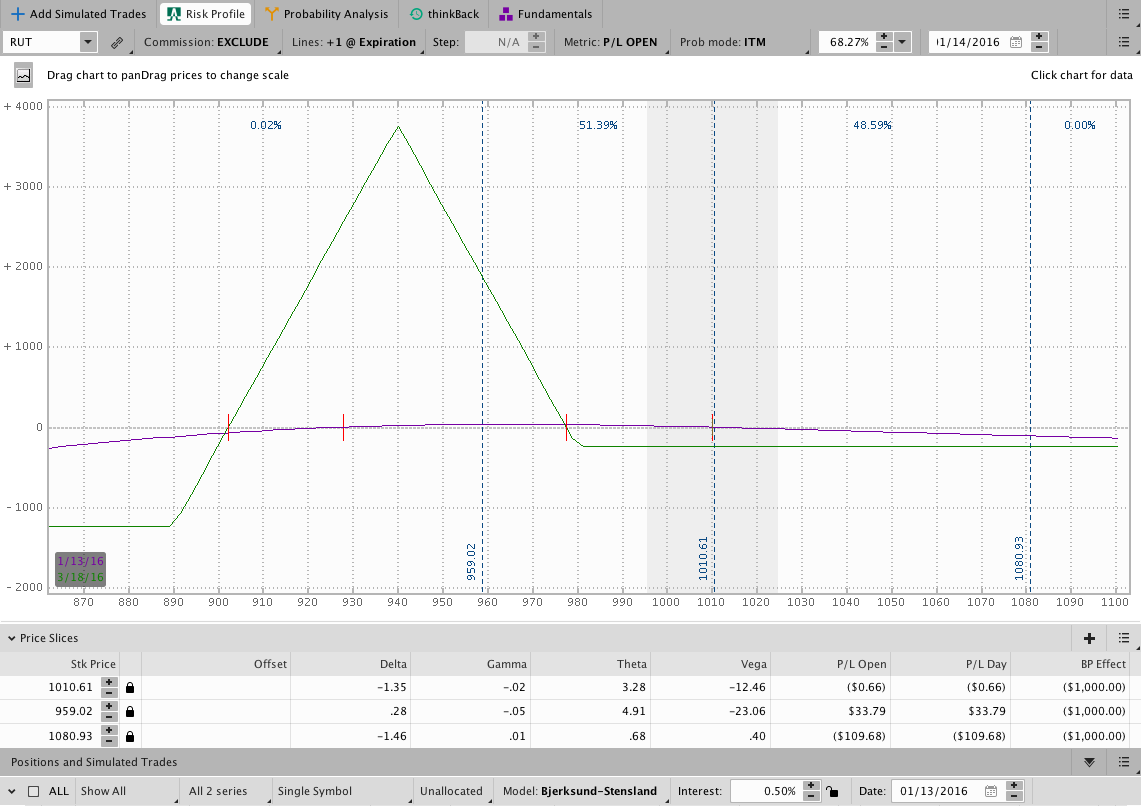
However, that’s only one way to construct a Butterfly trade. The trade could also be entered as a Broken Wing Butterfly and look like this:
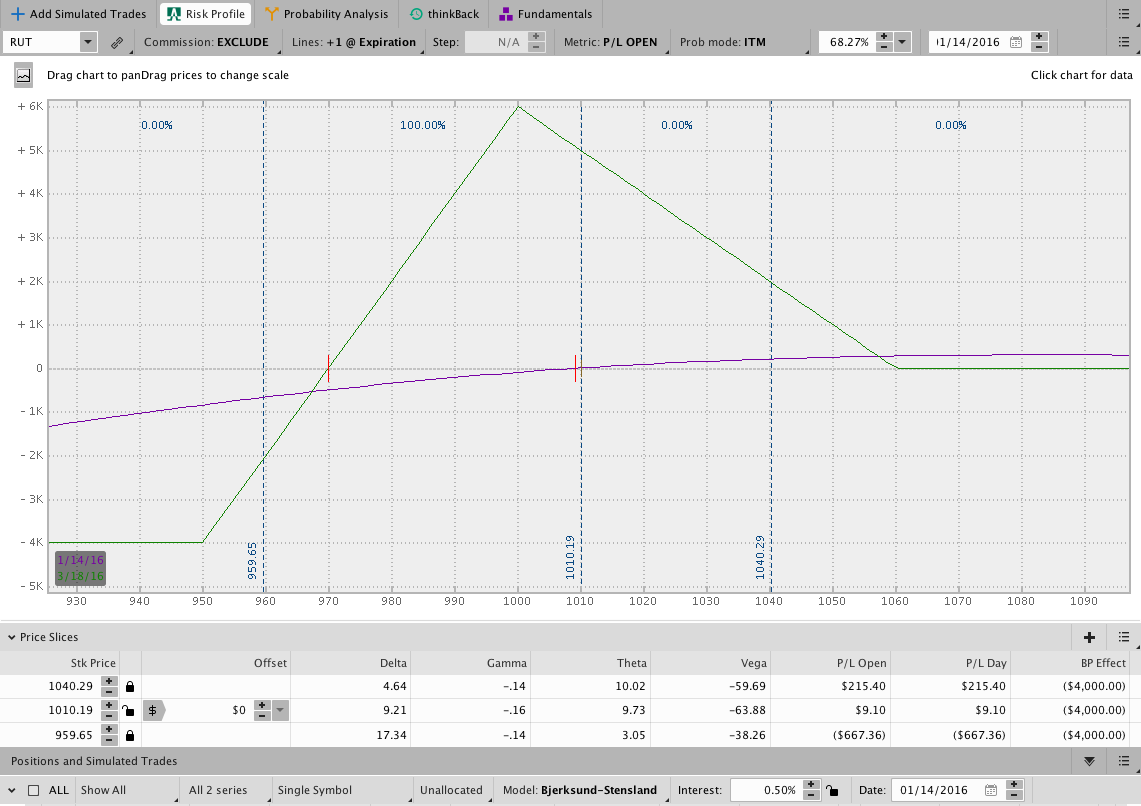
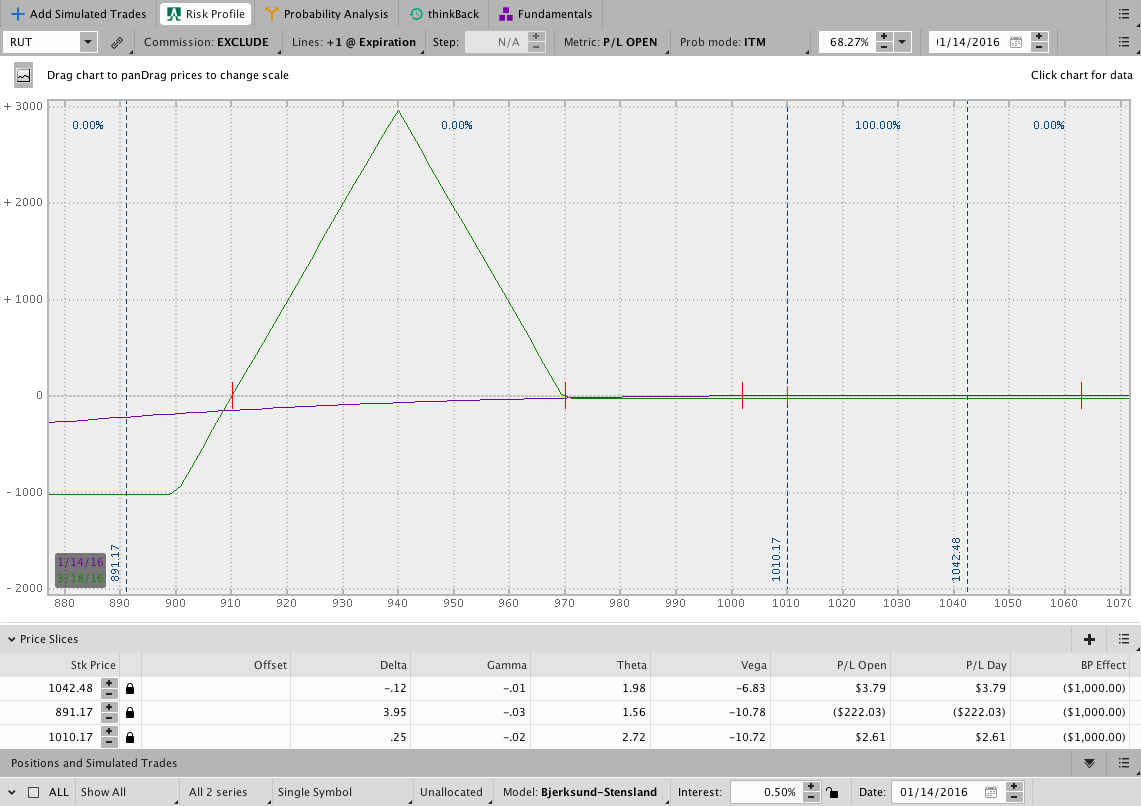
Or an unbalanced Butterfly, which looks similar to the BWB above:
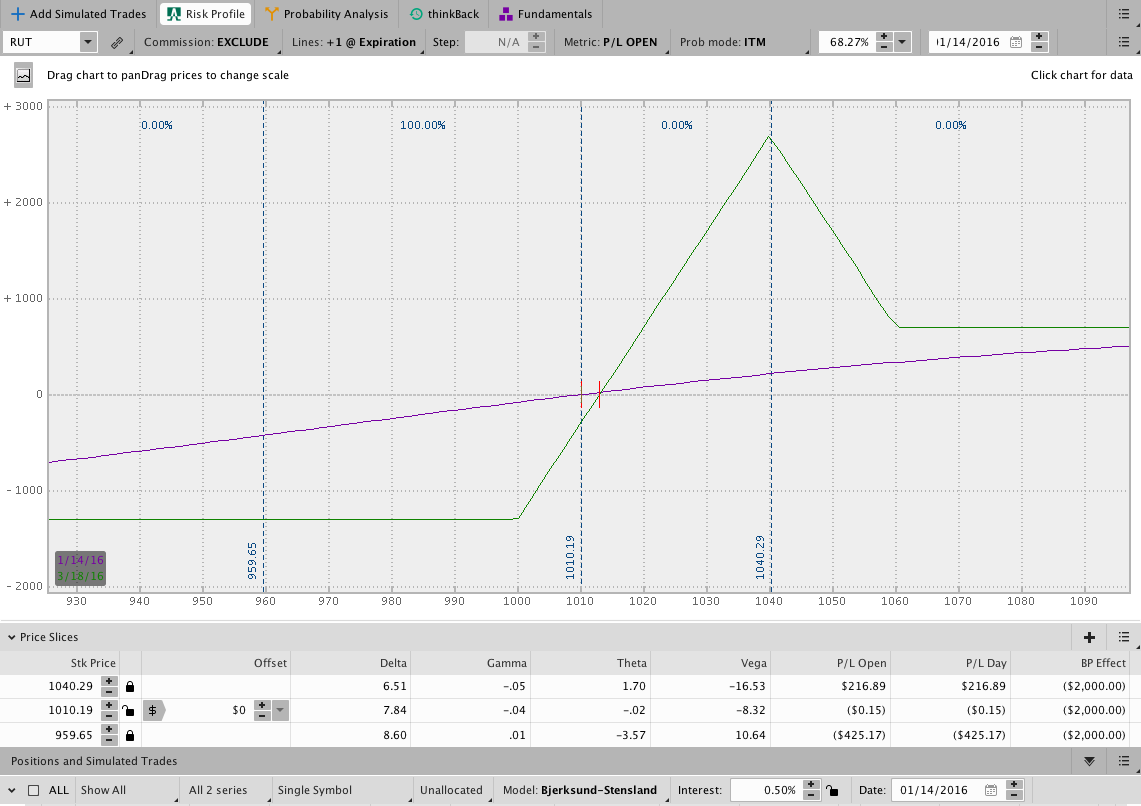
And we can also create a directional BWB:
The important thing to recognize is that every position above has trade-offs and no one position is “best.” The “right” trade depends on what you want to accomplish.
Frankly, one of the most challenging things in constructing a position is answering that question . . . What do you want to accomplish?
So you just want a T+Zero line that’s always positive, right? Yeah, we all do.
Suppose your goal is to make money over a wide range of prices while taking on limited amount of directional risk. Also, since we’re already on the subject, let’s assume you want to use a Butterfly or a Broken Wing Butterfly to achieve that goal. Great, we have a plan.
A while back we discussed the range of profit for Iron Condors and Butterflies. This post limits and expands the Butterfly portion of that analysis. Specifically, we want to look at the range of profit for different Butterfly configurations starting at different locations and with different strikes. In other words, we want to know how wide the profit zone for the Butterfly should be, what the maximum profit is at the sweet spot on the T+Zero line, and the location of the sweet spot.
We’re going to consider the following trades:
Trade #1 – A standard Balanced Butterfly positioned 10 points below the money (the top image shown above and duplicated below)
Trade #2 – A 50 x 40 BWB positioned 10 points below the money (the second image above and duplicated below)
Trade #3 – An Out of the Money 50 x 40 BWB with the short strikes positioned at 25 delta
Trade #4 – A “cheap” Out of the Money BWB with short strikes positioned at 25 Delta
What do you expect?
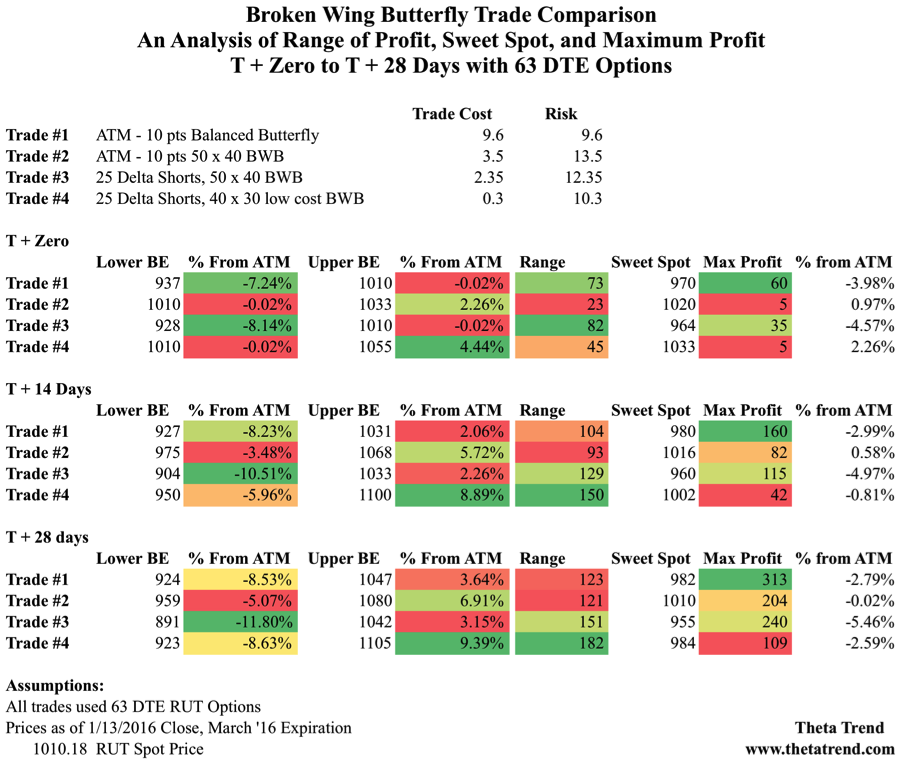
This is where it gets interesting. In the table below, we’re looking at the range of profit for the various Butterfly configurations shown above. The trade table compares the range of profit for the different starting structures, the sweet spot, and the potential profit at the sweet spot. We’re also comparing the initial cost to enter the trade and the maximum risk on each position. Note that the risk is somewhat similar regardless of the starting structure.
What does it all mean?
While it’s great to look at the numbers and data, it’s important to understand the implications of the positions. In general we see that a Butterfly positioned closer to the money has a higher potential profit (potential yield). Additionally, if the market moves down shortly after entry, that structure will handle the move the best.
When we take the ATM – 10 point Butterfly and break the upper wing, we get more room to run on the upside. The tradeoff is that we lose the downside cushion if the market moves lower.
When we move down to the 25 Delta area we end up with a wider range of profit and a good amount of room on the downside. The 50 x 40 version doesn’t have as much room on the upside, but it’s about the same as the standard ATM – 10 Butterfly.
The widest range in general comes from the “cheap” 25 Delta BWB. That position gives a sweeping range. The obvious tradeoff is that the potential profit is lower than the other starting structures.
At the end of the day, the trade structure you choose has more to do with where you think the market might go or not go. If you’re totally agnostic on market direction, you get the widest range with a “cheap” 25 Delta BWB.
What structure do you like the best and why? Let me know in the comments below . . .
Reader Note: This post expands the discussion from the post, “Range Of Profit On Things With Wings – A Look at $RUT Iron Condors and Butterflies.” Click here to read that analysis.
Don’t miss out. Want to receive an alert as soon as new content is posted?

Sign up for my email list and stay up to date with the latest information on options trading.
Click here to sign up for the list, get a copy of the Theta Trend Options Trading System, the Trade Tacker I use, and information about new systems.
Even better . . . it’s all totally free.