4 Volatility Indicators for Options Trading With ThinkOrSwim ThinkScript Code
A hammer isn’t the only thing you need to build a house, but it would be pretty hard to build a house without one.
Understanding volatility is an essential part of options trading and there are so many ways of describing it that it can feel overwhelming at times. Fortunately, visualizing some of the measures can make it easier to understand what’s happening with volatility.
This post gives you some less common indicators to visualize volatility. Each indicator comes with an explanation and the ThinkOrSwim ThinkScript. ThinkOrSwim users will be able to copy and paste the code into a custom study.
Feel free to share this post and the codes with a link back to ThetaTrend.
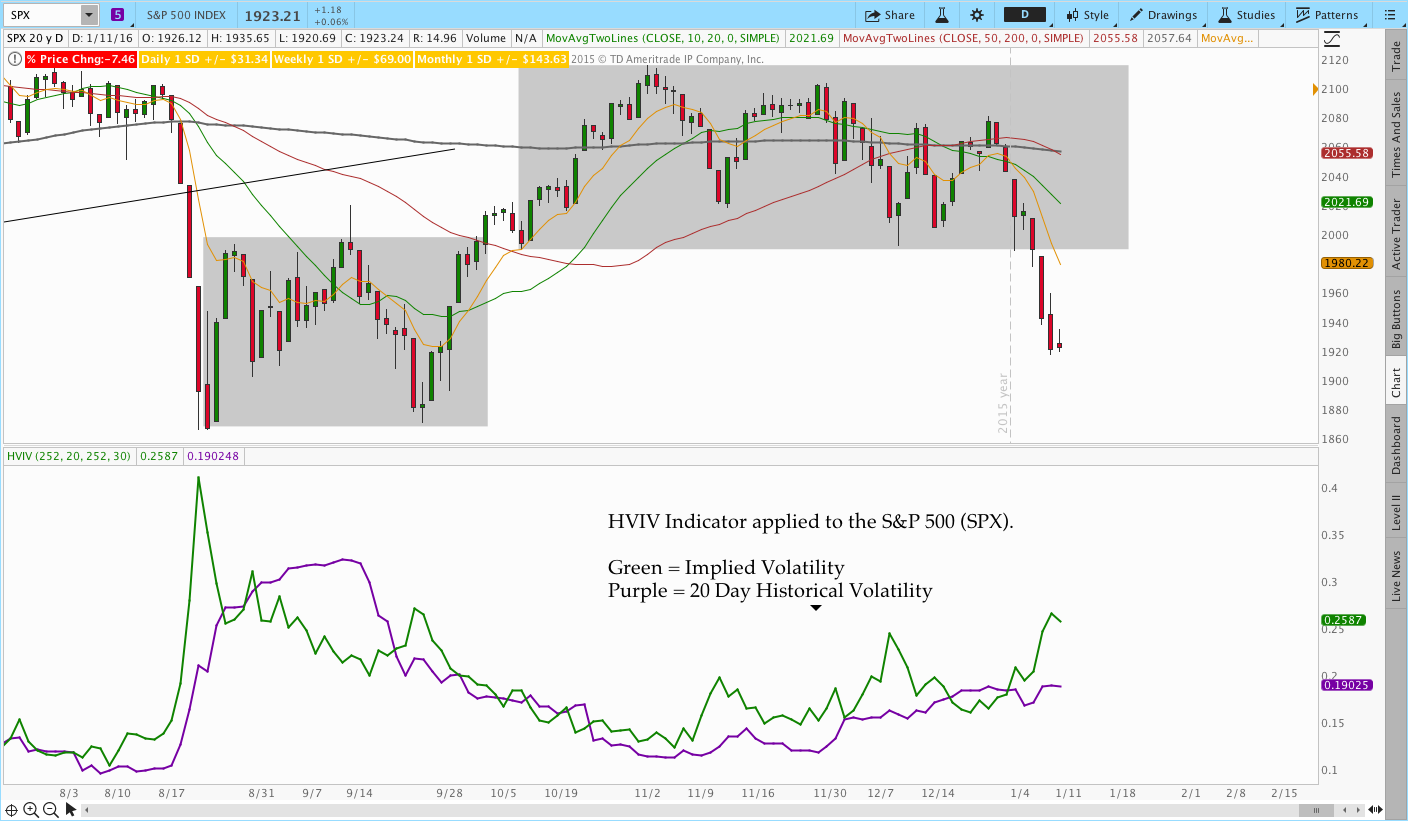
Indicator #1 HVIV – Historical and Implied Volatility
Historical Volatility and Implied Volatility are standard studies in ThinkOrSwim. However, it can be helpful to have both combined on one indicator. The HVIV indicator code below has two Historical Volatility Plots and Implied Volatility. Using two Historical Volatility plots allows an options trader to compare recent movement to longer term movement. For example, comparing 20 day HV to 60 day HV gives you an idea of how the market has moved in the past month relative to the past 3 months. When the shorter term HV exceeds the longer term HV, we know the market is becoming more volatile.
Additionally, comparing Implied Volatility to Historical Volatility gives you an idea of whether IV is “juicy” relative to recent movement. If the spread between and IV and HV is greater it means the options market has priced in more implied volatility relative to the recent market movement. The image below shows the indicator in action and the code follows.
ThinkScript Code:
#HVIV - Historical/Implied Volatility
#Provides 20 day and 60 day (1 and 3 month) HV Lines
#Feel free to share the code with a link back to thetatrend.com

declare lower;
declare hide_on_intraday;

#20 day input
input longLength = 252;
input shortLength = 20;

#60 day HV input
input longLengthb = 252;
input shortLengthb = 60;

def clLog = Log(close / close[1]);

#Plot Implied Volatility
plot ImpVol = IMP_VOLATILITY();

#Plot 20 day HV
plot HV = stdev(clLog, shortLength) * Sqrt(shortLength * longLength / (shortLength - 1));
HV.SetDefaultColor(GetColor(0));

#Plot 60 day HV
plot HVb = stdev(clLog, shortLengthb) * Sqrt(shortLengthb * longLengthb / (shortLengthb - 1));
HVb.SetDefaultColor(GetColor(0));
Indicator #2 HV Difference
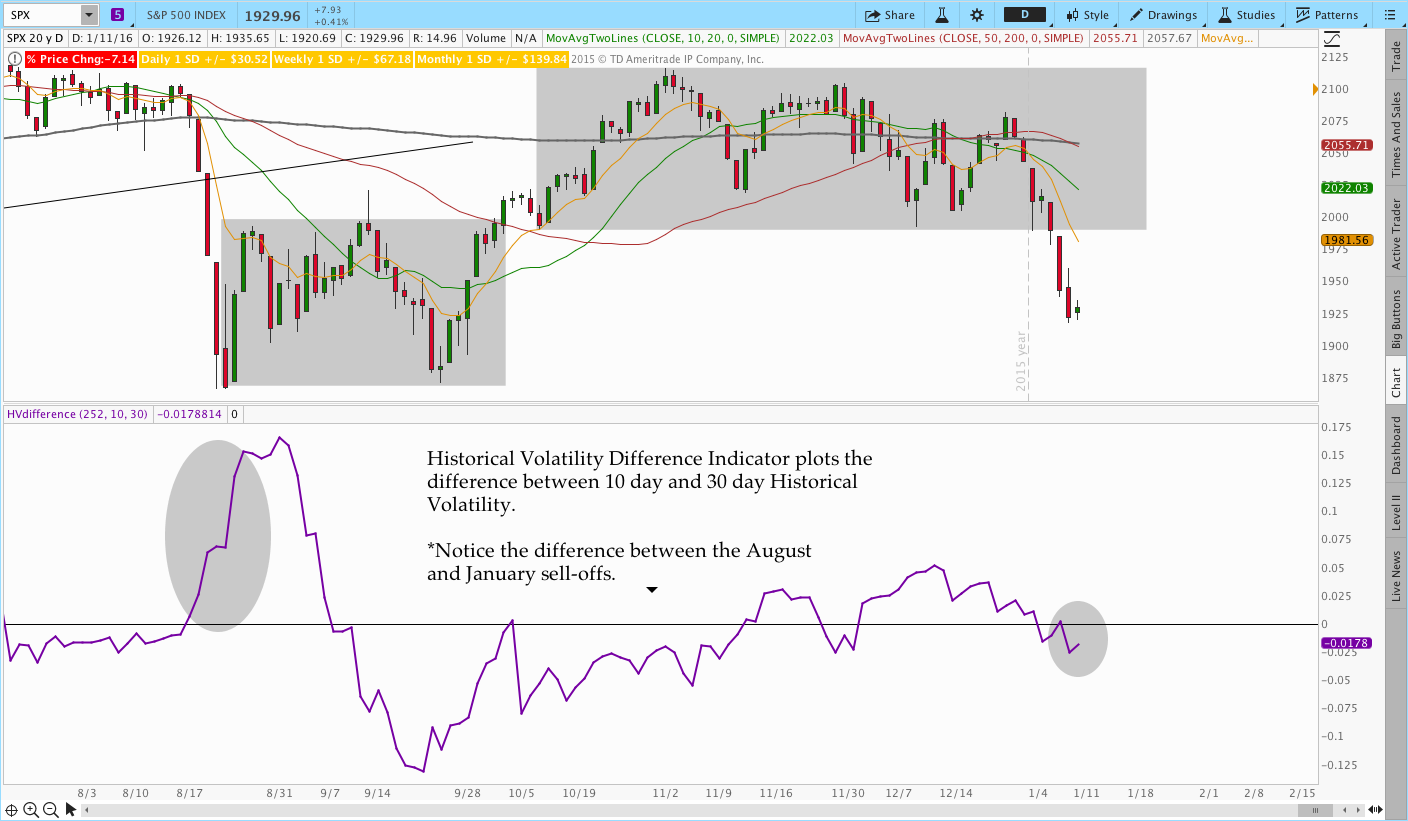
This indicator is similar to HVIV and plots the difference between two time periods of Historical Volatility. For example, we can plot the difference between 10 day and 30 day HV. When the value is positive, it means the market has been more volatile over the past 10 days than the past 30. When the value is negative, the market has been calmer than the previous 30 days. The slope of the indicator also helps you understand how quickly the relationship is changing.
Note the significant divergence between the August 2015 and January 2016 sell-off’s. That observation was mentioned here in the Weekend Market commentary.
ThinkScript Code:
#HVdifference
#Provides difference between 2 HV periods (10 and 30 day)
#Feel free to share the code with a link back to thetatrend.com

declare lower;
declare hide_on_intraday;

#Period Inputs
input longLength = 252;
input shortLength = 10;
input shortLengthb = 30;

def clLog = Log(close / close[1]);

#Calculate Values
def HV = stdev(clLog, shortLength) * Sqrt(shortLength * longLength / (shortLength - 1));
def HV2 = stdev(clLog, shortLengthb) * Sqrt(shortLengthb * longLength / (shortLengthb - 1));

#Plot
plot diff = HV-HV2;
diff.SetDefaultColor(GetColor(0));

plot zero = 0;
zero.SetDefaultColor(Color.Black);
Indicator #3 VIX:VXV Ratio
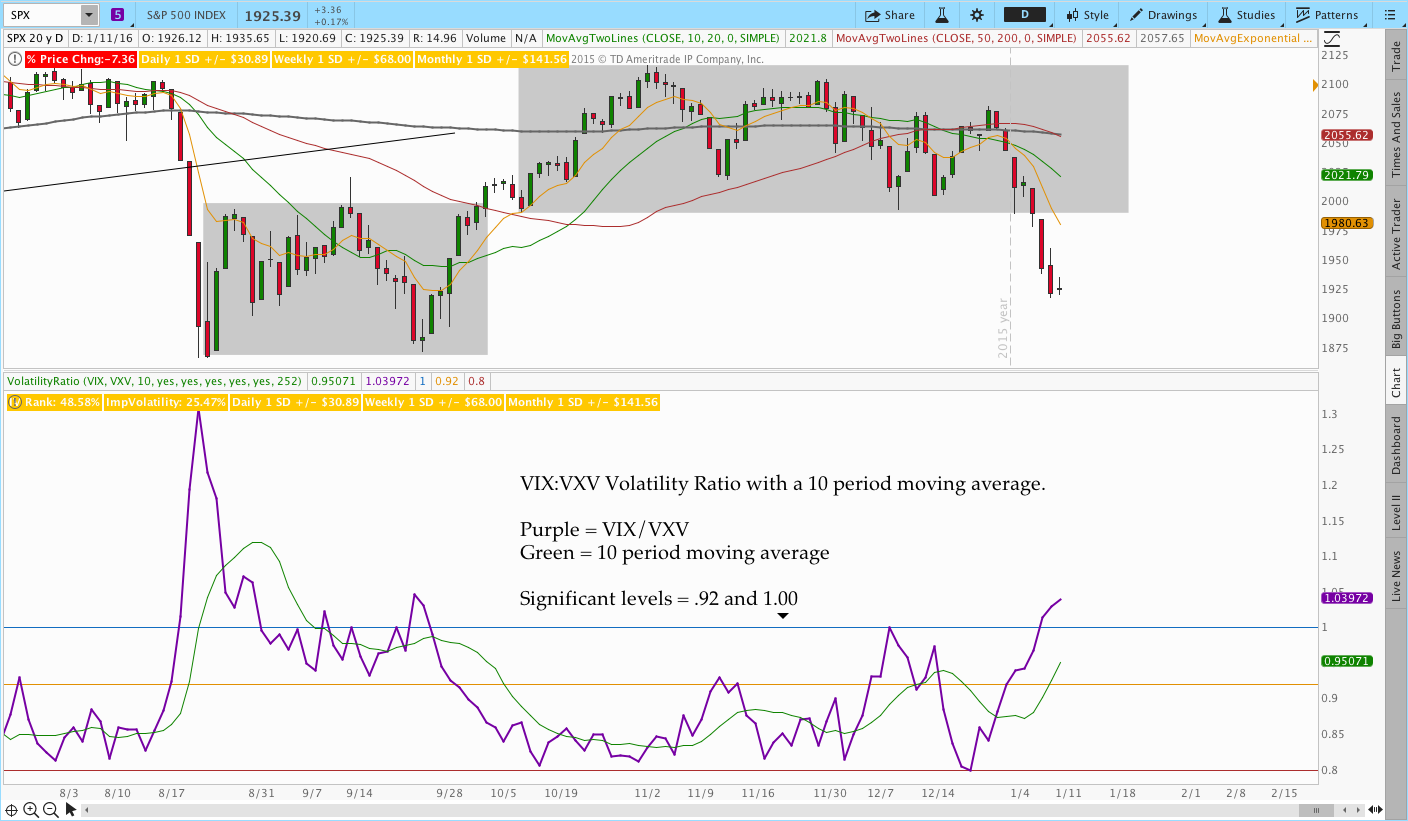
When the markets begin to tumble lower, the media is always quick to mention that the VIX has risen. If you’re an options trader, no part of that story should be surprising and, frankly, it doesn’t really tell us anything. Since the market has a history of declining faster than it goes up, we know and expect implied volatility to increase when the market declines.
The second part of the story with implied volatility is that it doesn’t increase uniformly across expiration cycles or strikes. During a panic, the Implied Volatility of shorter dated options tends to increase faster (and frequently more in percentage terms) than the implied volatility of longer dated options. The VIX is a commonly followed measure of the implied volatility of 30 day, at the money S&P 500 index options. Another volatility index is VXV, which is designed to measure the 3 month implied volatility rather than the 30 day. Comparing the two gives us a tool to quantify whether or not the market is entering panic mode.
The chart below displays the VIX:VXV Ratio indicator. The indicator is normally below a value of one and frequently below .92. When the market gets shaky, the value will increase and the rate of the increase can tell us something about the general panic in the market. Extreme readings frequently correspond with a short term oversold extreme rather than an opportunity to get short.
ThinkScript Code:
#VolatilityRatio - VIX:VXV Ratio Indicator
#Plots the ratio of 30 day to 3 month Implied Volatility
#Feel free to share the code with a link back to thetatrend.com

declare lower;
declare hide_on_intraday;

input STsymbol = "VIX";
input LTsymbol = "VXV";
input avgLength = 10;

#Removing the #'s will plot VXST vs. VIX as well
#VXST represents the IV of 9 day options
#input STsymbol2 = "VXST";
#input LTsymbol2 = "VIX";

def shor = close(STsymbol);
def lt = close(LTsymbol);
#def shor2 = close(STsymbol2);
#def lt2 = close(LTsymbol2);

plot avg = (average(shor,avgLength)/average(lt,avgLength));
plot ratio = shor/lt;
#plot ratio2 = shor2/lt2;
plot plus = 1;
plot zero = .92;
plot low = .8;

ratio.SetDefaultColor(GetColor(0));
Indicator #4 Z-Score
Another indicator that can be helpful for options traders is Z-Score. Z-Score gives you a way to quantify how far the market price is from the average in terms of standard deviations. Since the market frequently returns to some mean level, Z-Score can be used to quantify overbought and oversold conditions for selling credit spreads or counter trend trading. A more comprehensive overview of Z-Score is available in this post.
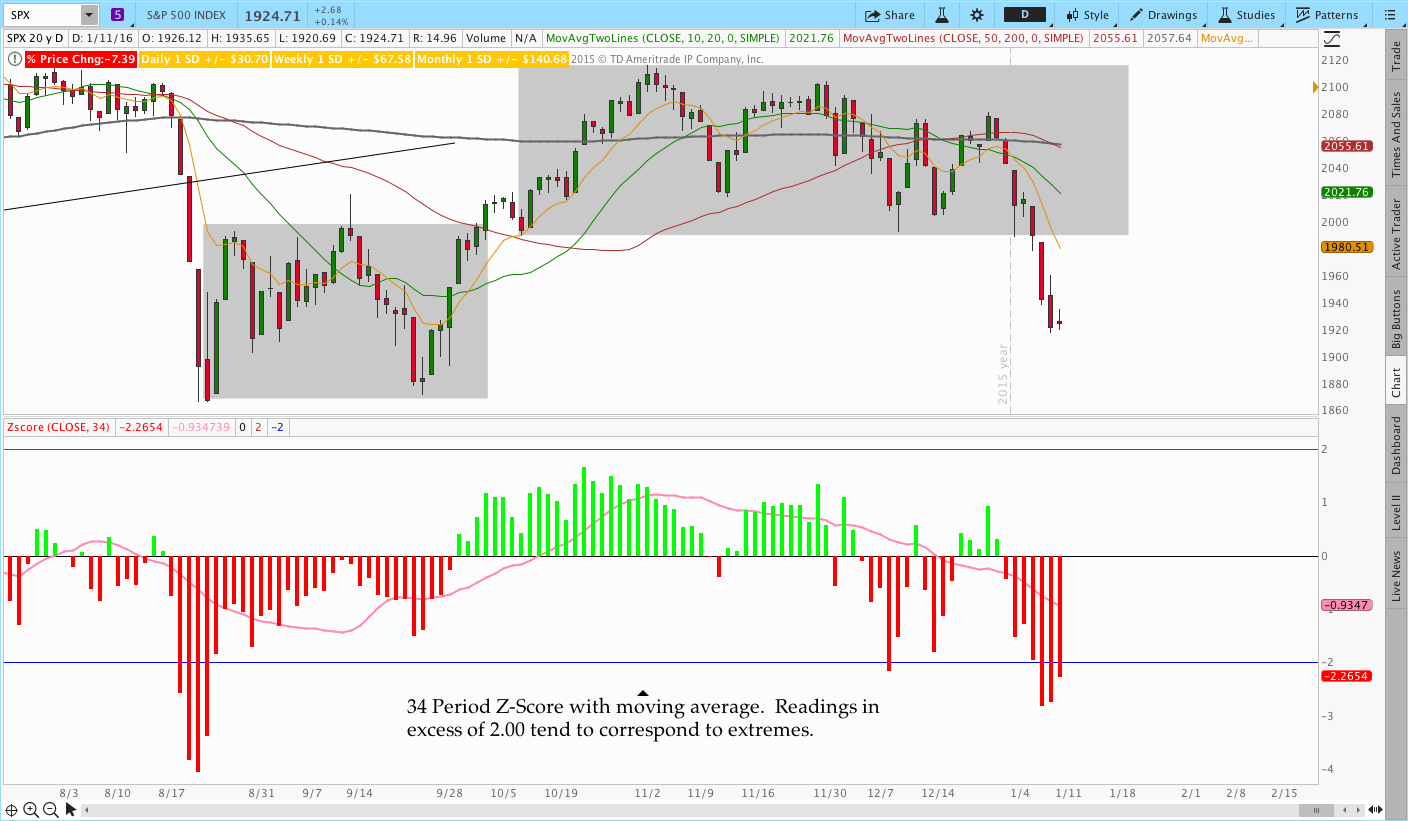
Click here to read the full post on Z-Score or just grab the code below.
#Computes and plots the Zscore
#Provided courtesy of ThetaTrend.com
#Feel free to share the code with a link back to thetatrend.com

declare lower;

input price = close;
input length = 20;
input ZavgLength = 20;

#Initialize values
def oneSD = stdev(price,length);
def avgClose = simpleMovingAvg(price,length);
def ofoneSD = oneSD*price[1];
def Zscorevalue = ((price-avgClose)/oneSD);
def avgZv = average(Zscorevalue,20);

#Compute and plot Z-Score
plot Zscore = ((price-avgClose)/oneSD);
Zscore.setPaintingStrategy(paintingStrategy.HISTOGRAM);
Zscore.setLineWeight(2);
Zscore.assignValueColor(if Zscore > 0 then color.green else color.red);

plot avgZscore = average(Zscorevalue,ZavgLength);
avgZscore.setPaintingStrategy(paintingStrategy.LINE);

#This is an optional plot that will display the momentum of the Z-Score average
#plot momZAvg = (avgZv-avgZv[5]);

#Plot zero line and extreme bands
plot zero = 0;
plot two = 2;
plot negtwo = -2;
zero.setDefaultColor(color.black);
Please use the social bar above to share this post and don’t forget to follow ThetaTrend on Twitter!
Don’t miss out. Want to receive an alert as soon as new content is posted?

Sign up for my email list and stay up to date with the latest information on options trading.
Click here to sign up for the list, get a copy of the Theta Trend Options Trading System, the Trade Tacker I use, and information about new systems.
Even better . . . it’s all totally free.