Weekend Market Commentary 1/15/2016 – $RUT, $SPX, $RVX, $VIX, $VXV
Big Picture:
It goes without saying that 2016 has been challenging for most non-directional, short gamma traders.
 Anytime you’re short premium in front of a freight train, things can get dicey. If you don’t know when to step off the tracks, you’ll eventually get hit. The market is not, “Out to get us,” but we do need to recognize favorable and unfavorable environments. For many short gamma traders, this is just an undesirable environment. Eventually it will pass.
Just because short gamma strategies have had a challenging start to 2016, it doesn’t mean that the strategies are “bad” or don’t work. It does, however, mean you need a plan for controlling your risk to maintain consistency. One of the big mistakes traders make in the face of adversity is switching strategies. Switching from strategy to strategy will not bring about consistency.
No strategy (short of maybe high frequency trading) makes money every day and there will always be desirable and undesirable market environments. Some of the income strategies we’re trading have very high win rates, but that doesn’t mean they can’t take a loss. If it’s time to take a loss, just take the loss. Taking the loss gives you the opportunity to come back tomorrow and go back to trading. You can also use that experience to refine the strategy and your risk management rules.
Big market moves tend to flush out inexperienced traders and weaker hands. You are much less likely to get flushed out if you’re actively managing your risk when the market moves against you. Also keep in mind that controlling risk isn’t a one day event. When you control risk today, all that means is that you get to stick around and do it again tomorrow.
Volatility And The State Of The Decline
Last weekend we took a look at a divergence in volatility. Specifically, I said that we haven’t seen the explosion in volatility that typically accompanies a decline. That divergence continued this week and volatility still hasn’t reached panic levels. The VIX:VXV ratio actually declined and both VIX (30 day IV) and VXV (3 month IV) remained essentially unchanged. The relative complacency in volatility suggests that participants are largely hedged, steadily selling premium, or not that concerned about the decline yet.
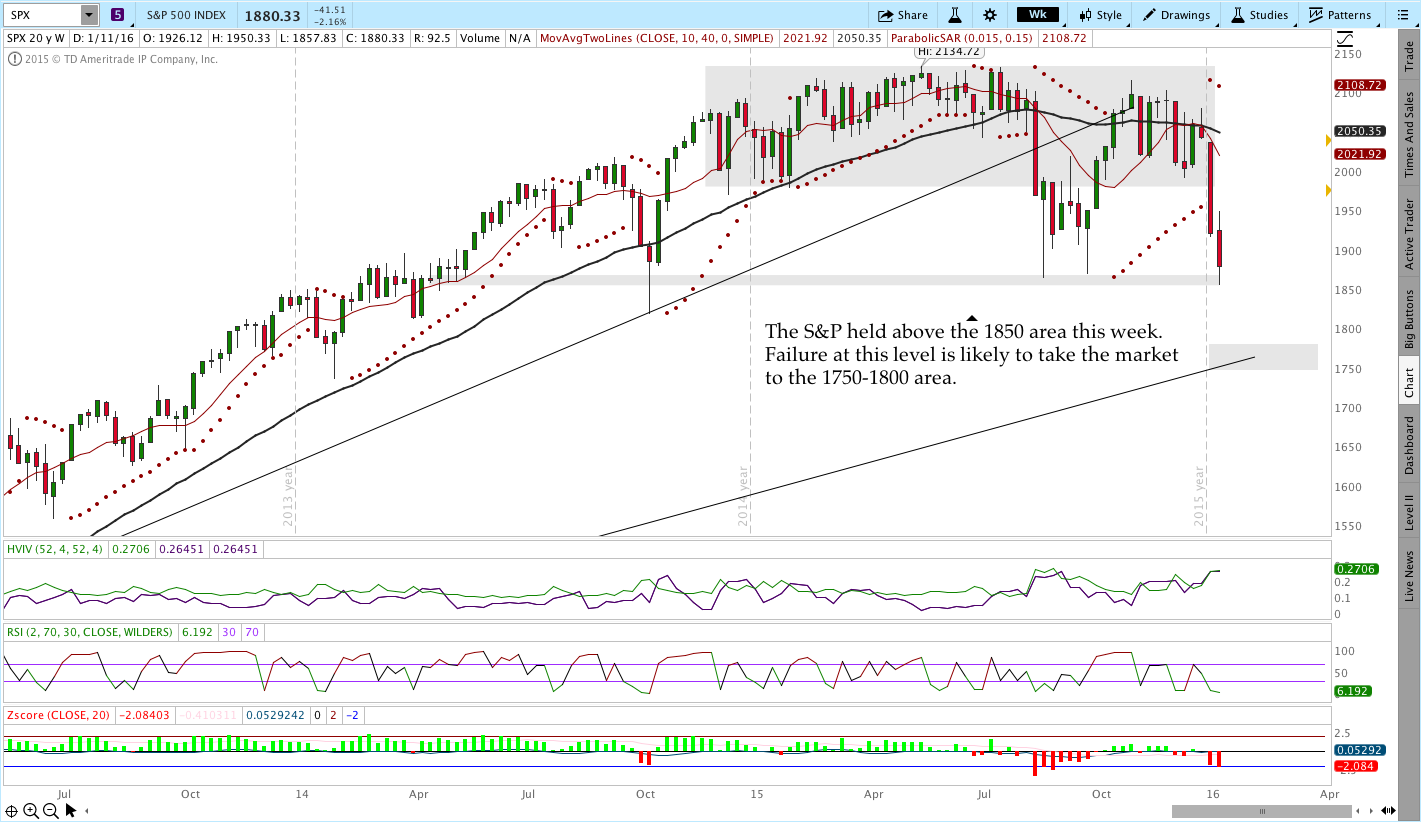
From a price standpoint, the S&P 500 hasn’t broken the 1850 level. While volatility has been under control through this stage of the decline, breaking and holding below that level is likely to trigger a significant increase in volatility (both implied and realized). However, the price action towards the end of this week suggests that we might need to wait a bit longer for the panic decline to play out.
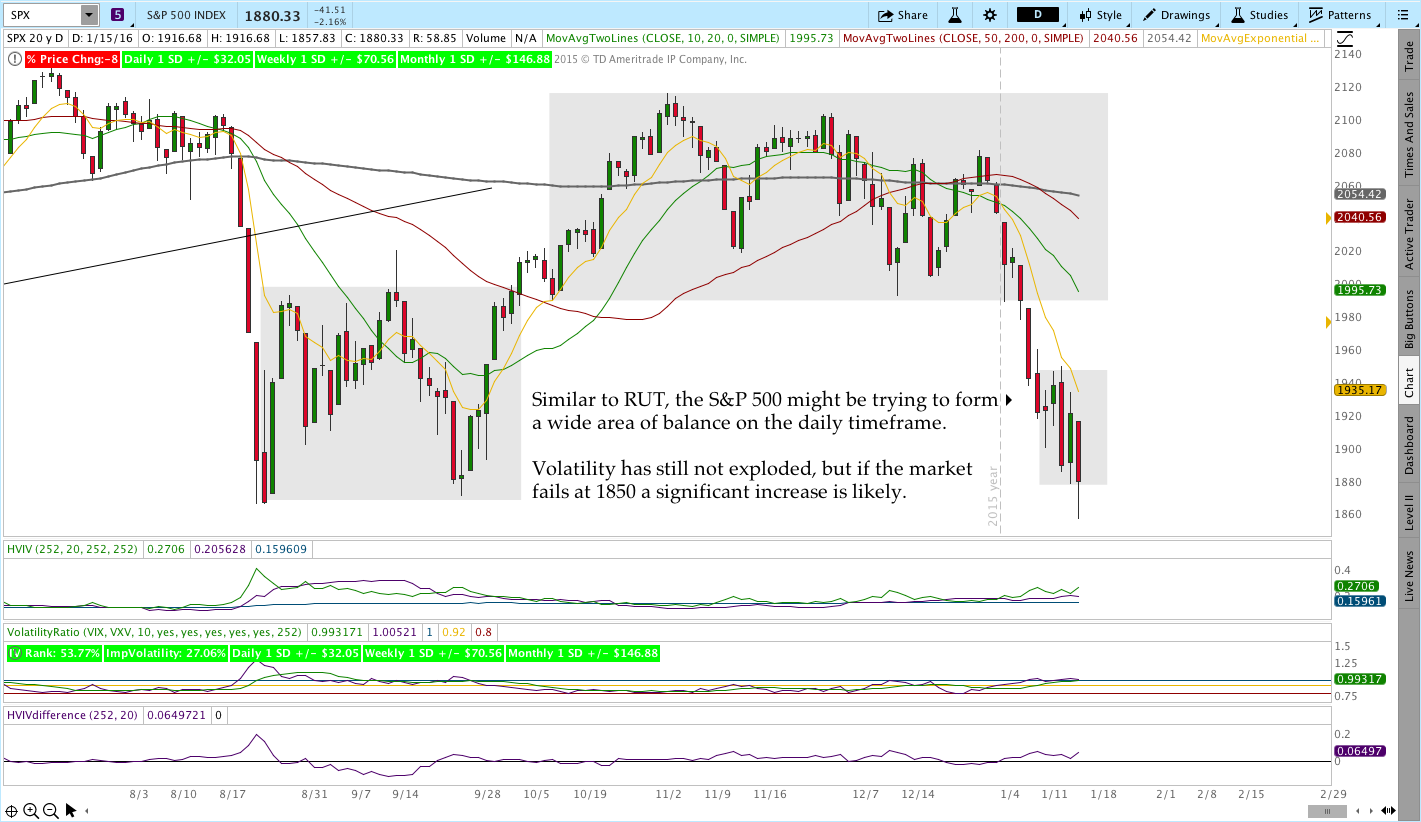
This week both the Russell 2000 and the S&P 500 slowed on the downside. At the same time, they began to display some signs of balance or consolidation. The range is pretty wide, but some of the price action we’re seeing is more constructive than what we saw the week before. If we do see the market pause or turn higher next week, it’s important to recognize that any move higher is likely to fail.
Intuitively, many market participants are still long or have been buying on the way down. One of the big signs that participants are still long is that we haven’t seen the capitulation that typically accompanies declines or an explosion in volatility. Volatility is under control and nobody has panicked yet. Additionally, we know that stocks tend to have an artificial buy side pressure. In other words, people are generally net buyers of stocks. While sellers have been aggressive over the past two weeks, heavy, panic selling hasn’t hit yet.
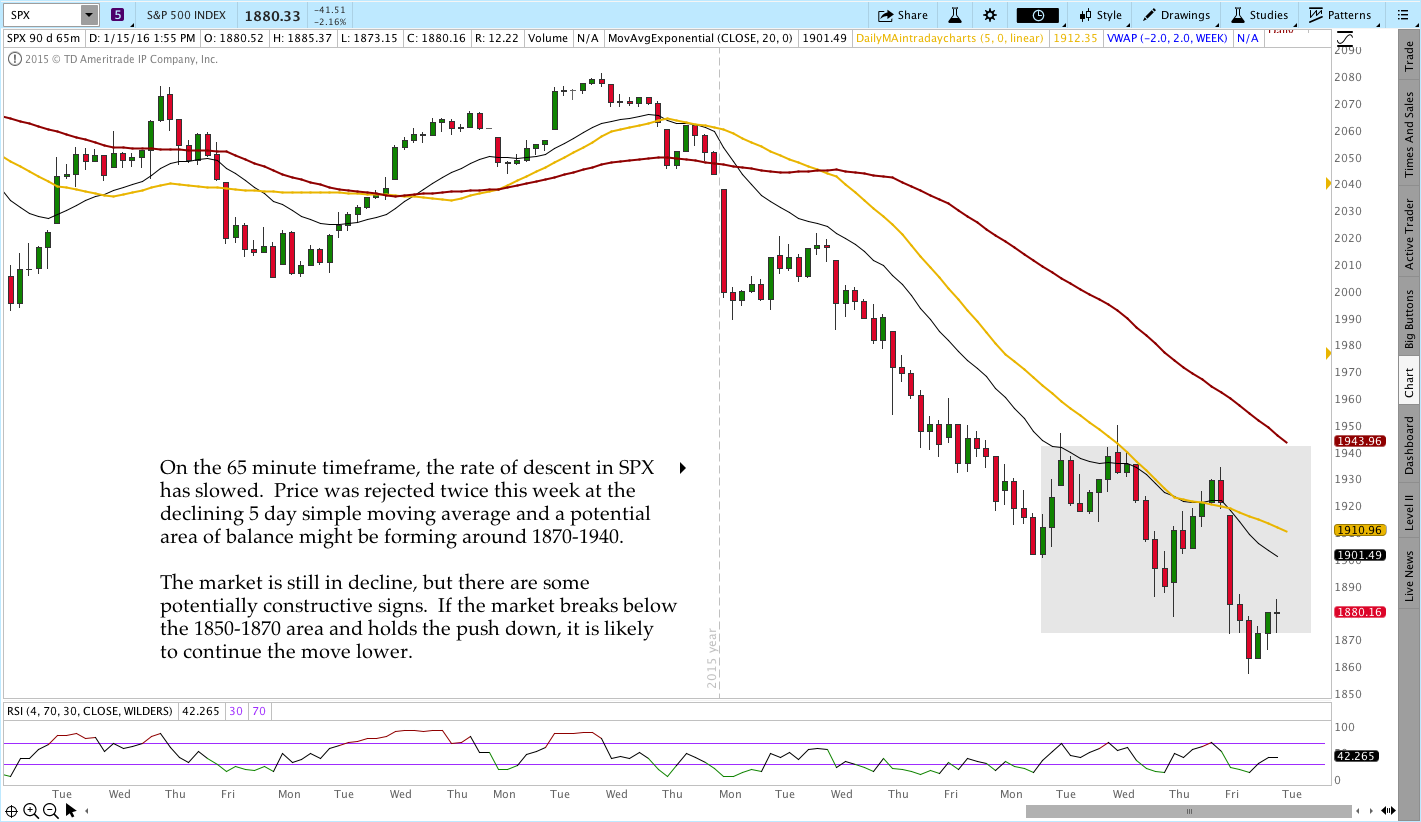
If the market moves higher in the near future it’s likely to draw in some of the BTFDers while other participants use the opportunity to reduce their long exposure and/or get short. If enough participants begin to sell long positions, price could begin another leg of decline where it falls through the recent lows (1850ish on the SPX). More energetic selling and a significant increase in volatility are likely if the market breaks through on the downside.
Sure, the market could also stabilize and continue higher from this level, but technically broken markets don’t tend to stage major rallies until more damage than we’ve seen is done. Obviously we can’t predict where the market is going, but there are structural reasons for concern and rallies should not be trusted in this environment.
Have a good, longer weekend. The markets need the rest.
Market Stats:
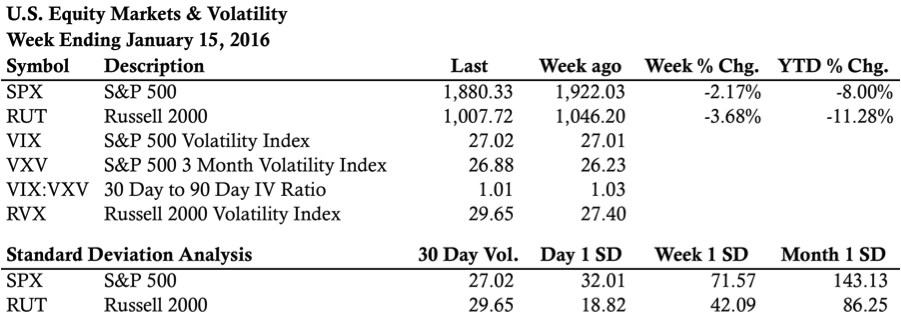
Levels of Interest:
In the levels of interest section, we’re drilling down through some timeframes to see what’s happening in the markets. The analysis begins on a weekly chart, moves to a daily chart, and finishes with the intraday, 65 minute chart of the S&P 500 (SPX) and the Russell 2000 ($RUT). Multiple timeframes from a high level create context for what’s happening in the market.
S&P 500 – $SPX (Weekly, Daily, and 65 Minute Charts):
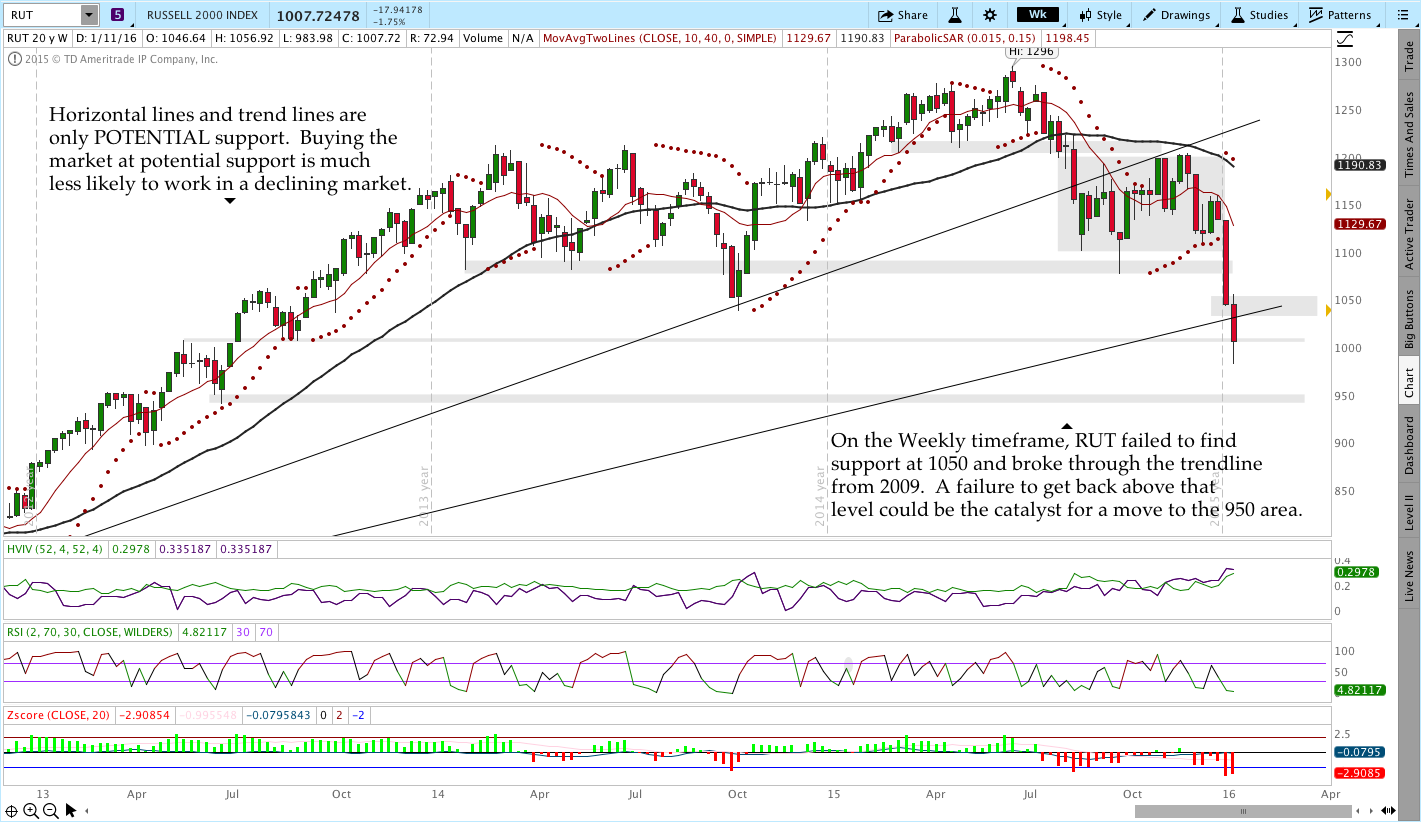
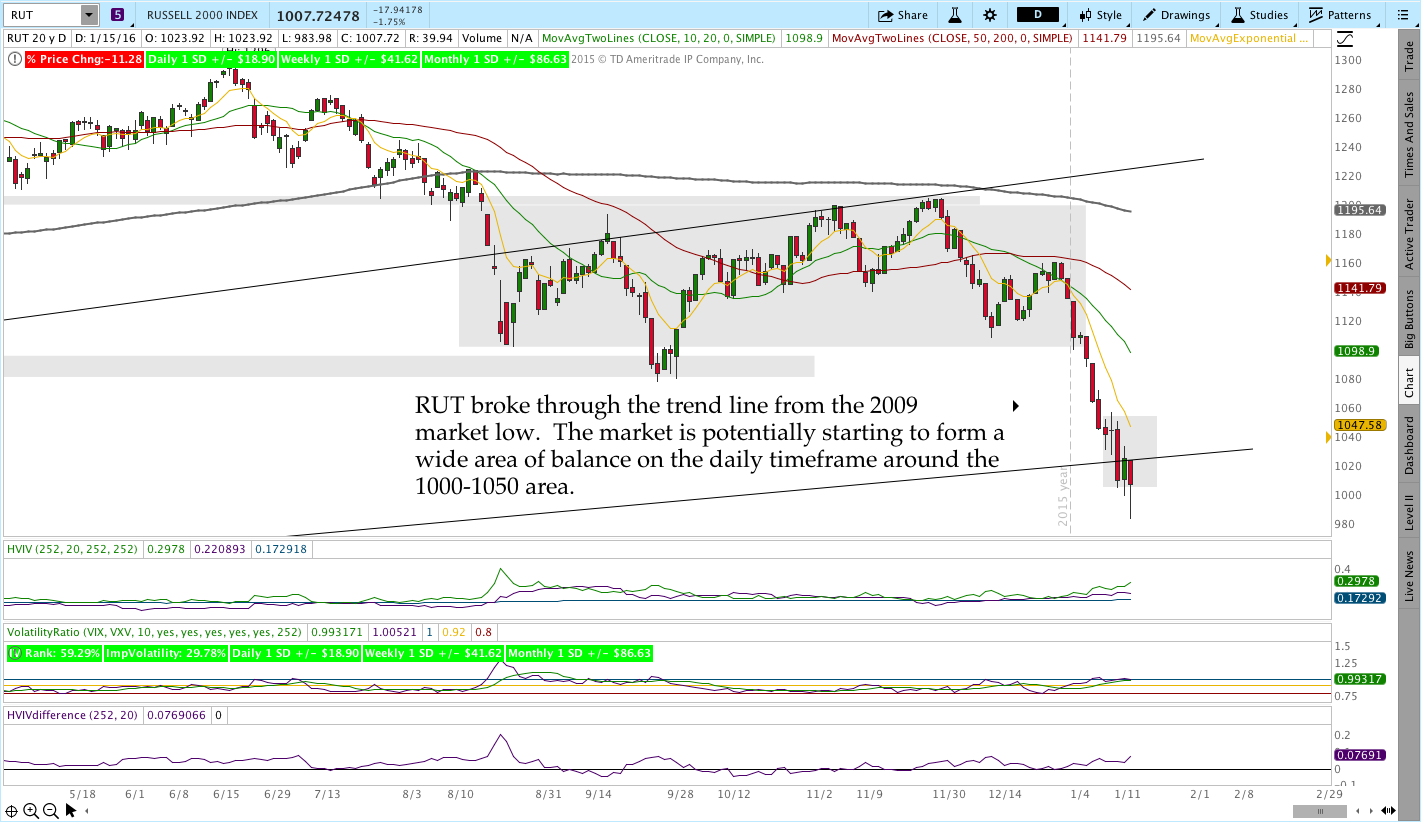
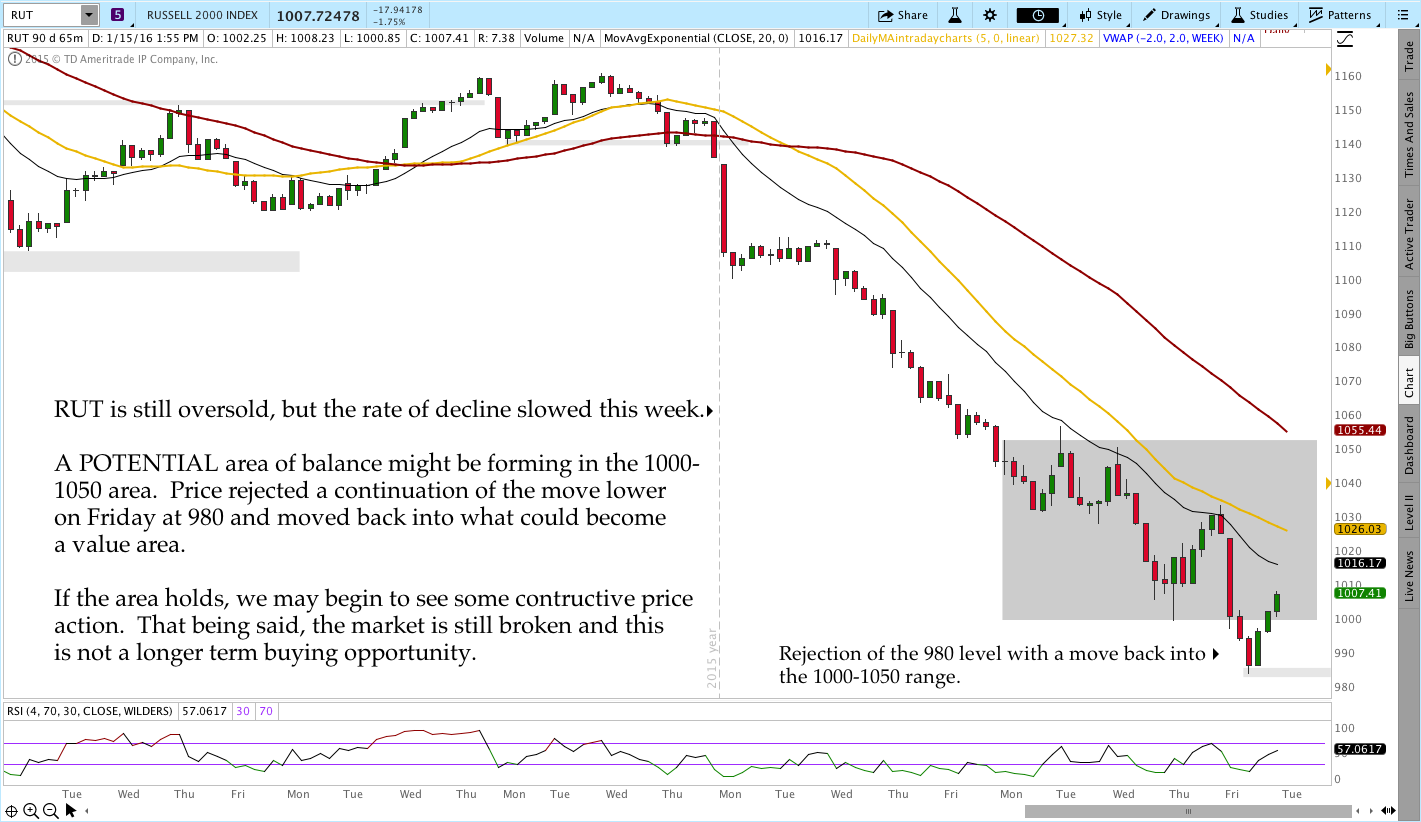
Russell 2000 – $RUT (Weekly, Daily, and 65 Minute Charts):
Live Trades . . .
The “Live Trades” section of the commentary focuses on actual trades that are in the Theta Trend account. The positions are provided for educational purposes only.
——————————
This coming week I’ll be opening the March 2016 CIB. I realize we’re stepping into some hot water to put on a new position so I’ll be getting involved carefully and watching to see how the market opens and trades on Tuesday. I still expect a flush lower in price and the real question is whether we see some stability with a move higher first.
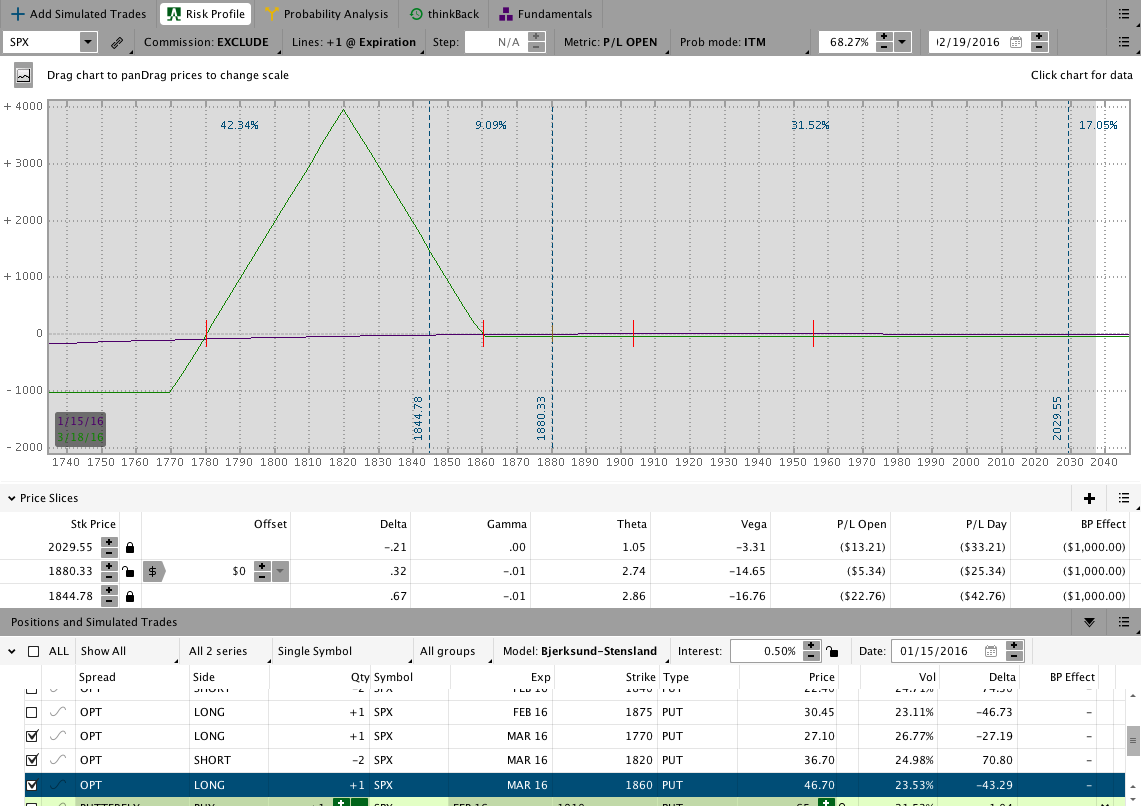
I’ve been exploring and experimenting with some OTM Broken Wing Butterflies, but it’s still too early to share much. I’ve included a couple of positions below to illustrate what I’m working on. The trades below began recently as BWB’s with 25 Delta shorts. The market has not been favorable for the positions, but they’ve held up fairly well. The starting structure I used for the trades was discussed in this post.
SPX BWB (Slightly over 30 DTE with 25 Delta shorts at entry):
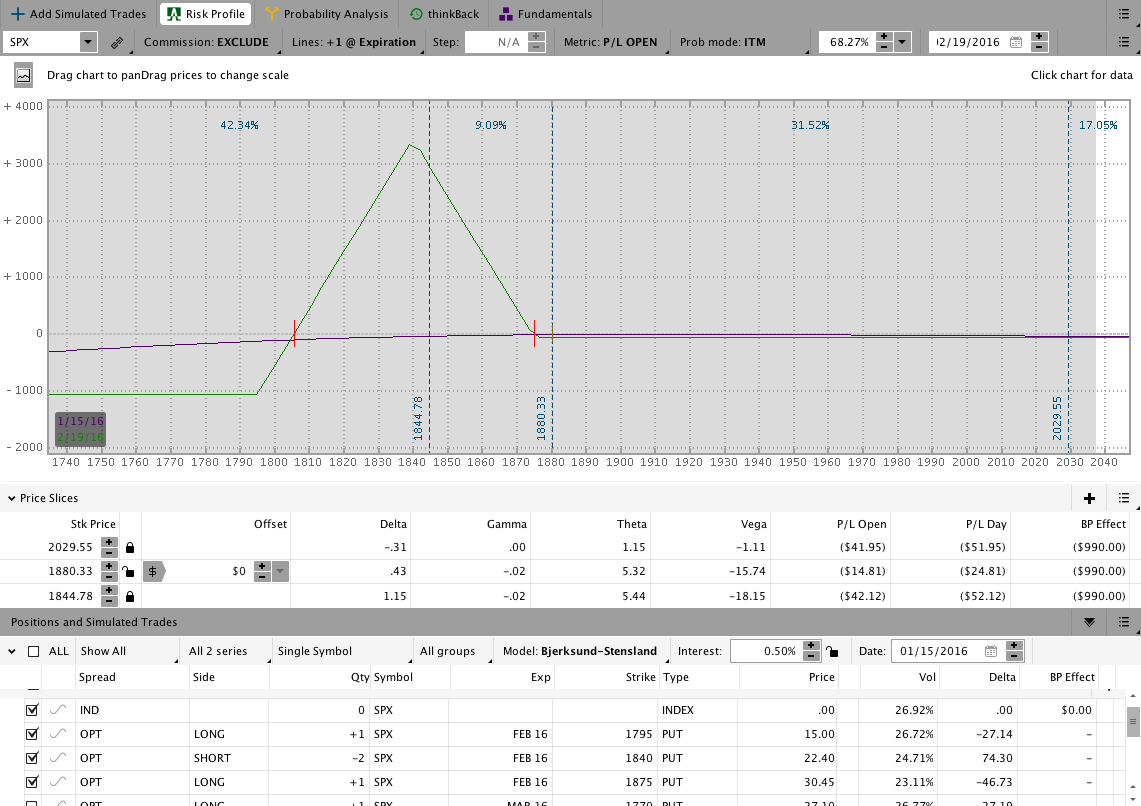
SPX BWB (Slightly over 60 DTE with 25 Delta shorts at entry):
The Results Spreadsheet is up to date as of Friday. Both positions above show small open losses and I took a small loss on a RUT BWB yesterday (Friday) with the persistent move lower. All of the trades mentioned there are actual trades that I’ve taken. There are no paper trades or fuzzy fills, they’re all real.
If you want to learn more about how I trade, check out the Core Income Butterfly Trading Course. The course covers my primary strategy in detail.
Looking ahead, etc.:
This week I’ll be entering the March Core Income Butterfly Trade. I’d really like to see some movement higher before getting involved, but obviously we don’t know how things will play out. Generally speaking, I’m doing my best to keep directional risk and gamma as low as possible. Stay safe out there and control your risk.
Have a great weekend and please share this post if you enjoyed it.
Click here to follow me on Twitter.
Want to receive an alert as soon as the next market commentary is posted?

Sign up for my email list and stay up to date with the latest information on options trading.
Click here to sign up for the list, get a copy of the Theta Trend Options Trading System, the Trade Tacker I use, and information about new systems.
Even better . . . it’s all totally free.