Weekend Trend Following Market Commentary 10/24/2014
Big Picture:
It seems like stocks are having two directional mini-crashes and this week we saw equities take back some of the recent losses in a fast move higher. I think there’s a lot of uncertainty in the equity markets and the easy upside looks like it’s on hold. The Russell 2000 has been essentially sideways all year with deviations higher and lower. I think we’re seeing a little bit of distribution right now, but let’s see how next week plays out.
The dollar continues to be strong, but, at least for now, the pace of the uptrend has slowed. I continue to have long dollar trades and this week I was taken out of a long position in DBA (Agriculture).
Implied Volatility:
Implied volatility fell quite a bit this week with the move higher, but remains ever so slightly elevated.
The Weekly Stats:
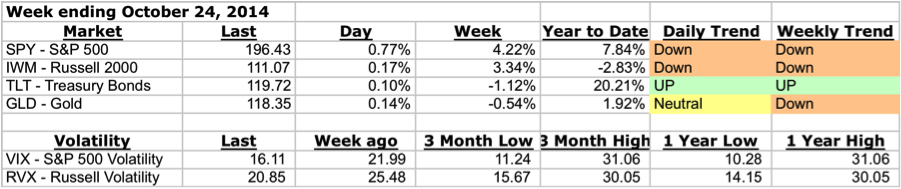
A note about trend . . . Trend on the daily timeframe is defined using Donchian channels and an Average True Range Trailing Stop. There are three trend states on the Daily timeframe: up, neutral, and down. On the weekly timeframe, I’m looking at Parabolic SAR to define trend and there are two trend states, up and down. In reality, there are always periods of chop and I’m using the indicator to capture the general bias of both the trend and those periods of chop.
A Winged Thing:
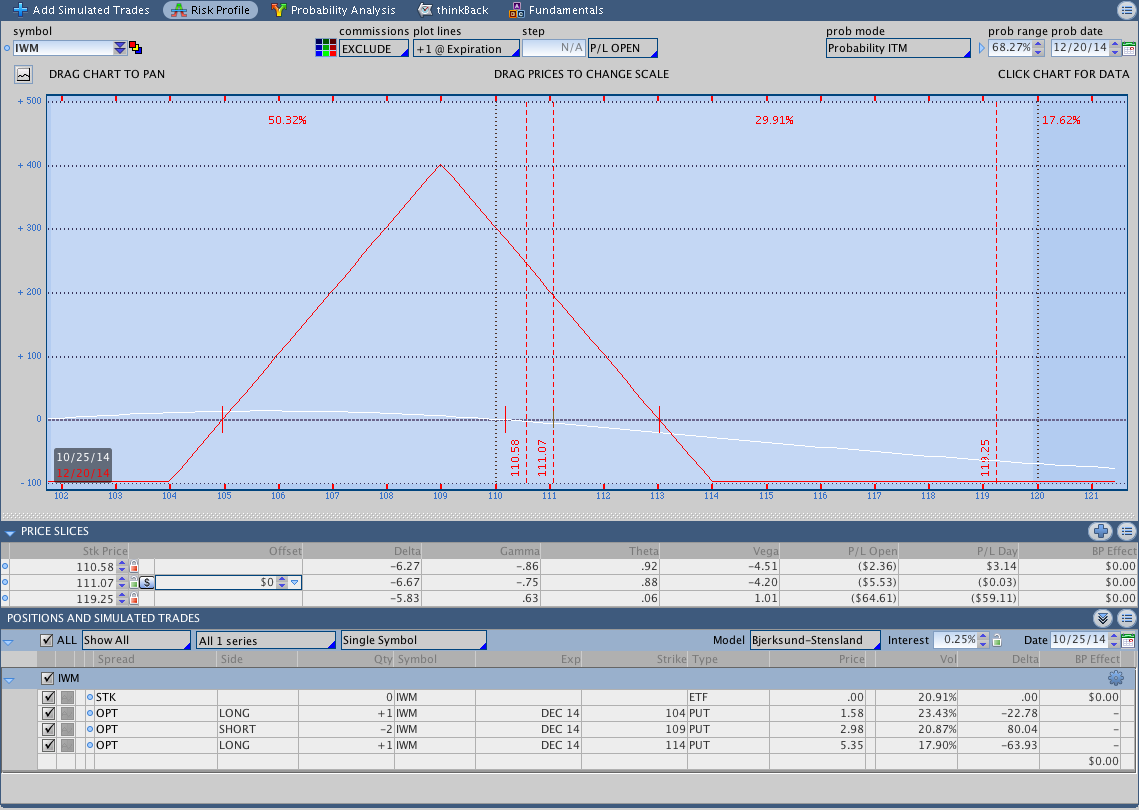
Yesterday I bought a slightly bearish Butterfly in IWM. A while back I discussed break even points on Butterfly’s vs. Iron Condors. What I’ve found is that I feel more comfortable with the break even points and risk/reward on Butterfly’s. I’ve been doing some experimenting with Butterfly trading in one of my IRA’s and I feel a little better equipped to discuss trading them now. I will note that I’m definitely not an expert at trading Butterfly’s, but I do like the position characteristics and I’m willing to share the learning process.
Here’s the story. Yesterday when IWM was trading around 110.50, I bought to open a Dec 2014 104/109/114 Put Fly for .97. My break even points at expiration are roughly around 105 and 113. Given the 3% up move in the Russell this week and the slightly bearish tone of the Russell this year, I feel comfortable having a slightly bearish position. If IWM trades to 113, I’ll be looking at making an upside adjustment. I have a little further to go on the downside and I won’t be touching anything unless we get below 105. If we get down to 105 soon, my adjustment will be different than if we take a while to get there.
An image of the position is below. The red vertical line is the trade entry price when IWM was at 110.58 and the other vertical line is the close. Right now it’s showing a loss of 5.50 . . . meh.

Breakout System Market Stats:
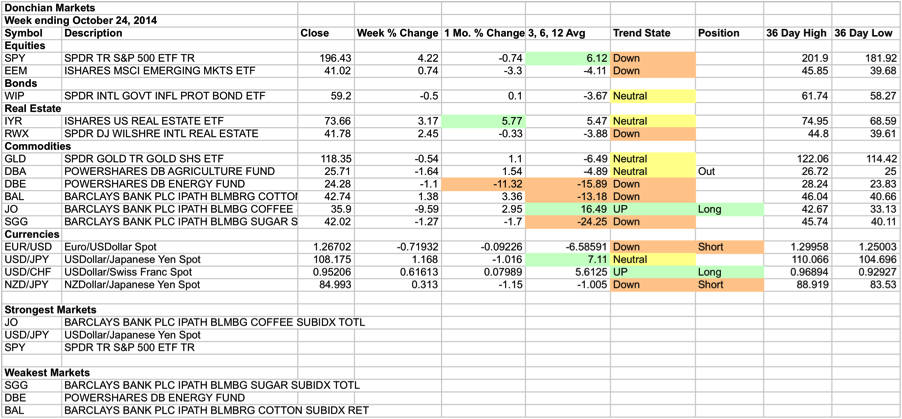
The last time I discussed the Donchian channel system, forex was acting as big drag on the system. However, the moves in the past month or so have really helped the system. The challenging thing about the breakout system is that you go for long periods of time where the system takes little losses over and over again. Right when you’re about to give up on the system, it tends to turn around and perform really well. This year that is definitely the story for the Forex markets I trade.
In the rankings below, I’m using a few different percentage change amounts to rank the markets. The week and month percentage change columns should be fairly self-explanatory. The 3, 6, 12 month ranking is a little different. What I’m doing is taking the 3, 6, 12 12 month percentage changes and averaging the amounts. What that ranking gives us is an indicator of longer term market strength with a shorter term bias. That ranking was discussed by Mebane Faber in the Ivy Portfolio as a way to choose investments in a monthly rotation system. I’m using it below as an objective way to measure strength.
It’s worth noting that the trend states are bearish, but very mixed right now. It seems like the down moves in most markets are slowing or pausing. Those pauses could resolve themselves either to the upside or the downside.
Trades This Week:
DBA – Sold to Close 70 shares at 25.77
IWM – Bought to open Dec 2014 104/109/114 Put Butterfly for .97
Option Inventory:
IWM – Dec 2014 104/109/114 Put Butterfly (bought for .97)
ETF & Forex Inventory:
JO – Long 12 shares from 188.58
EUR/USD – Short 5,000 notional units from 1.35028
USD/CHF – Long 6,000 notional units from .9037
NZD/JPY – Short 4,000 notional units from 85.73
Looking ahead:
At the beginning of October I began to worry that I wasn’t doing anything with my “investment” accounts. I had some positions on, but I really wasn’t paying attention to them and they weren’t showing any signs of progress. In the past month I’ve been looking at different mechanical systems for investing and my take away is that the rotation system described in the Ivy Portfolio is a good solution for systematic investing. This week I’ll be putting up some content to discuss that rotation system in more detail.
In regards to trading, my long coffee trade ($JO) is taking some heat and is close to getting stopped out. Initially the trade was doing ok, but price never made a significant move higher and the market fell back. I’ll be closing the position this week if the market falls just a little bit more. The upside adjustment point on the IWM Butterfly is 113 so I’ll need to make some changes if we get up and above that level. Enjoy your weekend and thanks for reading. It should be a beautiful fall day here in Sun Valley, Idaho.
If you enjoyed this post, please click above to like it on Facebook or Tweet it out. As always, thanks for reading and enjoy the rest of your weekend.
Want to receive an alert as soon as the next market commentary is posted?

Sign up for my email list and stay up to date with the latest information on options trading and trend following.
Click here to sign up for the list, get a copy of the Theta Trend Options Trading System, the Trade Tacker I use, and information about new systems.
Even better . . . it’s all totally free.