Weekend Market Commentary 1/8/2016 – $RUT, $RVX, $VIX, $VXV, $VVIX, $SPX
Big Picture:
 Okay everyone, it’s time to take off your tin foil hats and climb out of the bomb shelter.
The markets have had something of a healthy offer over the past week. I have no idea why other than the sellers are more aggressive than the buyers and, frankly, it doesn’t matter. Understanding “why” has nothing to do with controlling risk, managing positions, and respecting the possibility that, at times, your position might just be wrong.
Trading is about trading. Trading is not about being right. The market is not here to validate our opinions or make us look smart for our buddies in the bomb shelter. However, if we can stick around long enough, the market will humble us (hopefully) and teach us an incredible amount about our psychology.
As we move into the year we need to remember that any assumptions we had about the market need to be questioned. Over the past few years, the market has responded to down moves by rallying sharply. That type of price action makes sense given the context of a Bull market. That sentiment has shifted and we need to be prepared and accepting of the Bear market we’re entering. In this environment, we can expect the rallies to fail and the declines to be faster with fewer pauses.
If you’ve developed trading habits and systems that rely on the behavior of a Bull Market, now is the time to recognize and change your assumptions. Volatility presents opportunity, but that opportunity is not without risk.
What is Volatility telling us?
Most traders like to look at price charts in a decline and wonder where the drop stops. Unfortunately, you won’t find the answer in a chart and nobody (short of maybe the Plunge Protection Team) knows. Price levels only tell us areas where the possibility for change exists. There are no guarantees.
One of the interesting things to note about the move lower this week is that every day felt very measured and controlled. Sure the market was off several percent, but it didn’t fall out of bed like it sometimes does. It’s just the number of consecutive declines that’s causing pain. When compared to the collapse in August 2015, they felt almost slow. Due to the controlled nature of the declines, there’s also a divergence in volatility. If you’re just looking at the VIX and RVX to measure panic, you’re missing a big part of the picture.
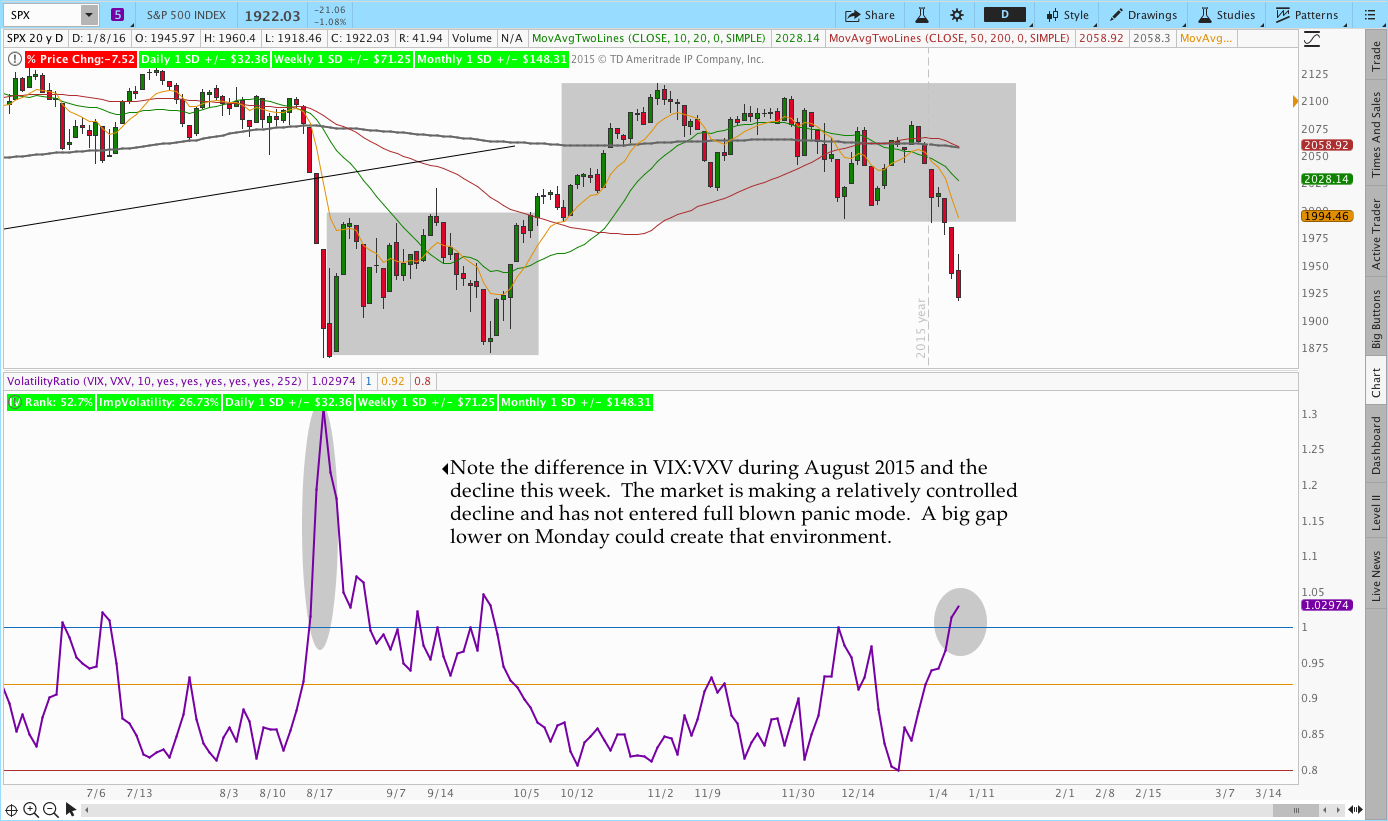
In order to understand what’s going on with Implied Volatility, we should also consider both the VIX:VXV ratio and the volatility of volatility (VVIX). One of the things we know about VIX:VXV is that in a panic, short dated options explode in value more than longer dated options. VIX, which measures 30 day implied volatility, will become elevated relative to the implied volatility of longer dated options. We use VXV to measure the implied volatility of 3 month options. Normally VIX:VXV is a ratio below one and in a bull market it’s usually below .90. When things get rocky, the ratio will increase above one and that’s exactly what we’re seeing right now.
The image below illustrates the divergence in VIX:VXV ratio. Despite the big decline this week, the implied volatility of 30 day options has not exploded relative to 3 month implied volatility. From an implied volatility standpoint, we’re not seeing total panic and mayhem.
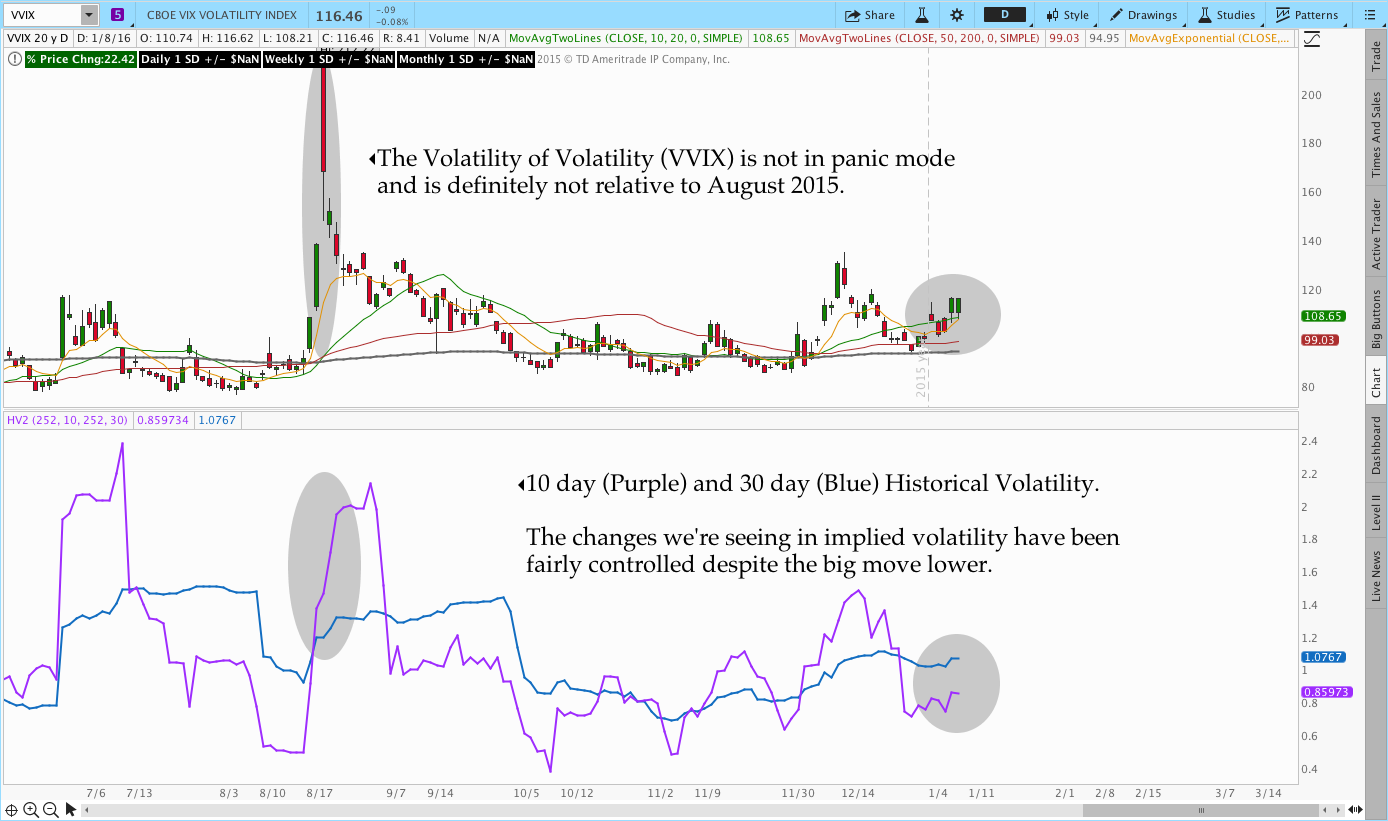
In addition to what we’re seeing with the VIX:VXV ratio, the Volatility of Volatility (VVIX) isn’t in panic mode either. In the chart below we’re looking at VVIX and what we’re seeing is that the VIX has made a controlled move higher in the face of the decline.
The obvious question is what the divergence in Implied Volatility means for the market. The lack of panic suggests that participants either anticipated the decline or they haven’t seen reason to panic yet. The open and trading we see next week is going to hold some critical clues for what’s next.
If we see a large gap lower on Monday, things are going to get ugly much faster than people were expecting. In that scenario, we can expect to see VVIX and VIX make panic type moves. All the short options that seemed “juicy” to sell this week will seem cheap very quickly. On the other hand, if the market finds some stability, it means that implied volatility was “right” going into the weekend.
Sleep tight, we need to wait and see what Monday holds.
Note for TOS Users, I provided the VIX:VXV Ratio ThinkScript in the comments below.
Market Stats:
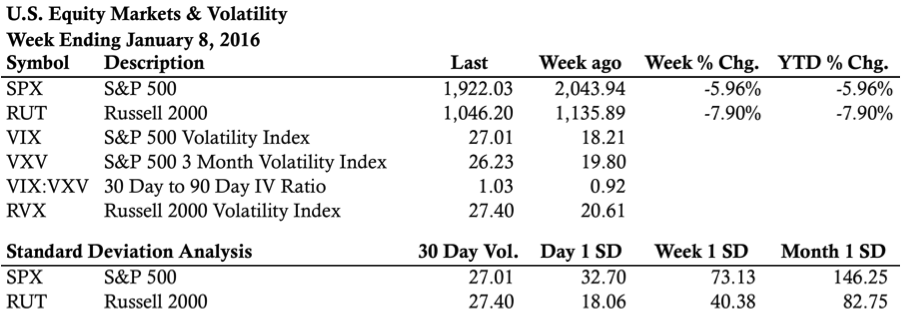
Levels of Interest:
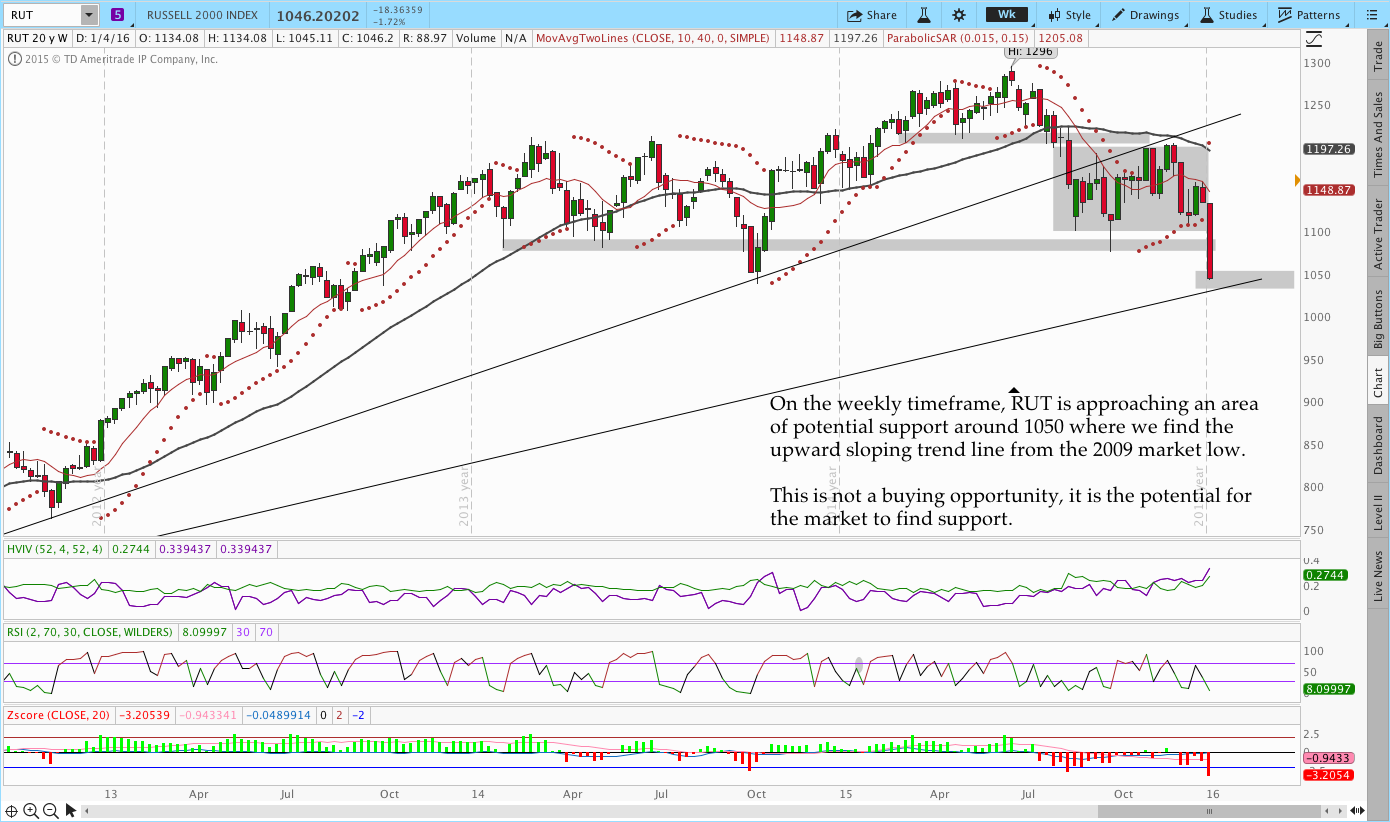
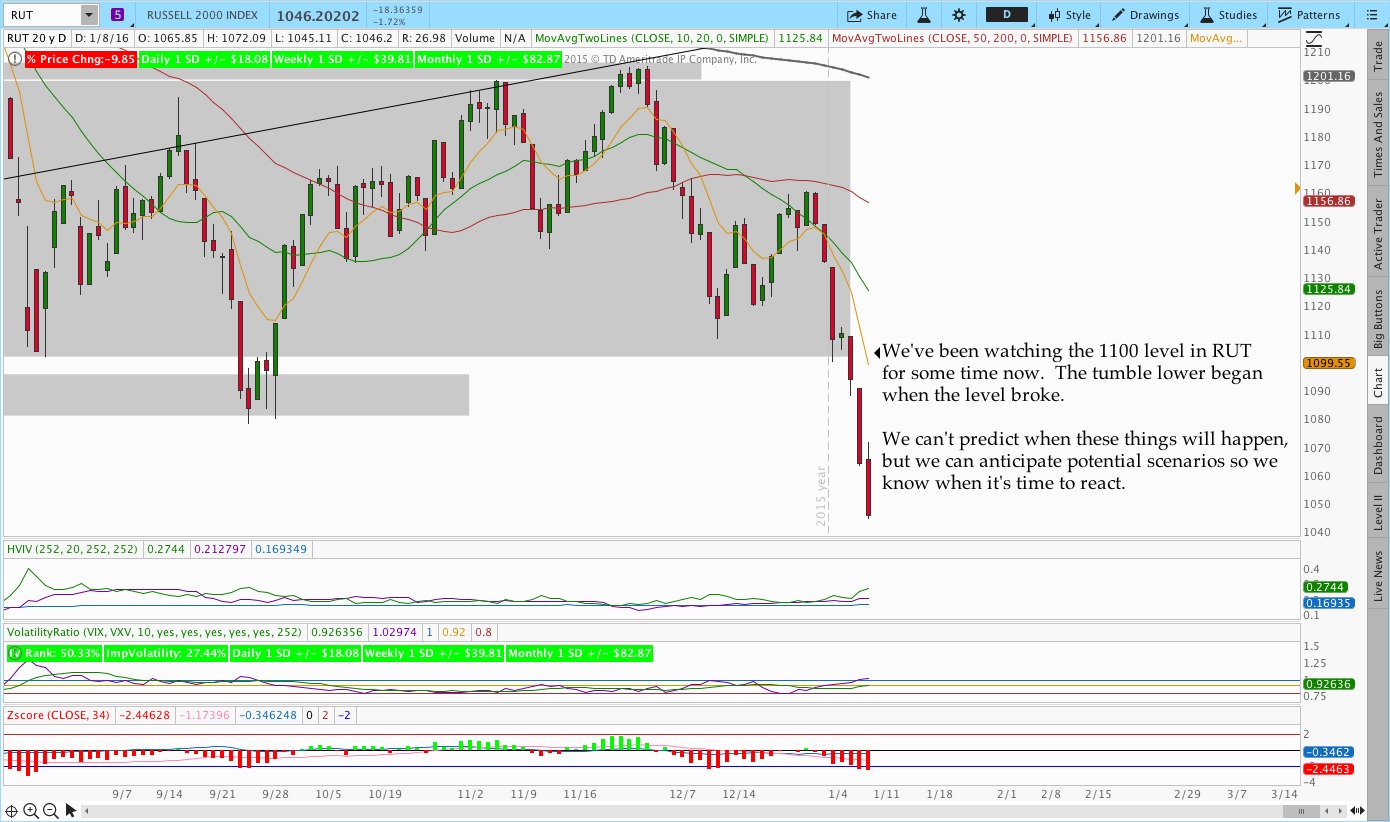
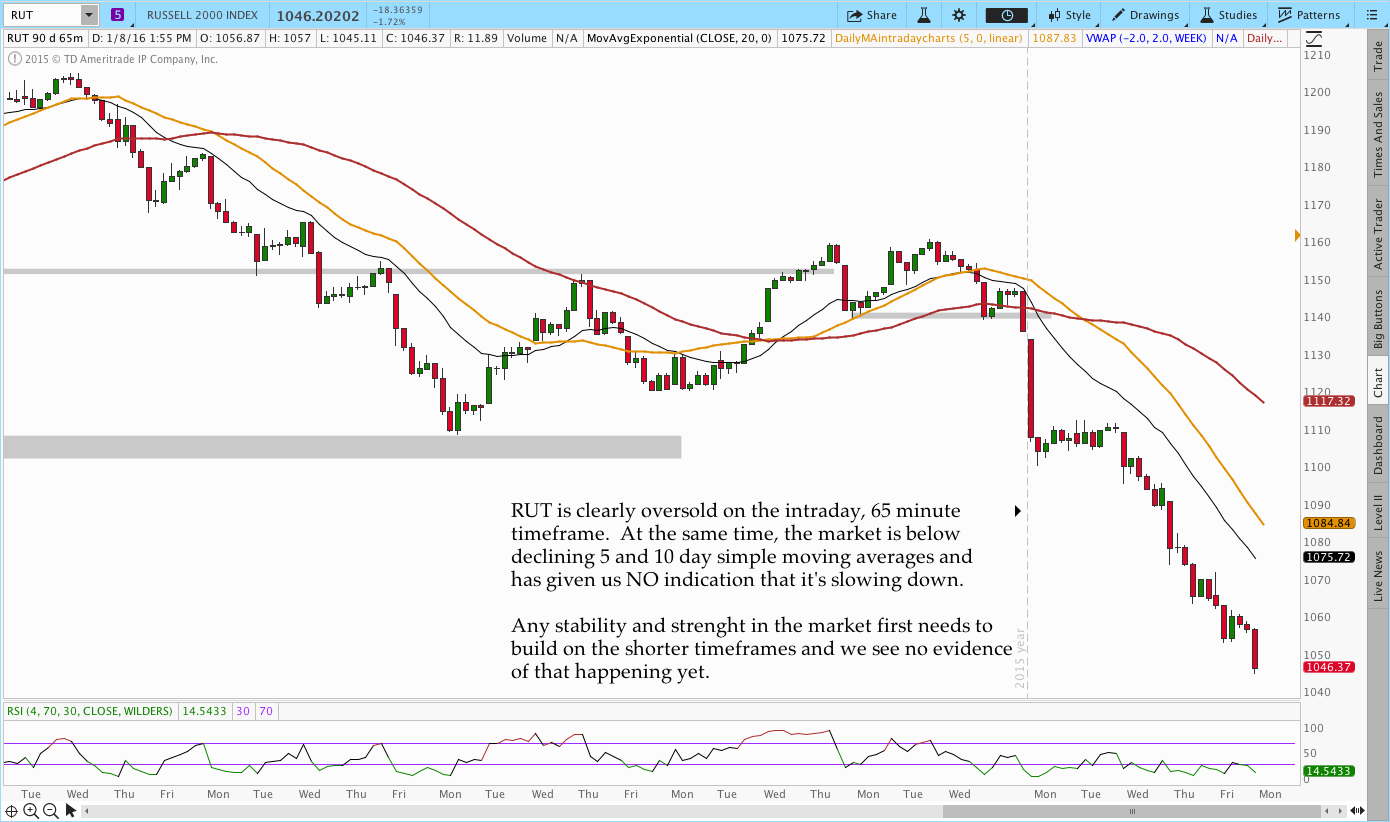
In the levels of interest section, we’re drilling down through some timeframes to see what’s happening in the markets. The analysis begins on a weekly chart, moves to a daily chart, and finishes with the intraday, 65 minute chart of the Russell 2000 ($RUT). Multiple timeframes from a high level create context for what’s happening in the market.
Live Trades . . .
The “Live Trades” section of the commentary focuses on actual trades that are in the Theta Trend account. The positions are provided for educational purposes only.
——————————
We have a tendency to make mistakes with our trades when we fail to recognize that the market environment has changed. We can’t expect the market to bounce immediately just because it’s oversold. This week I closed the CIB after making a Reverse Harvey adjustment to protect the upside.
If I had stayed in the Febraury CIB simply because I thought the market “should” bounce (and I did think it should bounce a bit), I would be sitting with a large loss. Instead, I walked away with a small gain. I closed the position when my adjustment point was hit and the market broke the 1100 area. The reason I watch levels is that fast moves tend to follow failed levels.
Do not hope the market will come back to help your positions. It’s an inanimate object so by definition it doesn’t and can’t care.
As far as what’s open right now, I’m pretty light on inventory. I have a couple of Broken Wing Butterflies, but they’re more experimental at this point. It’s unlikely that I’ll be putting on another CIB before March gets a little closer, but I am open to the possibility depending on what happens on Monday. For now, I feel okay sitting heavier in cash than usual.
The Results Spreadsheet will be updated in the next day or two. All of the trades mentioned there are actual trades that I’ve taken. There are no paper trades or fuzzy fills, they’re all real.
If you want to learn more about how I trade, check out the CIB Trading Course. The course covers my primary strategy in detail.
Looking ahead, etc.:
Monday and the early part of next will be critical for the markets. If the controlled move lower is simply that, we might see some stability. A panic gap is equally possible. Nobody knows.
This is a good time for non-directional traders to keep size small and trade conservatively. Protecting open positions is always our priority and the stakes are raised when volatility increases. There is no shame in taking a controlled loss to avoid a catastrophic one. Control risk and stay safe out there.
Please share this post if you enjoyed it.
Click here to follow me on Twitter.
Want to receive an alert as soon as the next market commentary is posted?

Sign up for my email list and stay up to date with the latest information on options trading.
Click here to sign up for the list, get a copy of the Theta Trend Options Trading System, the Trade Tacker I use, and information about new systems.
Even better . . . it’s all totally free.