Weekend Market Commentary 2/26/2016 – $RUT, $RVX, $SPX, $VIX, $VXV
Big Picture:
Quick Note: The March CIB was closed this week and the April trade was opened. You can read a review of the March trade here and/or follow the daily updates for the April trade here. I’m updating the live page on a daily basis with video and written comments.
—————————–
In the markets and trading, it’s easy to drift on a day to day basis without direction. What was the last time you sat down with yourself and deeply questioned what you’re trying to accomplish in trading? I won’t tell you what to do, but sincerely asking yourself that question might be insightful.
The interesting thing about trading is that once it begins to make sense or “click” it becomes relatively simple. Sure, there’s the process of constant improvement, but once something is working it becomes easier to duplicate. The challenge is that getting to that point takes time and there’s not a clearly defined road map to get there because everyone is different. Ultimately, successful trading requires an understanding of yourself and the development of a strategy or strategies that fit your personality. There are no short cuts.
To complicate things further, trading is one of the few areas where people believe a small amount of knowledge or simplicity will immediately make them money. As a result, they tend to seek out overly simplistic advice and guru’s who make the process seem easy. I’m not advocating complexity, I’m just making an observation.
Successful traders synthesize multiple disciplines, styles, and types of information in a way that makes sense for them. There are always common themes, but the common themes are less important than the personalized synthesis. However, successful synthesis requires exposure to multiple ideas, an understanding of self, and an insatiable desire to learn and improve.
It recently came to my attention that those catchy picture with words on them are called “memes.” Let’s be very clear about something . . . just because a site puts together a bunch of catchy memes and has a large following does not mean that they trade successfully. I recognize that intuitively we all know this, but there’s still a significant amount of attention being paid to simplistic advice that won’t lead to successful trading.
One of the historically great traders, Ed Seykota, says that everyone gets what they want out of markets. My belief is that the success of memes is due to people’s desire for successful trading to be simple, quick, and easy.
My goal in the markets has always been and continues to be successful trading. As a result, I seek to associate with other successful traders. When I visit a site or talk to a trader one of the first things I look for is a track record of some sort. If I was looking for entertainment, I’d look for the best memes. The reality is that all of those pretty sites with catchy memes don’t matter as much as true results. In order for someone to help you improve your trading, it helps if they’ve been able to demonstrate success. Catchy memes with quotes from famous traders and a large audience are not indicators of success.
On to the markets . . .
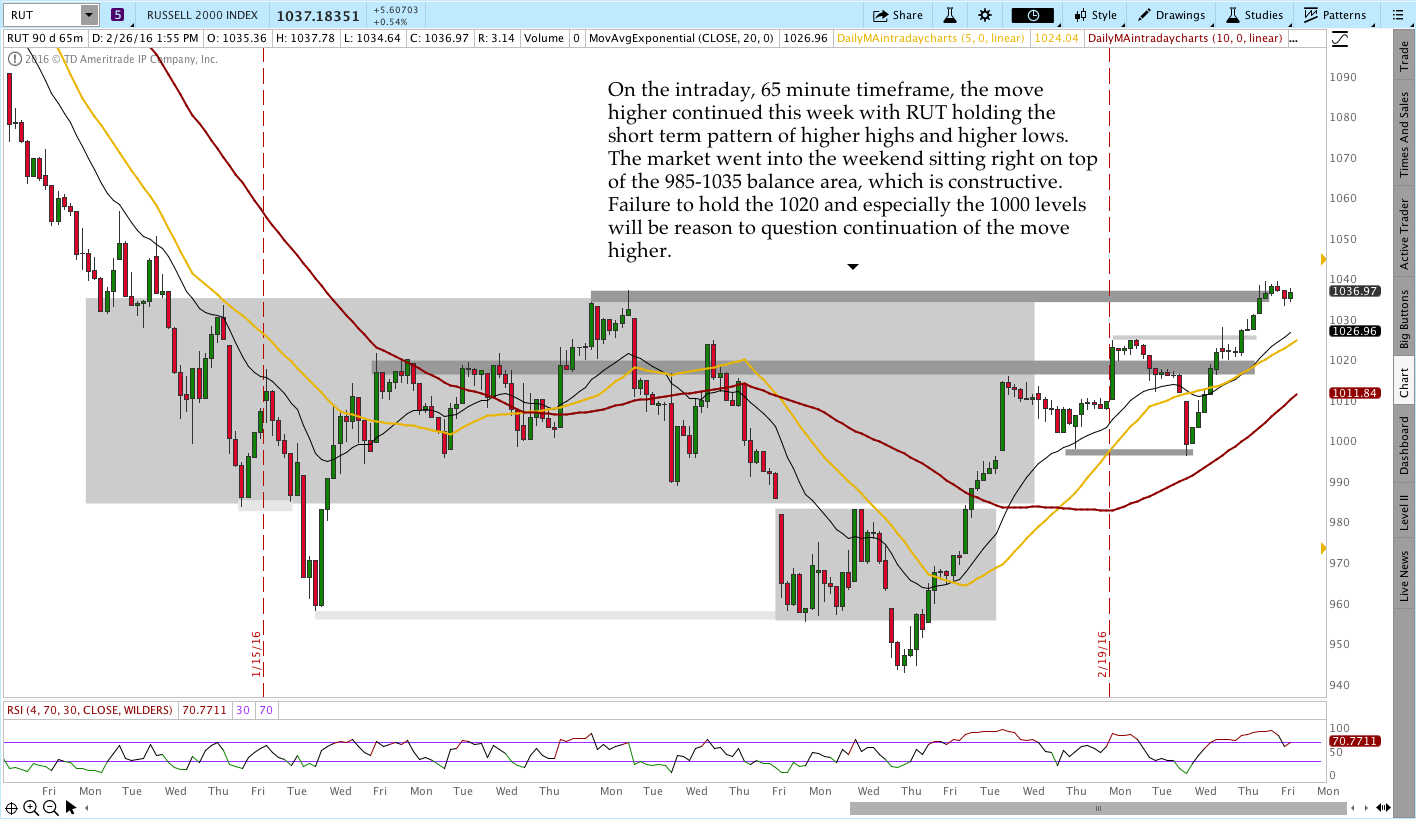
The intraday price action this week was mostly choppy and slow. With the exception of Wednesday, the market has had a series of gaps higher without a lot of continuation or heavy intraday buying. That type of price action gives us reason to question the strength of the rally, but it doesn’t tell us anything about the timing of if or when it might fail. We look at multiple timeframes to get a sense for what the market is doing, but our job as non-directional traders is to react to the market rather than predict.
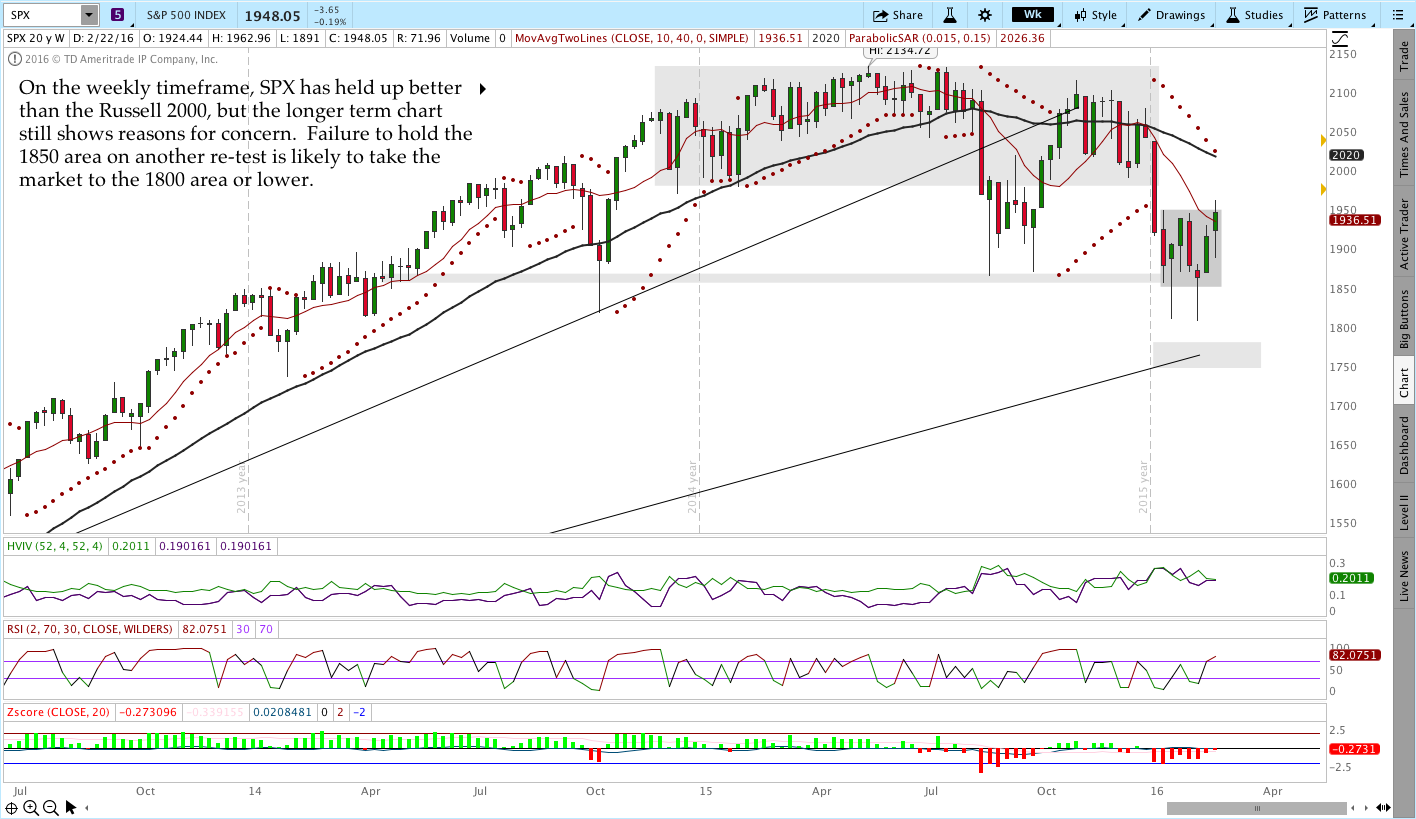
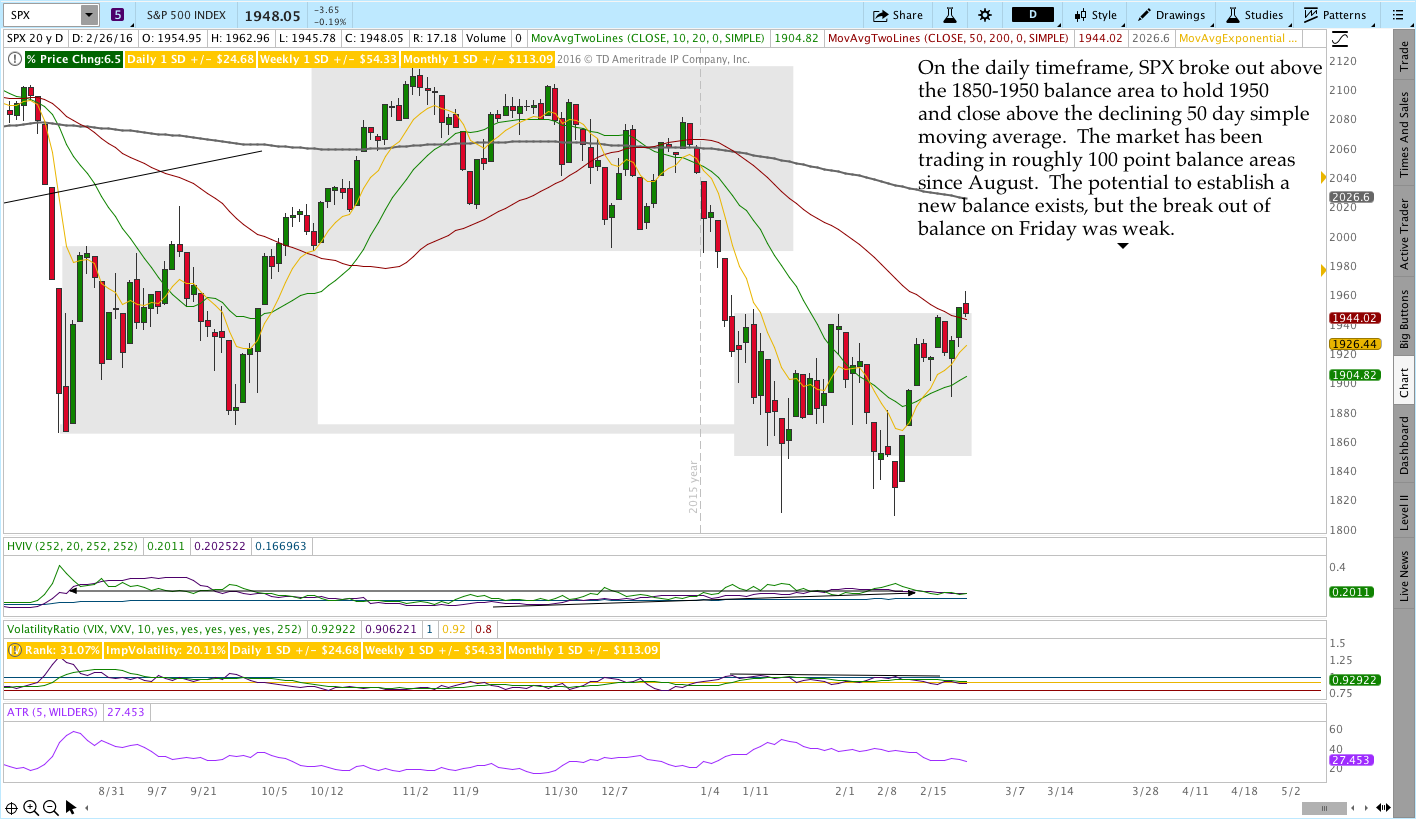
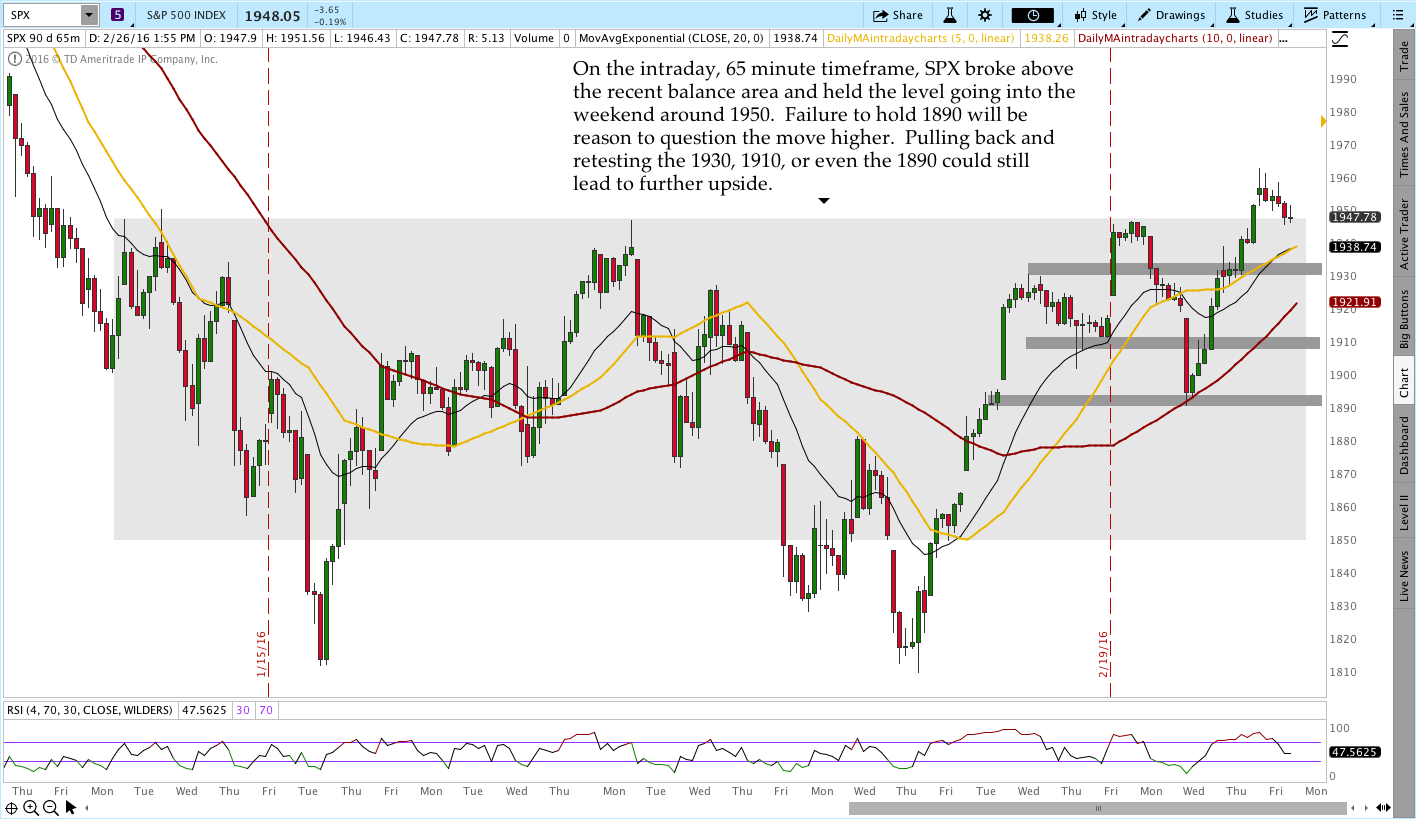
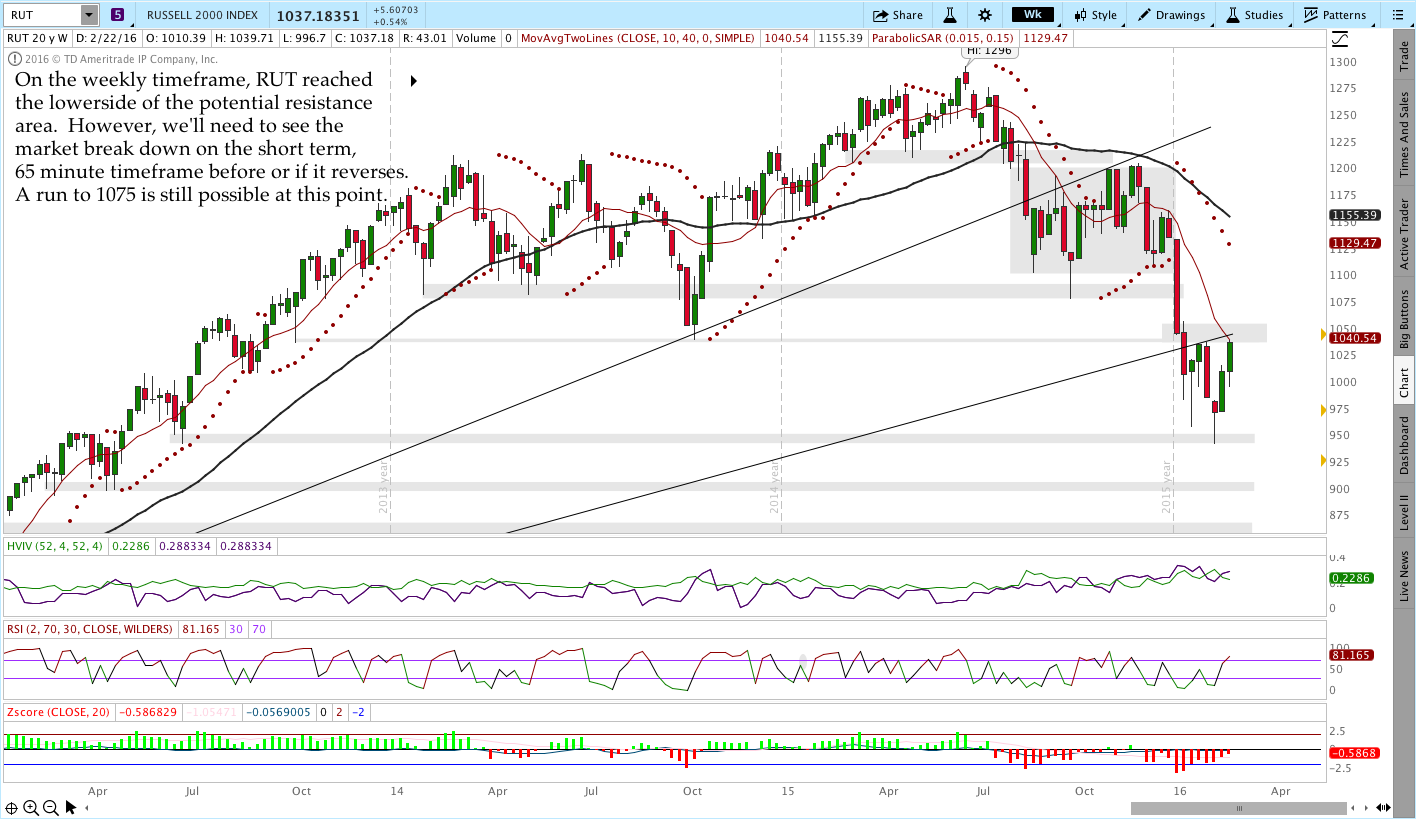
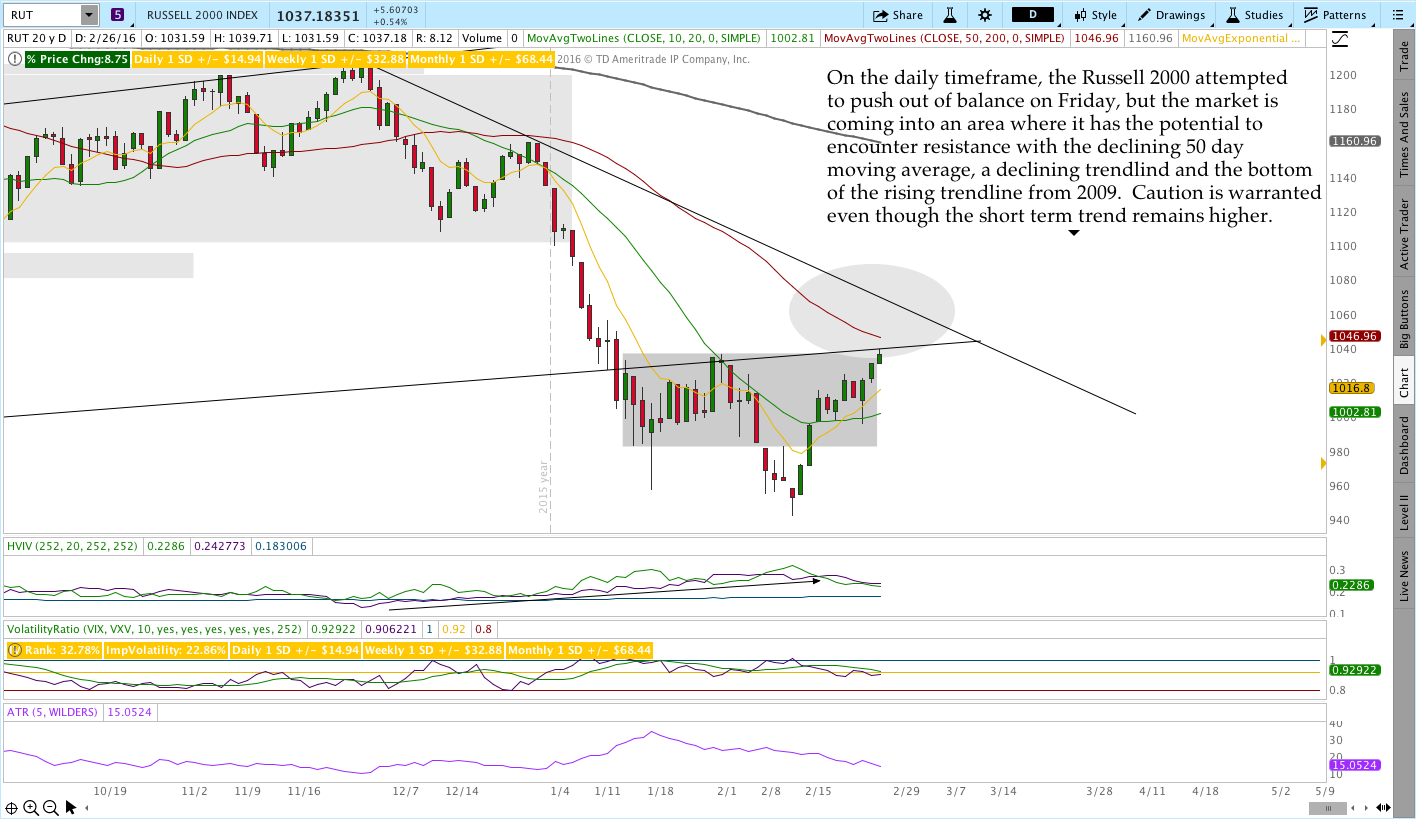
The longer term trend in the markets remains bearish with a shorter term positive trend. We look to the weekly and daily charts for a sense of longer term direction and pay close attention to the 65 minute chart for an idea of what might play out in the next week or two. Right now the shorter term trend remains positive and the market has not given us any reason to expect a reversal. That environment will continue until it changes and “resistance” on the longer term charts is only potential resistance until after the fact.
Sadly the most obvious reason to question the broader negative picture is that the recent rally seems very disliked. I’d feel more confident in the decline if the sentiment seemed more bullish.
Volatility:
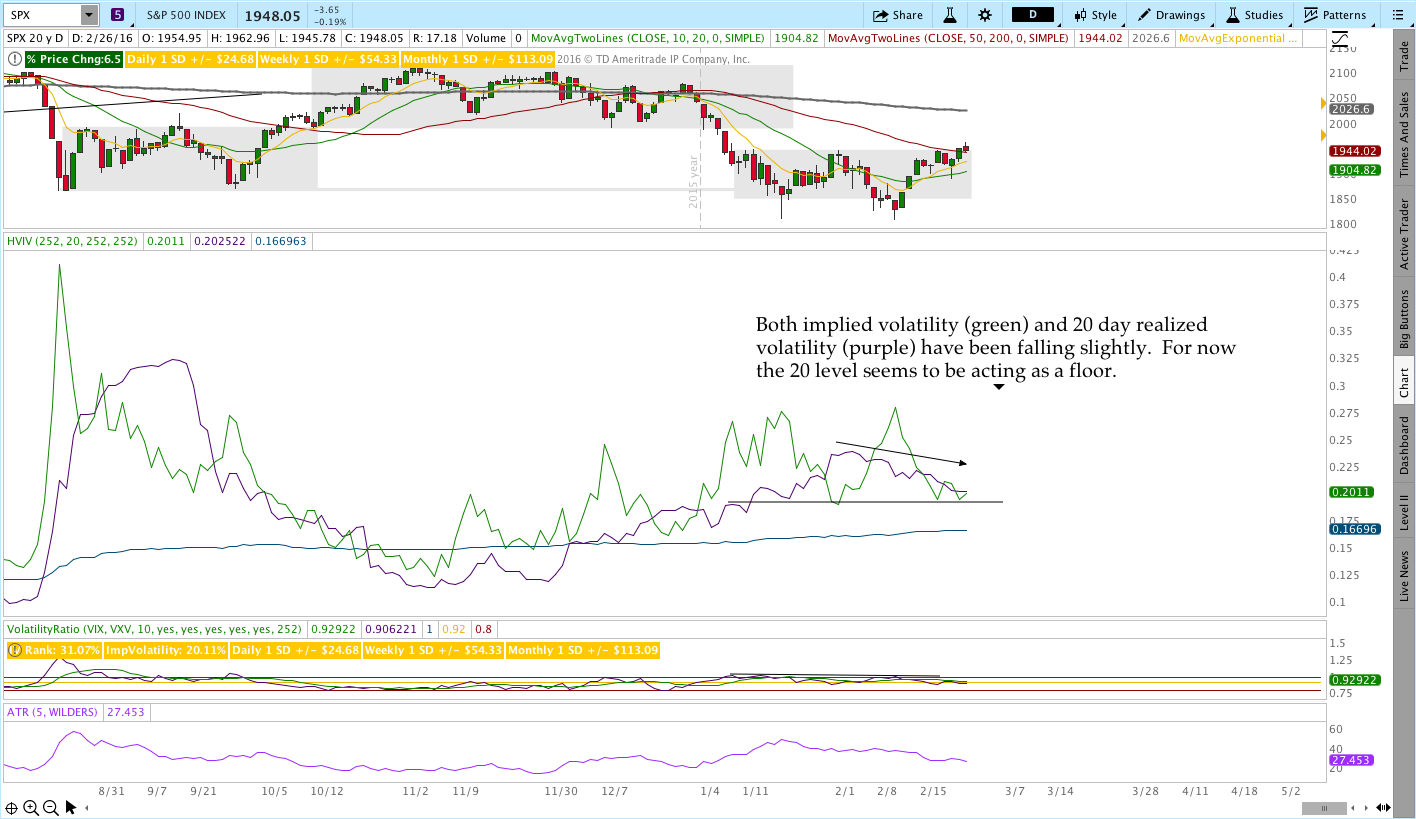
Volatility has been reluctantly heading lower and seems to be validating what we’re seeing in price. Specifically, the market has been displaying some short term strength within the context of a primary downtrend and volatility has come off from a state of concern to caution. We haven’t seen any sort of panic in 2016 and volatility has validated that all year.
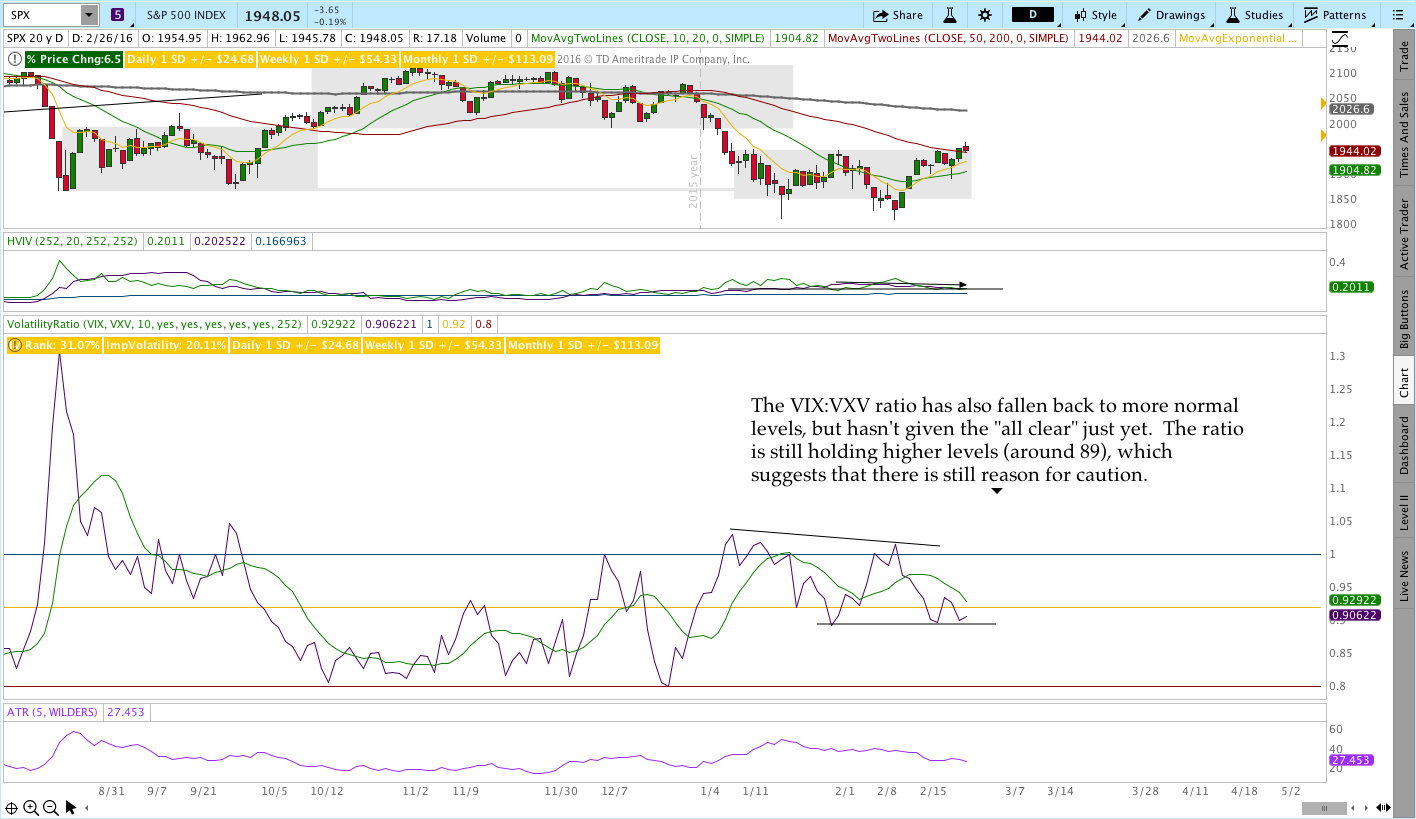
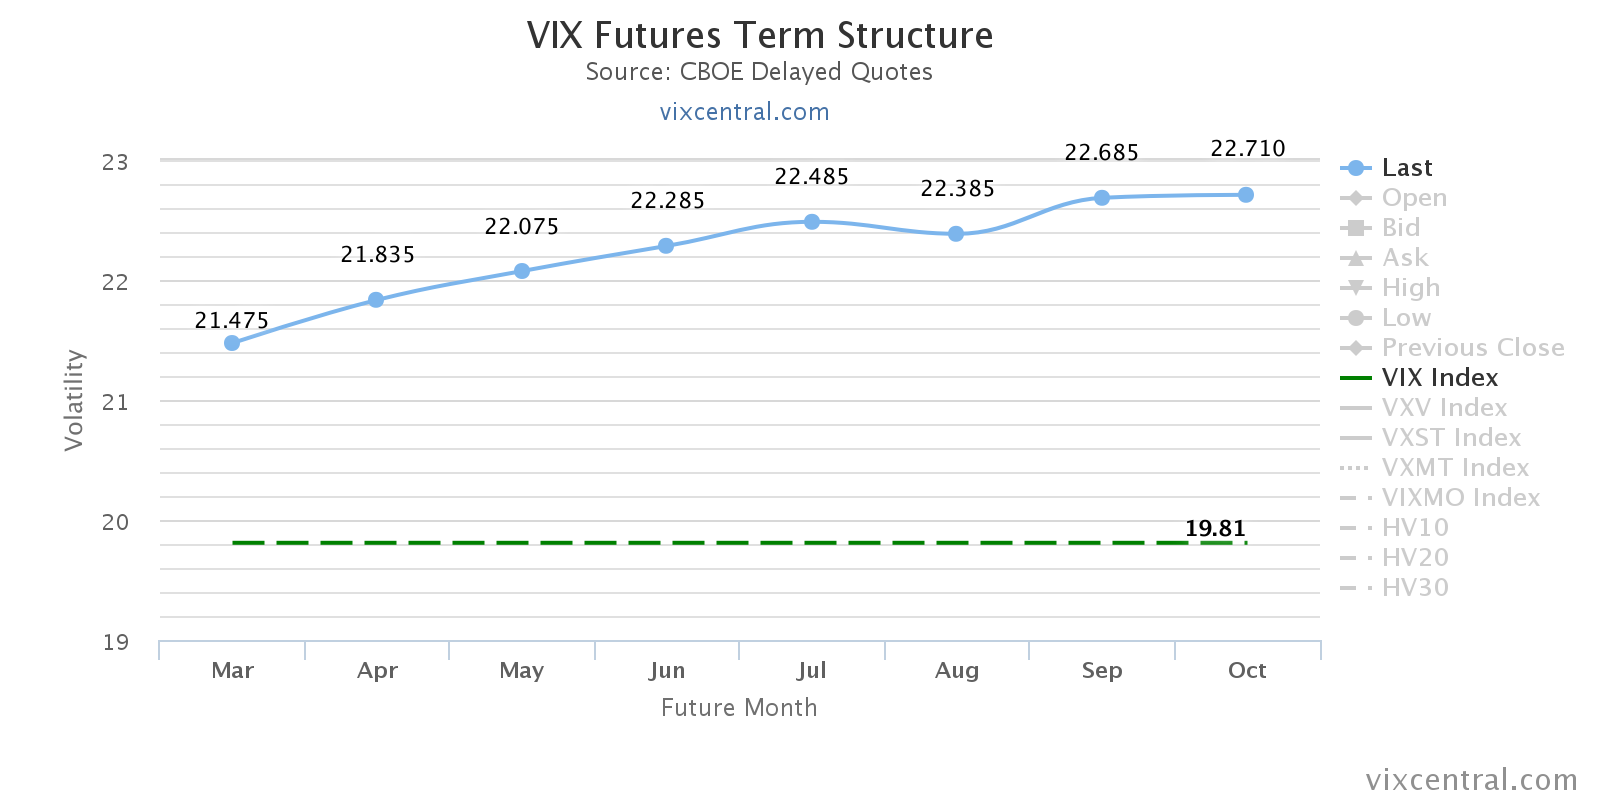
The VIX Futures curve remained in Contango this week. The curve steepened slightly from last week as the market moved higher.
Market Stats:
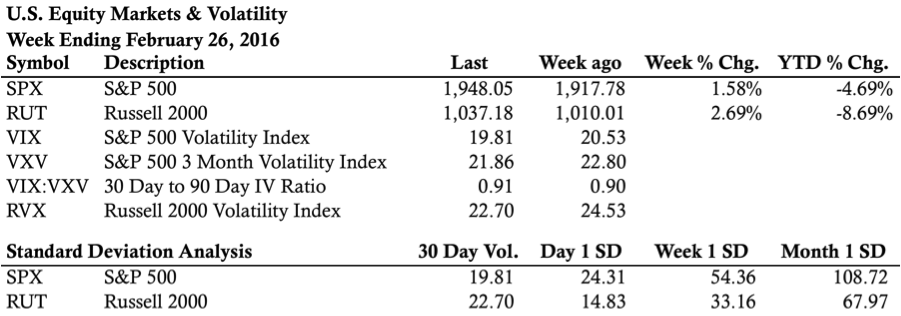
Levels of Interest:
In the levels of interest section, we’re drilling down through some timeframes to see what’s happening in the markets. The analysis begins on a weekly chart, moves to a daily chart, and finishes with the intraday, 65 minute chart of the S&P 500 (SPX) and the Russell 2000 ($RUT). Multiple timeframes from a high level create context for what’s happening in the market.
S&P 500 – $SPX (Weekly, Daily, and 65 Minute Charts):
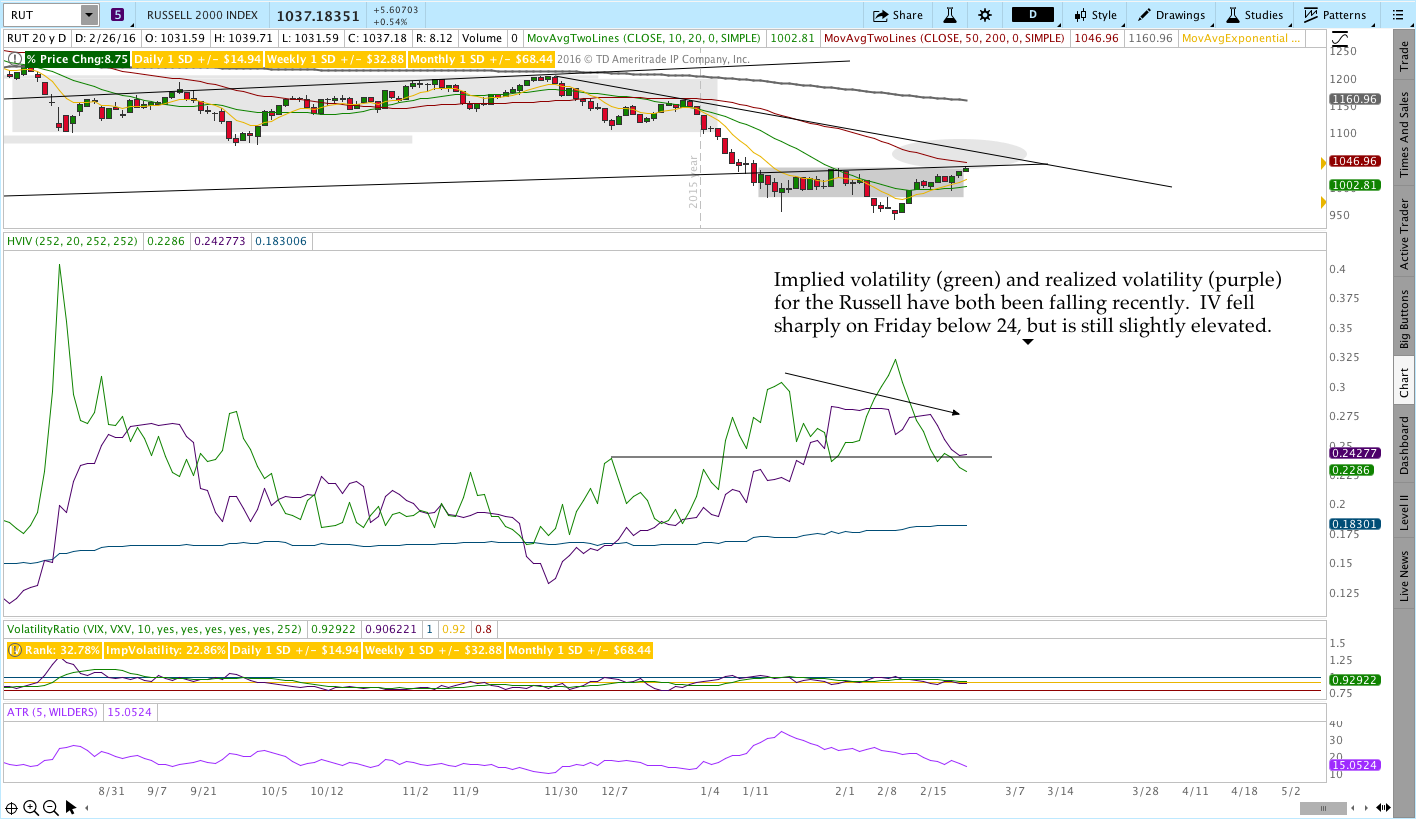
Russell 2000 – $RUT (Weekly, Daily, and 65 Minute Charts):
Live Trades . . .
The “Live Trades” section of the commentary focuses on actual trades that are in the Theta Trend account. The positions are provided for educational purposes only.
——————————
The March 2016 CIB was closed for a roughly 2% gain this week and you can read a review of that trade here.
The April CIB is open and moving along. I do like the location of this trade relative to the recent uptrend and the position has a good amount of room on the downside. The Live Trade Page for the position is being updated daily with video and comments if you want to follow along in real time.
If you want to learn a safer, less painful way to trade options for income, check out the Core Income Butterfly Trading Course.
April 2016 Core Income Butterfly Trade:
The Results Spreadsheet is up to date. All of the trades mentioned there are actual trades that I’ve taken. There are no paper trades or fuzzy fills, they’re all real.
Looking ahead, etc.:
The markets have seemed almost a little sleepy lately and that can change at any time. I’m actually short term bullish right now with the market holding higher levels on the intraday timeframe, but that opinion is always subject to change with new information.
Have a great weekend and please share this post if you enjoyed it.
Click here to follow me on Twitter.
Want to receive an alert as soon as the next market commentary is posted?

Sign up for my email list and stay up to date with the latest information on options trading.
Click here to sign up for the list, get a copy of the Theta Trend Options Trading System, the Trade Tacker I use, and information about new systems.
Even better . . . it’s all totally free.