Trade Review – $RUT March 2016 Core Income Butterfly Options Trade
Overview:
The March 2016 CIB was closed on February 24, 2016 for around the target gain ($407 Gross, $248 Net, or a roughly 2% return on the sample account). The position was publicly tracked on a daily basis with live video, written comments, and a tracking spreadsheet. In other words, I’m not sugar coating the outcome, backtesting to optimize the trade, or cherry picking a good winning trade. Frankly, this month was ugly and the trade was presented in real time with real money. On some days the position was up money and on others it wasn’t. My goal is to be as transparent as possible while helping you understand what it really feels like to trade a non-directional strategy on a day to day basis.
Click here to access the Live Trade Page for the March position.
I’m also tracking the April trade live and that page can be found here.
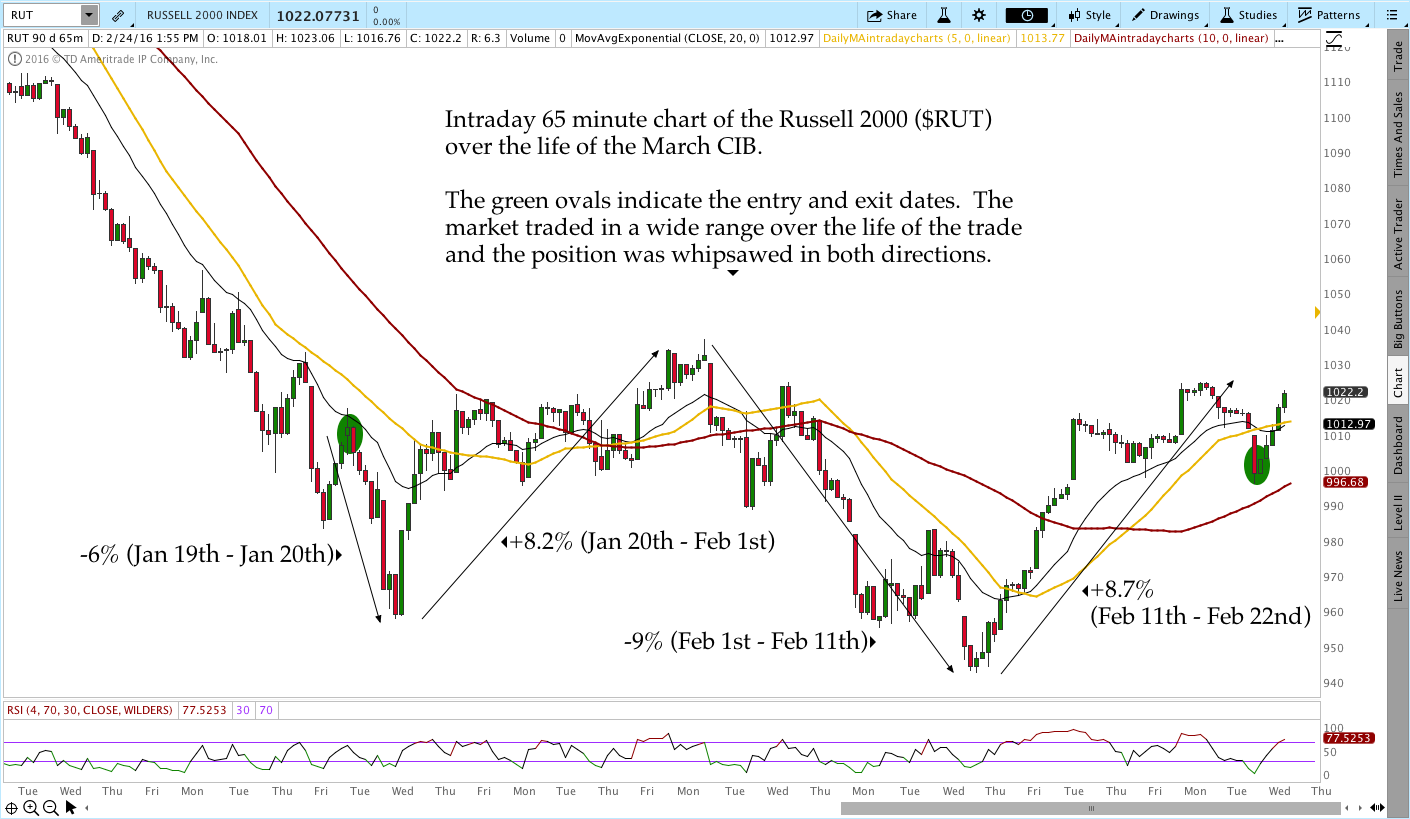
The Russell 2000 traded in a wide range over the life of the trade, which made managing the position more challenging. Despite being whipsawed in both directions, the trade never reached an unreasonable open loss and we were able to control our directional risk in the position. Specifically, the maximum heat or open loss on the position peaked at around -$172. Many options traders will sell options that take a significant amount of heat for a small gain. The CIB seeks to take less heat with the potential for a larger gain.
Due to the large range, I made a few adjustments that proved to be unnecessary. For example, I adjusted lower only to see price reverse and head higher. After that, I adjusted higher only to see price head lower. I then made another downside adjustment before the market headed higher again. Even though the adjustments proved to be unnecessary, not making the adjustments would have led to a broken trade if the market had continued.
Trading is not about being right, it’s about making positive expectancy decisions. Sometimes those decisions will be “right” for the market environment and at other times they’ll prove to be wrong. Just because a trade or adjustment lost money does not mean that it was the wrong trade.
Click here to read about the CIB Trading Course that covers this strategy in detail.
Initiation:
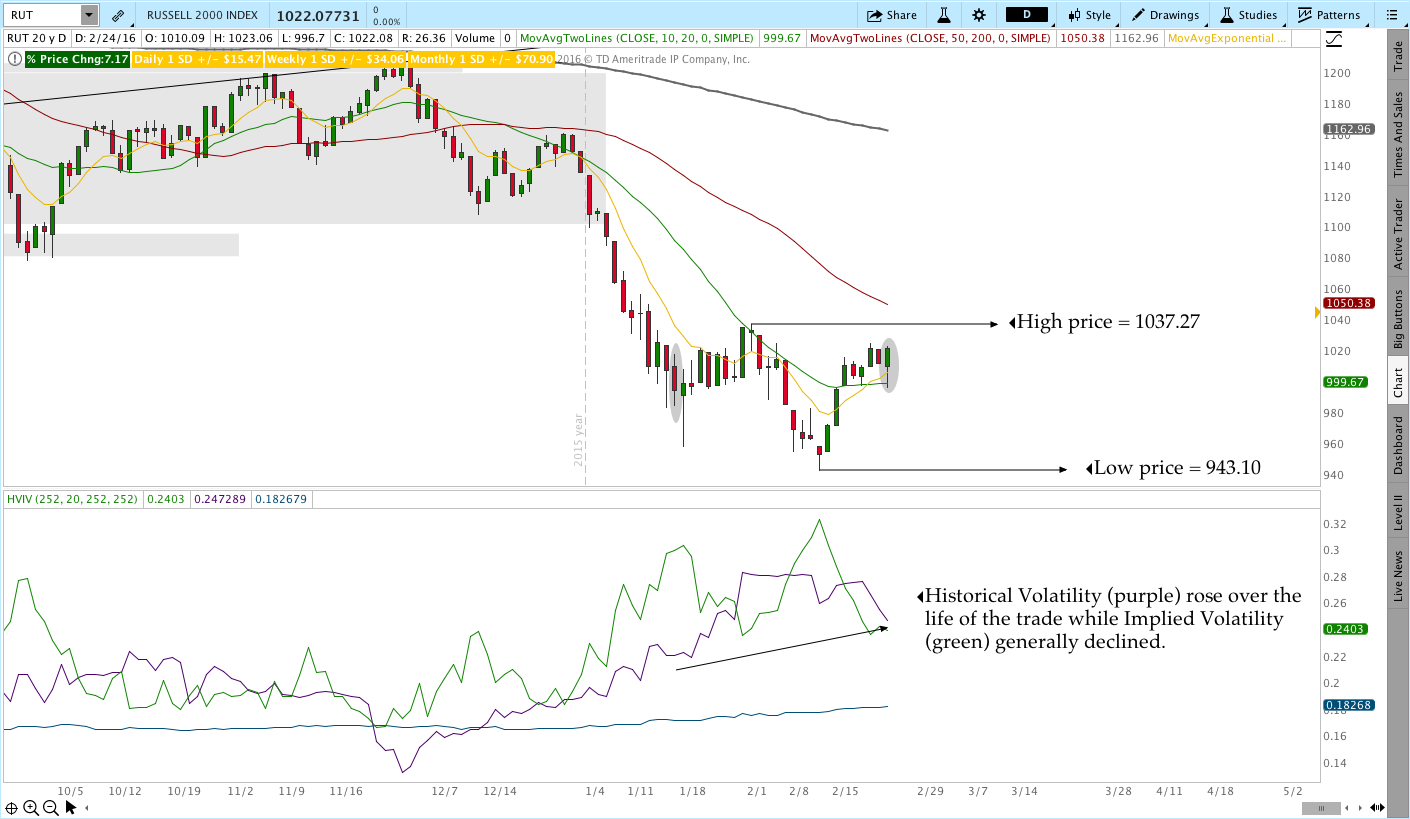
The trade was initiated on January 19, 2016 with RUT trading around 1009. At the time of entry, the market had been selling off steadily and wasn’t showing any signs of stabilizing. Implied volatility was relatively high at entry and the initial position was put on fairly cheaply.
Daily Chart:
Intraday Chart:
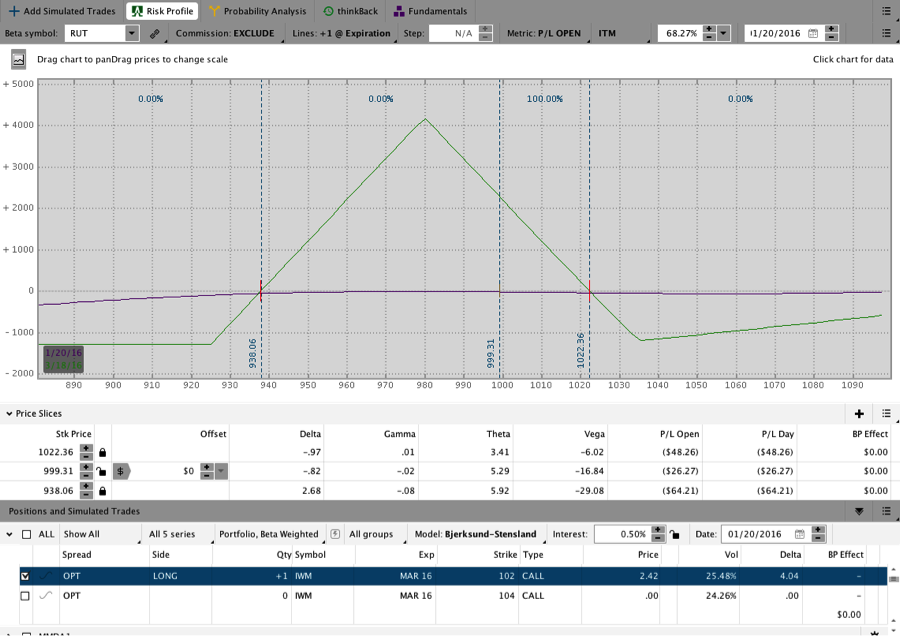
Initial Trade:
The initial trade was entered January 20, 2016 with RUT around 1009. At the end of the first day, RUT had sold off around 1.5% from the entry price and the T+Zero line was becoming a little long Delta. The downside adjustment point for the position was around 965-975.
Adjustment #1:
The following day RUT sold off considerably intraday and the trade was rolled from 1000 down to 980. The roll gave the position more room on the downside, but by the end of the day the market was heading higher. The loss on the roll itself was negligible (around $7 including commissions). Generally when the position is rolled lower the result is a small gain or a scratch on the original position.
Adjustment #2:
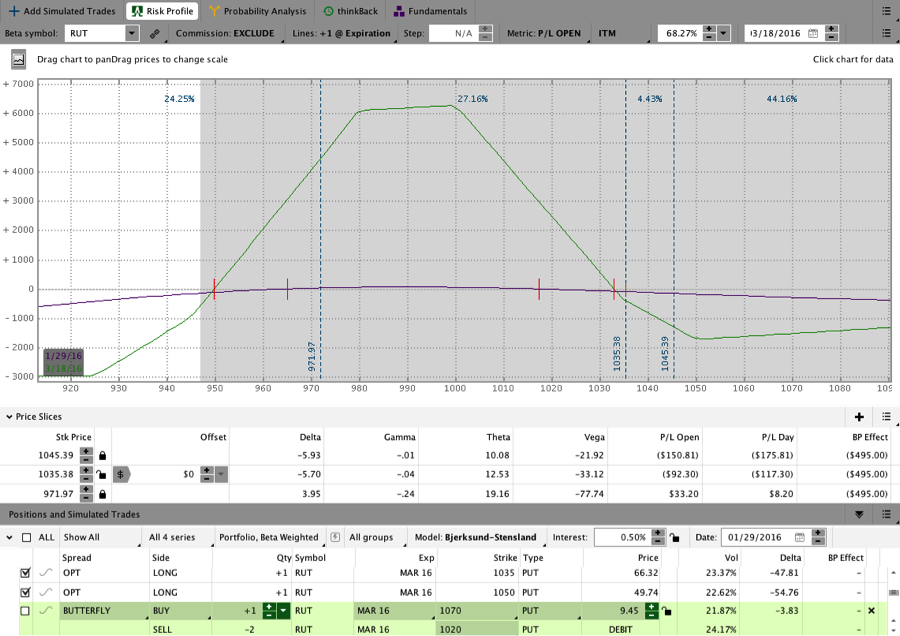
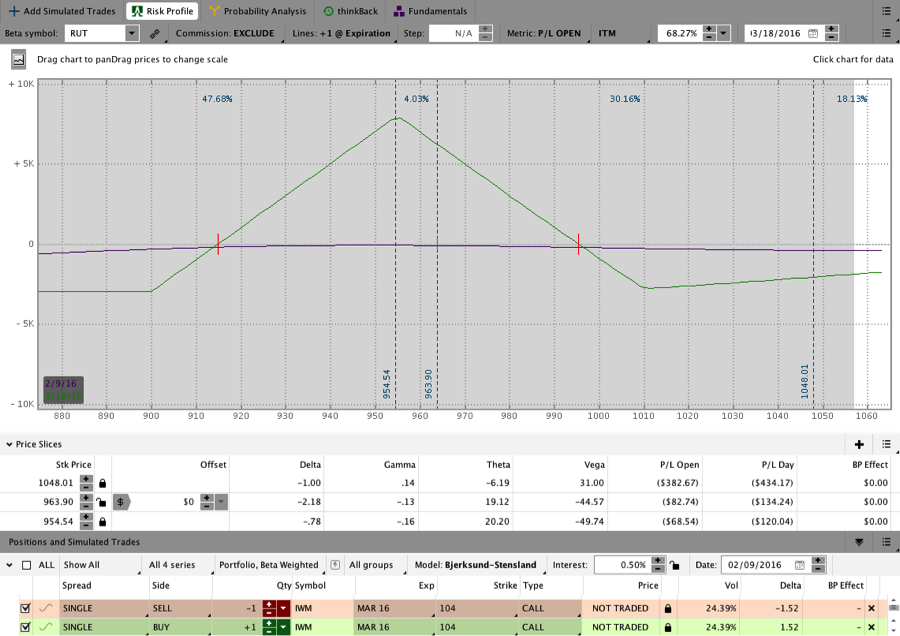
The market continued higher after rolling down and about a week later it was time to add on the upside. The resulting position after adding the second butterfly and long call is shown below. As you can see from the price slices, the market closed outside of the butterfly on the upside following the upside adjustment. At this point, the trade was made up of Put Butterflies centered at the 980 and 1000 strikes.
Adjustment #3:
The market continued higher and a couple of days later a third Butterfly was added at 1020. The resulting position is shown below.
Adjustment#4:
Just a couple of days after adding the third Butterfly on the upside, the market fell from 1035 to 985 leaving price in the lower part of the position. While I didn’t get the adjustment entered in time, the appropriate adjustment would have been to take off the upper 1020 centered Butterfly.
Adjustment #5:
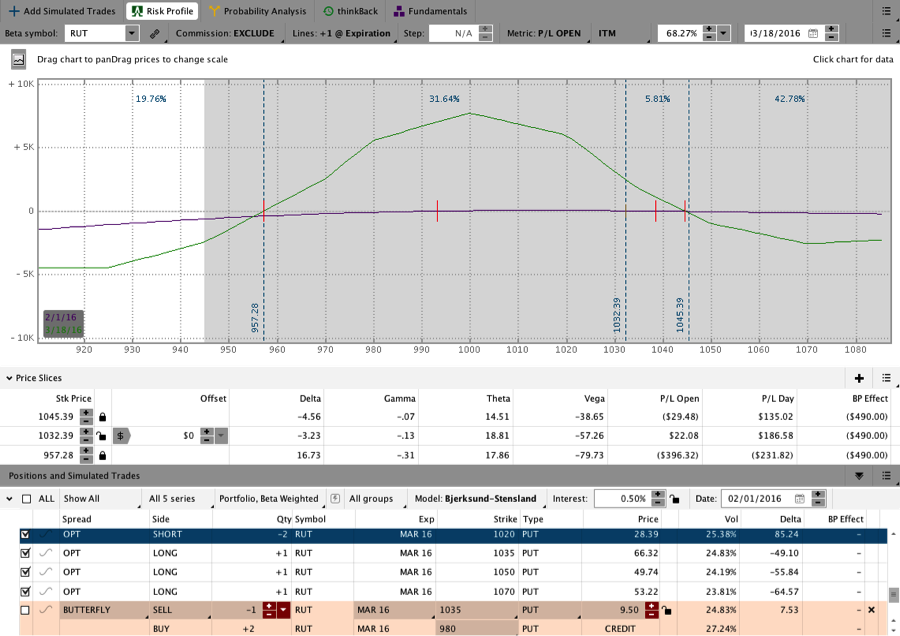
A day or two following the drop, RUT continued lower and I closed out the upper two Butterflies. The resulting position is shown below. Despite being whipped around quite a bit in the trade the open loss at this point was only around $79 (not including commissions).
Adjustment #6:
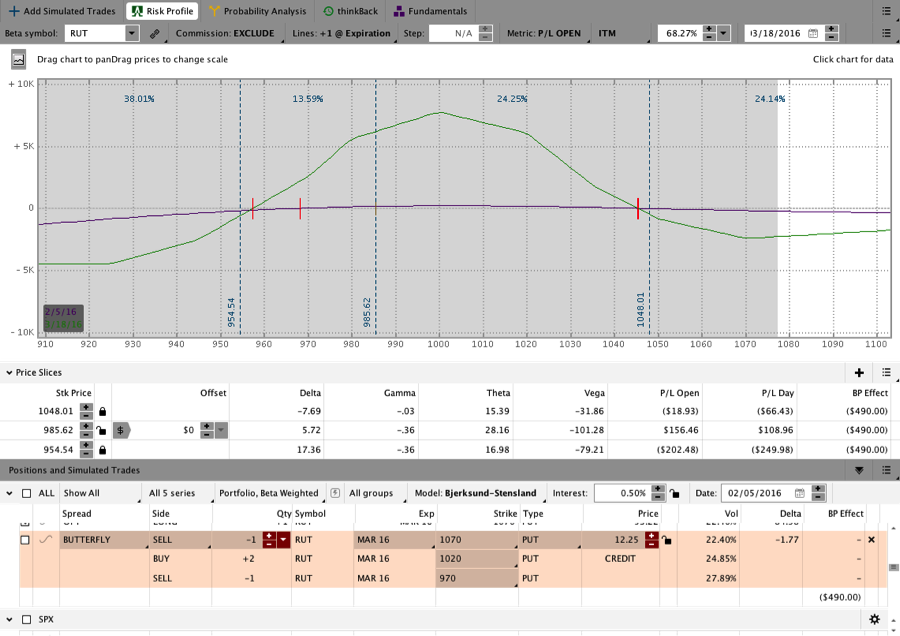
The day after closing the two upper Butterflies, RUT tumbled even lower and hit 942 on an intraday basis. I rolled the 980 Butterfly back and centered the new position at 955. Rather than using a single Butterfly I went with two Butterflies and was sitting with an open loss of around -$82. At this point in the trade, the market had broken below previous lows on the daily timeframe and it seemed possible that the downtrend would continue. The market headed sharply higher instead.
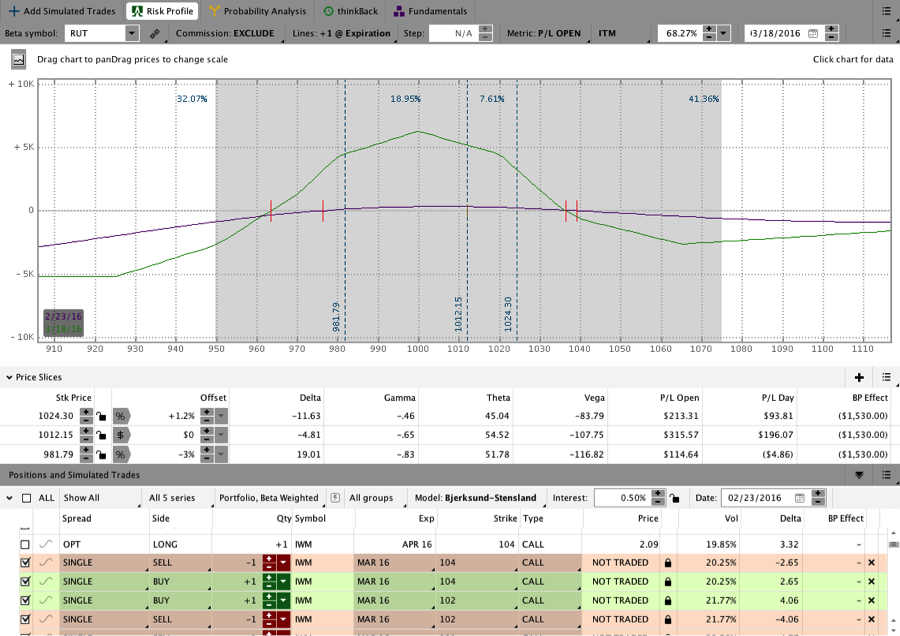
Adjustment #7:
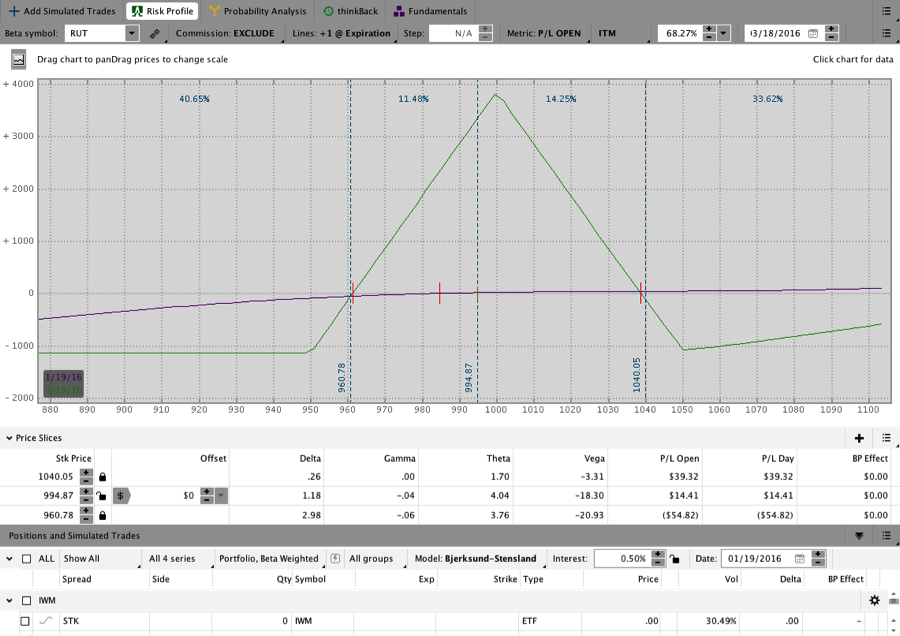
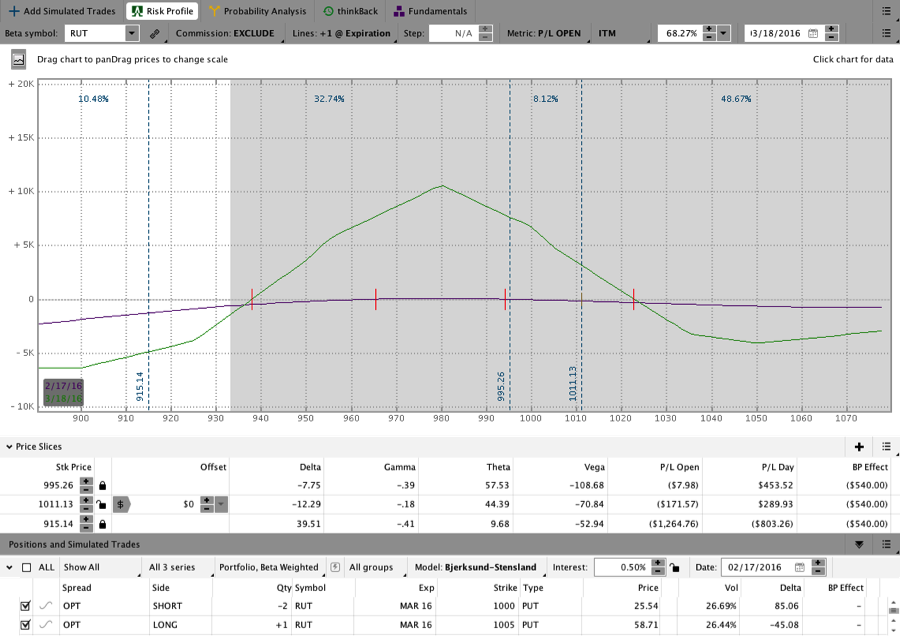
About a week after rolling down to 955, RUT was charging higher yet again and I added two Butterflies at 980. On an intraday basis that wasn’t enough so I sold out one of the 955 flies and moved it up to 1000. The market was moving higher fast. The image below shows the position on the day of the maximum drawdown, which was around -$172. Even though the trade was down money, the T+Zero line was still relatively safe and the position really just needed the market to stabilize so the trade could decay.
Adjustment #8:
A couple of days later the market seemed like it might continue higher and I used an intraday pullback as an opportunity to roll down one of the upper long puts. That adjustment flattened out the T+Zero line to guard against a potential move higher. Note that just two days after taking max heat the trade was up money.
Adjustment #9:
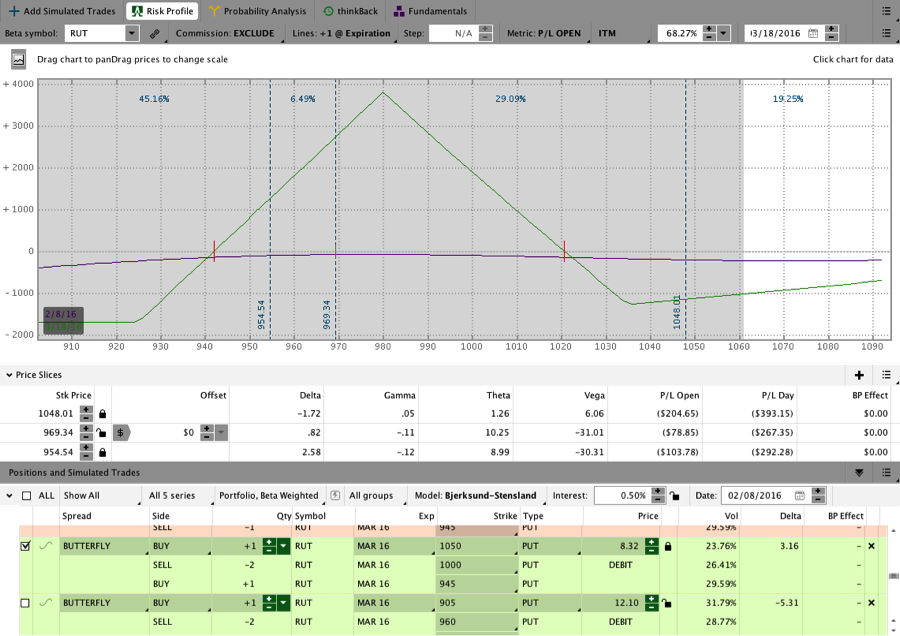
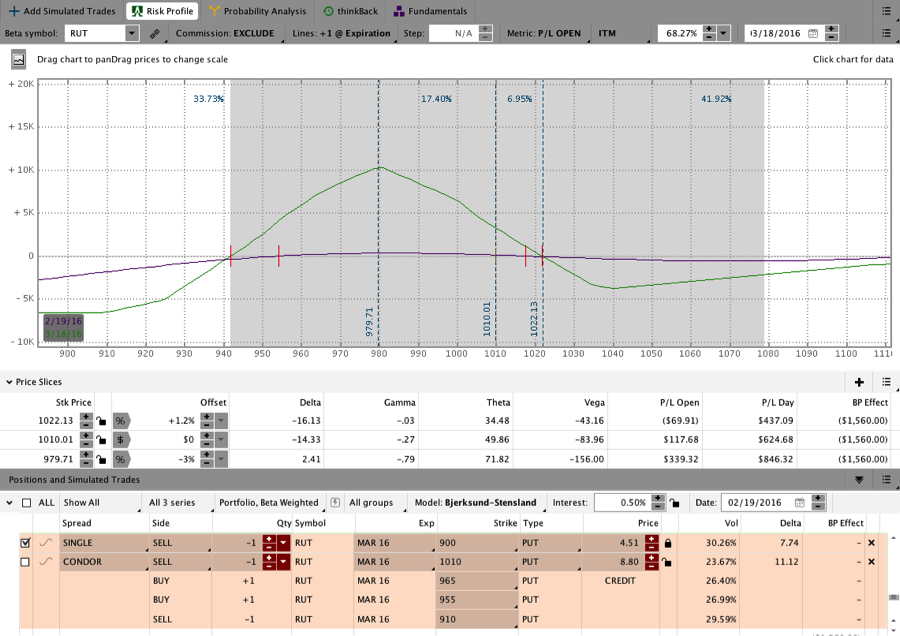
Even though it seemed like the market “should” stop, RUT continued higher yet again and I adjusted by closing out the remaining 955 Butterfly and opened a new broken wing butterfly centered at 1020. The adjustment gave the trade room to run on the upside and lifted the tent closer to where the market was sitting so the decay would increase. My goal at this point was to get up enough money to close the trade.
Before the close:
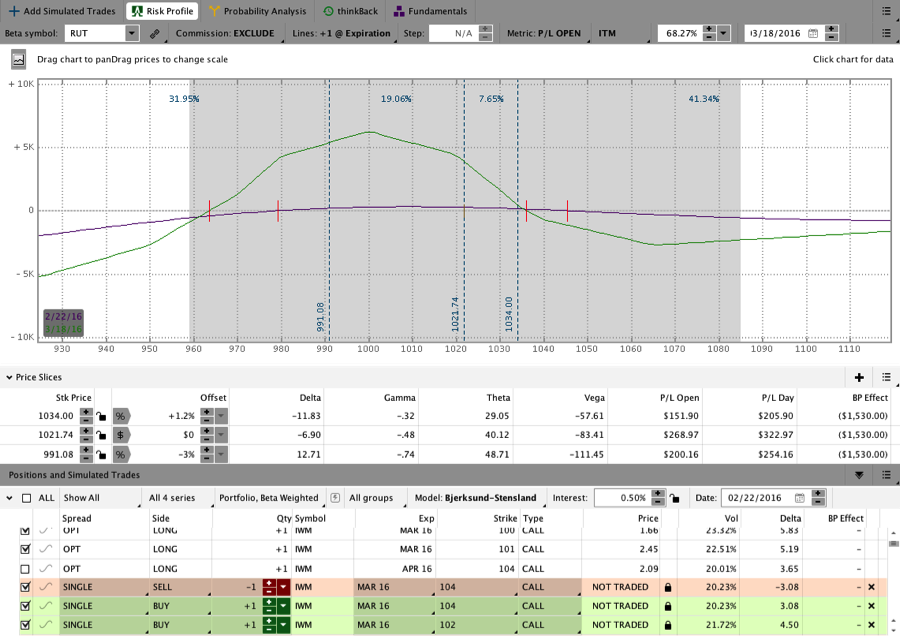
The image below was taken the night prior to the close. The following morning RUT opened around 1000, which was the high point on the T+Zero line (the sweet spot) and the trade was up money. Since the position was inside of 30 DTE and it had been a challenging cycle I simply closed the position rather than letting it run longer.
Lessons:
Managing the CIB this month required more involvement than usual and there were some good lessons. Fortunately, we can both go back and watch the daily videos to see how the trade played out.
Over the life of the trade the position was adjusted due to large intraday moves that ultimately reversed. As a result, some of the whipsaws were due to a more cautious adjustment process. Had I been a little slower to adjust, some of the adjustments might not have been made. That being said, I’m a relatively cautious guy and my preference is to adjust sooner rather than later because I strive to keep the heat on positions as low as possible. My focus is on minimizing risk, which we can control, rather than making money.
In a high volatility environment, the biggest risk for the position is price. Since high realized volatility is generally accompanied by high implied volatility, Butterflies are relatively inexpensive when volatility is high. One of the big lessons from this cycle is that it may be better to start the CIB with fewer DTE in a higher volatility environment to minimize time in the market and potential price risk. Starting later allows us to achieve the recommended risk:reward for the initial position while reducing exposure time. Going forward I’m going to be starting the CIB closer to 50 DTE when the market is volatile. The April trade was started with 53 DTE vs. 59 DTE for the March trade.
One of the big lessons in this cycle is that even if I make the wrong adjustment in the context of the market, the trade can adapt. In this cycle, I made several of the “wrong” adjustments from a price standpoint. The real cost for those adjustments was more time in the trade and a higher commission cost than usual. The trade remained within the risk guidelines at all times and the position never got out of control.
The Core Income Butterfly is a consistent options income strategy that is designed to take minimal heat with the potential for large returns. Click here for the CIB Trading Course covers the strategy in detail.
The link below takes you to the spreadsheet for the March and April trades where you can see the Greeks for the position on a daily basis including the open profit/loss. There are multiple tabs and the daily Greeks are below the order list.
Want to receive an alert when new content is posted?

Sign up for my email list and stay up to date with the latest information on options trading.
Click here to sign up for the list, get a copy of the Theta Trend Options Trading System, the Trade Tacker I use, and information about new systems.
Even better . . . it’s all totally free.