Live Trade With Daily Updates – April 2016 Core Income Butterfly
The March trade was closed on 2/24/2016 for a 2.04% net gain on total capital. The Live Trade Page for the March trade is located here.
Overview:
This post tracks the progress of the April 2016 CIB Trade and is updated daily. As always, the information is being presented for educational purposes only and this is not a recommendation to take a trade.
Additional Information on the CIB can be found here and here and the premium course that covers the trade in detail is available here.
I do my best to Tweet trades as they take place and you can click here to follow me on Twitter.
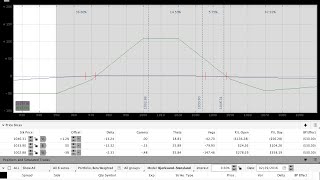
Position Greeks and Order Details (updated daily after the close):
Click here to view the full spreadsheet in another window/tab. Note that the spreadsheet has multiple tabs for previously closed trades.
Daily Market and Trade Update Videos:
Videos are uploaded daily by 6 p.m. EST.
-
-
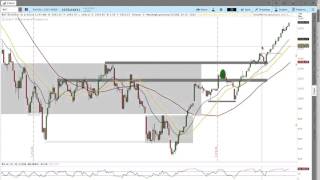
3/3/2016 $RUT Options Income Trading Daily Video
-
9
-
-
-
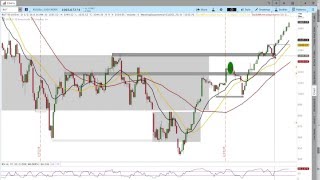
3/2/2016 $RUT Options Income Trading Daily Video
-
9
-
-
-
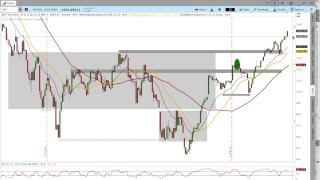
3/1/2016 $RUT Options Income Trading Daily Video
-
9
-
-
-
2/29/2016 $RUT Options Income Trading Daily Video
-
9
-
-
-
2/26/2016 RUT Options Income Trading Daily Video
-
9
-
-
-
2/25/2016 RUT Options Income Trading Daily Video
-
9
-
Trade Updates/Video:
March 3, 2016:
Part of trading is knowing when to take a loss and today it was time to take a loss. The results sheet shows the preliminary numbers for the now closed April CIB, but I still need to update the trade spreadsheet above.
Even though the Greeks of the position were fine when the position was closed, the trade had locked in losses from moving higher very quickly and had reached the stop point for the system. Chasing the market higher would have meant additional adjustments and a potentially larger drawdown. Controlling risk means getting out when it’s time to get out. I’m sure there will be some lessons in the trade recap that I plan to complete next week.
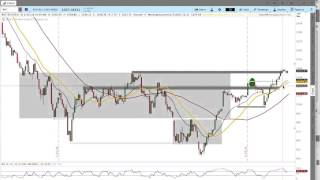
In the short term it seems like RUT really wants to touch 1080 and potentially 1100. I’m still in a few Broken Wing Butterfly trades in both RUT and SPX and those positions are all under control for the time being. Next week they may need to be adjusted, but they’re healthy for now.
March 2, 2016:
Note: After recording the video and updating my spreadsheet I noticed that there was an error in the video and the position was displayed inaccurately. I updated the spreadsheet with the actual values and the position is shorter delta and has a larger drawdown that shown in the video. The P/L on the spreadsheet includes all commissions to date.
Another note: The daily videos and updates over the next couple of days will be later than usual because I won’t be near my computer in the afternoon.
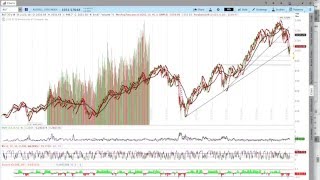
The market continued to crash higher today and ended the day up around 1065. The position was adjusted higher again and I rolled the 1000 Butterflies up to 1060 and sold one of the original 104 IWM calls. The trade has room to run on the upside up towards 1080, but we’ll need to be very defensive on the downside if the market reverses sharply.
With the number of fast upside adjustments the trade is drawn down some money, but is still within guidelines. We need the market to settle down a little bit to give the trade some time to work.
March 1, 2016:
The market definitively reversed the slightly pullback yesterday and price traded much higher. For the time being, we haven’t seen any indication that the market is reversing and heading lower. The market is getting a little extended on the upside, but it can continue to move higher. If the market falls below the 1037 level on the downside, we’ll have concerns about the market moving lower. For the time being we’ll defend the upside.
The trade was adjusted again today when price traded through the 1050 level. I added two 50×40 BWB’s centered at 1040, bought two 105 IWM calls, and picked up a disaster protection put in IWM. If we trade lower, I will likely sell out that put as I peel off Butterflies. If the market continues higher again tomorrow, the next adjustment point will be around 1060 where we’ll begin the rolling process for the trade.
February 29, 2016:
The market took a turn lower this afternoon and some caution is warranted on the upside going into tomorrow. Earlier in the day we saw the market trade higher and above the high of the day from Friday. However, later in the afternoon, the Russell gave up that level and sold off into the close to end the day down slightly.
With the move higher I added to the position on the upside and now have 2 Butterflies centered at 1000 and 2 Butterflies centered at 1020. The next adjustment point on the upside is around 1050. If the market heads deeply lower, I’ll start looking to take off the 1020 Butterflies.
It’s important to keep in mind that the market both trends and chops around in ranges. It’s possible that the recent short term trend could lead to some choppy price action within the recent 985-1035 range. Again, we won’t predict what will happen, but we’ll be aware of what is happening and react to changes as they play out.
February 26, 2016:
The market continued higher again today, but the intraday activity seems a little low energy and lacks conviction. I held off on making an upside adjustment to the position today because the market was struggling to move into higher levels after reaching the 1035 area. Next week we’ll want to see the market hold the 1020-1025 area to validate continuation of the short term uptrend we’re seeing. Failure at those levels could lead to a deeper pullback. Our job as non-directional traders is not to predict where the market will go, it’s to react.
If the market gets up and above the 1040-1045 level next week, I’ll add to the position with two 50 point Butterflies centered at 1020 and a couple of IWM calls (possibly the 105’s). As a reminder, the current position is made up of two Butterflies rather than the single Butterfly in the trade last month. The trade has a small open loss, but the position is fine and there’s no reason for concern.
Have a great weekend!
February 25, 2016:
The Russell 2000 was able to find support around the 1020 area we were watching yesterday and from there pushed higher to close around 1030. The next obvious target on the upside is the upper side of the balance area around the 1035 level. It seems likely that the market will at least test that level in the near future.
If the market is able to continue higher above the 1035 level, it begins to run into areas of potential resistance. Note that resistance is only potential and not resistance until after the fact. I wouldn’t be surprised to see a sharp break in the market, but there’s no way to know if/when that will happen. On the downside, RUT needs to hold 1020 and 1000. Breaking and holding below 1000 would create a reason to question the short term uptrend.
I added a second Butterfly to the April CIB position centered at 1000, which effectively increases the trade size. The fill prices for the second Butterfly and IWM call were very close to the initial prices from a couple of days ago. This also increases the max loss in the trade to $500-600 with some additional flexibility for adjustments. If RUT continues higher, we’ll be looking at our first upside adjustment in the neighborhood of 1045.
February 24, 2016:
The March trade was closed today for around the target profit. I could have let the trade run longer, but the position was getting close to expiration and it seemed prudent to book the profit. It was a challenging cycle and I’ll post a recap at some point to summarize the position. The April trade is open and safe.
We saw a big turn in the market this morning after the gap lower, but on the intraday timeframe we still don’t have any confirmation of a move higher and lower. The range is large and that makes it easy to get caught off guard when the market moves. If RUT can get up above and hold the 1025 level, it has the potential to run to the 1035 area. Breaking back below 1000 would be short term bearish.
February 23, 2016:
Yesterday we talked about the potential for a little pullback in the market today and that’s exactly what we saw. On the shorter term, 65 minute timeframe the RUT is still in a short term uptrend and has not violated the pattern of higher highs and higher lows. The daily timeframe is still bearish.
The March CIB has a good open profit as of the close today and I’m watching the trade and the markets closely. I’m trying to let the trade run slightly longer to pull in a little more money for the high commissions this month, but I will be trading to protect profit. Tomorrow I’ll be watching for a potential break of the 1000 and 1007 levels in RUT. Violating those levels could take the market down to the 985 area in the short term. If the market moves back up and above 1015-1020 area, I’ll become more defensive on the upside. The daily video goes through the trades and key levels. The April position that was opened yesterday is healthy.
February 22, 2016:
Some of the constructive price action we saw last Friday continued today with RUT gapping and then trading higher early in the day. At the same time, the move higher lacked conviction and follow through so I wouldn’t be surprised to see a red candle print on the daily chart tomorrow. I have, however, been wrong many, many times before.
The trade was adjusted up today by closing out one of the 980 Butterflies and adding another 50×45 BWB centered at 1020. I also sold out the 99 and one of the 101 IWM calls to get delta slightly shorter (rather than neutral) overnight.
The video above goes through important technical levels for the March trade and discusses the April trade that was opened today. The spreadsheet above has a second tab added for the April position.
Don’t miss out. Want to receive an alert as soon as new content is posted?

Sign up for my email list and stay up to date with the latest information on options trading.
Click here to sign up for the list, get a copy of the Theta Trend Options Trading System, the Trade Tacker I use, and information about new systems.
Even better . . . it’s all totally free.