Weekly Options Trend Following With One Indicator
Overview:
I know this sounds a little too good to be true, but I’m starting to think it’s possible to use only one indicator for trading weekly options. The original Theta Trend system uses an Average True Range Trailing Stop to both identify trend direction and act as a stop level. On a weekly level we could use the same indicator and add some sort of a filter to avoid overextended conditions.
Challenges With Weekly Options:
There are a few challenges with weekly options that make trading them slightly different than trading longer dated options. The biggest issue with weekly’s is that gamma is extremely high so if we’re short we definitely don’t want trades to go against us. That suggests to me that the “best” way to trade weekly options is in a trend following manner and when the trend is unlikely to reverse.
I previously wrote about a weekly options trading system and what I found is that you can create a consistent stream of returns, however, there will be an occasional drawdown that wipes out a big chunk of the gains. That system sold a week to expiration, $SPX, 10 Delta vertical spread every Thursday in the direction of the trend as defined by Parabolic SAR. Over the test period, the system “worked,” but the equity curve would be very hard to stomach. Additionally, if you went through a period with a string of losing trades, the drawdown would both be painful and hard to reverse.
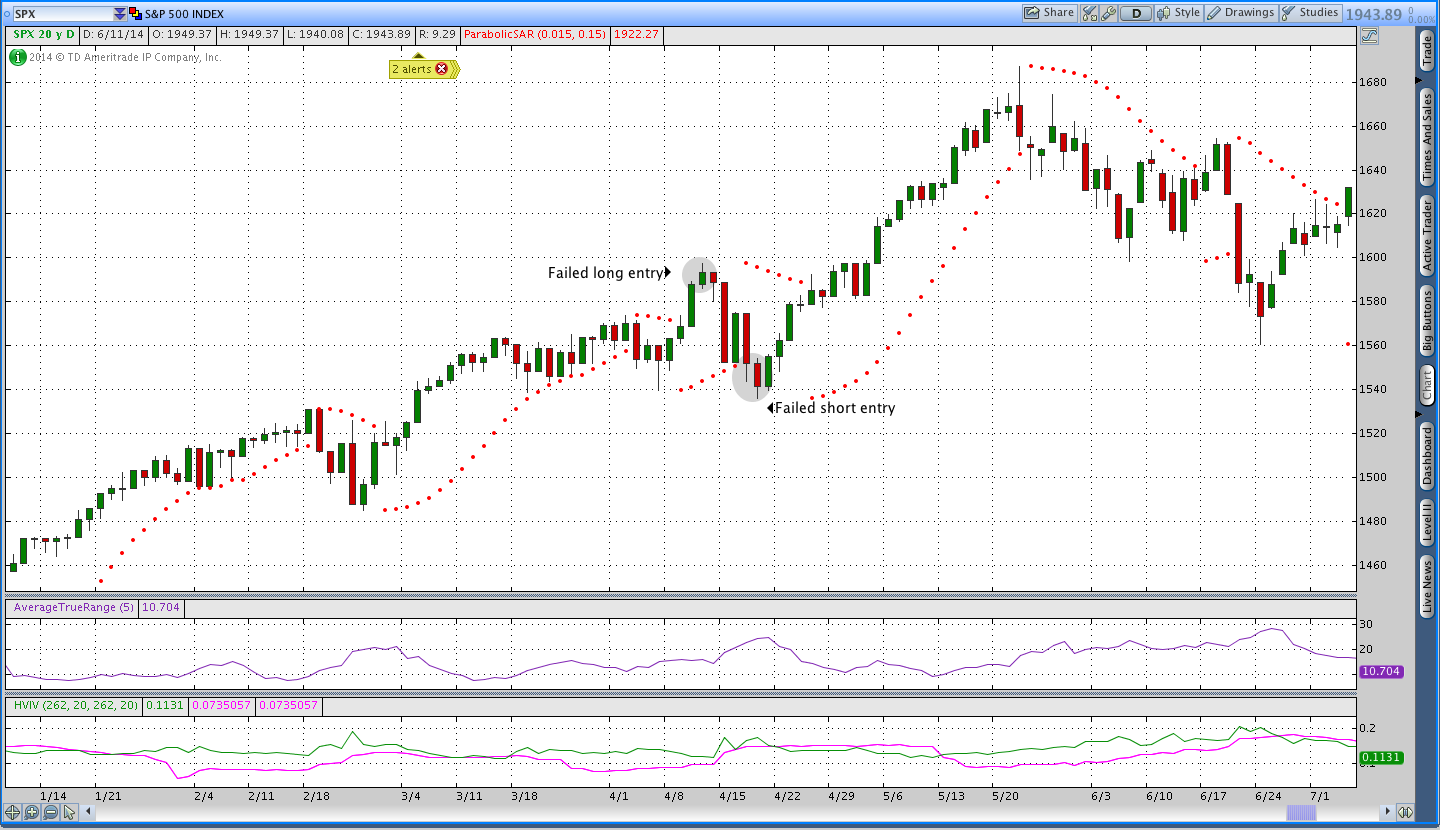
In the system described above, there were two big losing trades (back to back) that hurt the equity curve. In both cases, the market was short-term overextended and reversed. The potential solution is to avoid market conditions where price is overextended and sit on the sidelines rather than trade. The image below shows the two largest losing trades.
The Indicator:
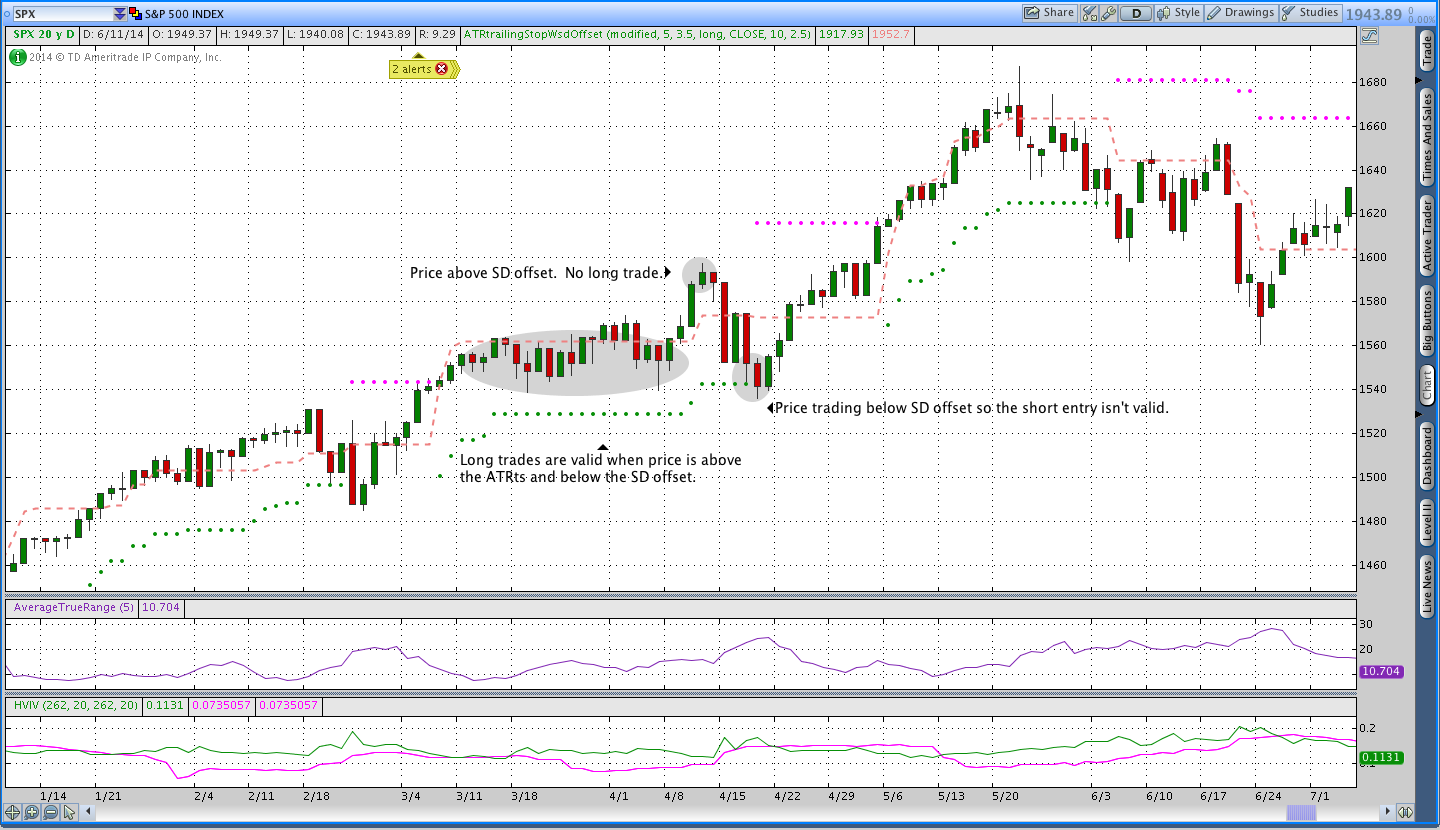
In order to identify overextended market conditions, I wanted to find or create an indicator that would objectively define when NOT to trade. The indicator I’m using is an Average True Range Trailing Stop with one simple tweak. I’m taking the ATRts value and adding a 2.5 standard deviation offset. Intuitively the indicator is saying that if price is over 2.5 standard deviations from the stop level, we shouldn’t trade because the distance to the stop is too great. Simple. Done.
In the image below, the ATRts is green when it’s in a long state and pink when it’s short. The dashed pinkish line represents the standard deviation offset. The offset is simply the indicator value plus or minus 2.5 times the 10 day standard deviation value.
Warnings:
Be warned that trading weekly options can go bad in a big way and that can happen very quickly. If you’re a sloppy risk manager, trading in general is probably a bad idea and trading weekly options is a really bad idea. The opportunity to mitigate risk with weekly options is greatly reduced due to very high gamma.
Looking Ahead:
Right now I’m going through a manual backtest using the ATRts with SD offset. I feel good about the results and that’s part of why I decided to post this before the manual backtest results are complete. I’m hoping to have something a little more concrete to share in the way of results sometime in the next week or two so keep an eye on the blog.
And, of course, the thinkScript for the indicator in TOS:
Note that the Average True Range Trailing Stop indicator code is provided via TOS. All I did was add the standard deviation offset.
One last thing, if you enjoyed this post. Please share it using the social media bar above. Thanks!
##Theta Trend ATR Trailing Stop with Standard Deviation Offset
##ATRts code from TOS, modified to include SD Offset
##www.thetatrend.com

input trailType = {default modified, unmodified};
input ATRPeriod = 5;
input ATRFactor = 3.5;
input firstTrade = {default long, short};
input price = close;
input length = 10;
input OSfactor = 2.5;

assert(ATRFactor > 0, "'atr factor' must be positive: " + ATRFactor);

def StdDev = stdev(price,length)*OSfactor;
def HiLo = Min(high - low, 1.5 * Average(high - low, ATRPeriod));
def HRef = if low <= high[1]     then high - close[1]     else (high - close[1]) - 0.5 * (low - high[1]); def LRef = if high >= low[1]
    then close[1] - low
    else (close[1] - low) - 0.5 * (low[1] - high);
def ATRMod = ExpAverage(Max(HiLo, Max(HRef, LRef)), 2 * ATRPeriod - 1);

def loss;
switch (trailType) {
case modified:
    loss = ATRFactor * ATRMod;
case unmodified:
    loss = ATRFactor * AvgTrueRange(high, close, low, ATRPeriod);
}

rec state = {default init, long, short};
rec trail;
rec trail2;
switch (state[1]) {
case init:
    if (!IsNaN(loss)) {
        switch (firstTrade) {
        case long:
            state = state.long;
            trail =  close - loss;
            trail2 = close - loss + StdDev;
        case short:
            state = state.short;
            trail = close + loss;
            trail2 = close + loss - StdDev;
        }
    } else {
        state = state.init;
        trail = Double.NaN;
        trail2 = Double.NaN;
    }
case long:
    if (close > trail[1]) {
        state = state.long;
        trail = Max(trail[1], close - loss);
        trail2 = Max(trail2[1], (close - loss + StdDev));
    }
    else {
        state = state.short;
        trail = close + loss;
        trail2 = close + loss - StdDev;
    }
case short:
    if (close < trail[1]) {
        state = state.short;
        trail = Min(trail[1], close + loss);
        trail2 = Min(trail2[1], (close + loss - StdDev));
    }
    else {
        state = state.long;
        trail =  close - loss;
        trail2 = close - loss + StdDev;
    }
}

def BuySignal = Crosses(state == state.long, 0, CrossingDirection.Above);
def SellSignal = Crosses(state == state.short, 0, CrossingDirection.Above);

plot TrailingStop = trail;
plot SDoffset = trail2;

TrailingStop.SetPaintingStrategy(PaintingStrategy.POINTS);
TrailingStop.DefineColor("Buy", GetColor(0));
TrailingStop.DefineColor("Sell", GetColor(1));
TrailingStop.AssignValueColor(if state == state.long
    then TrailingStop.color("Sell")
    else TrailingStop.color("Buy"));
Want to receive an alert as soon as new systems are posted?

Sign up for my email list and stay up to date with the latest information on options trading and trend following.
Click here to sign up for the list, get a copy of the Theta Trend Options Trading System, the Trade Tacker I use, and information about new systems.
Even better . . . it’s all totally free.
This is one of the best ideas I have seen for credit spread trading in a long, long time. Can you tell us which instruments we should be considering? Have you looked beyond indices to individual stocks / members of the ETFs or commodity ETFs? Great job and thanks for sharing.
Hey Mike, thanks for the great compliment. What I’ve found with vertical spreads that are close to expiration is that you need to use a “bigger” product to make selling the spread worthwhile. I don’t like selling vertical spreads for less than .40 and most ETF’s won’t have a credit at or above that amount. I have a preference for 10 point verticals in SPX, but you could also think about RUT, NDX, or possibly OEX or MNX. One area that I’m interested in that I haven’t explored much yet is options on futures. Hope that helps and thanks for reading.
Hi Dan, I came to this post via the link in your Weekend Market Commentary. Thank you for posting your ideas and systems. It’s interesting to think about them.
I find the above system interesting, but I am having a little trouble following the standard deviation offset to the ATR. For one, the ATR is a measure of volatility or variation as is standard deviation. Why not just adjust the number of ATRs you use? And what is the standard deviation offset a standard deviation of – ATR or underlying? Could you not just hypothesize price is overextended when it reaches 2.5 standard deviations (or 3 or 2) away from price’s mean and not enter a trade then. This would be similar to using an overbought/oversold indicator and not trading when it is at an extreme. Or only taking a trade when it was at an extreme opposite the trend, e.g. when price is oversold in an uptrend, you enter long. This would essentially be a pullback.
I see the value of entering the market only in the direction of the trend to improve probability of success, as opposed to taking countertrend trades. But my goal has generally been to take those trades when you can get a “wholesale” price – that is, on a pullback. And as I have come to use credit spreads more recently, I look to sell a spread in the opposite direction of the trend, e.g. enter a bull put spread in an uptrend. Here again, entering on a pullback is most advantageous.
I also use a Donchian Channel on my charts – primarily to have support/resistance lines drawn automatically. And it provides a sense of order to the chart that I find appealing. But I am most interested in the situation where the channel is in an uptrend, but there is a temporary drop to the bottom of the channel before price begins it’s assent again. Another way of looking for a pullback.
I have just moved to Tradestation (for the lower commission) and have put an indicator on that chart of Z-scores which measure the number of standard deviations price is from it’s mean. I find this helpful as an overbought/oversold indicator. I have observed that in a trend, the countertrend move rarely moves more than one standard deviation from the mean (although the move with the trend may be 2 or 3 standard deviations). So I look at one standard deviation below the mean as a reasonable place to enter a trend trade based on a bullish basis (and I am assuming I have located a pullback).
Anyway, sorry to ramble and I would be interested in your thoughts, if and when you have time.
Hi Terry, thanks for the questions.
You’re correct and I agree that both SD and ATR are essentially measures of the amount price is moving. The reason I’m choosing to use a slightly higher measure of ATR (3.5 rather than 2) is that I don’t want trade direction to be flipping from long to short as often. I’ve used 3.5 x ATR for quite a while and I’m comfortable with the signals and think the distance from the market is good for my purposes, but someone could certainly use a different multiple.
The reason I’m taking SD and using it as an offset from the ATRts is that the trailing stop is where I expect my trade to either continue the trend or flip the other direction. Since there’s a possibility that I’ll be getting out at that level, I don’t want to enter trades that have a long way to go before hitting the stop. The reason I’m choosing to use the trailing stop rather than the mean is that the mean is sort of an arbitrary point for the system. However, the ATRts is a significant price for the system because it’s a potential exit. Bollinger bands take the moving average of price (the mean) and plot a standard deviation offset. Conceptually, what the ATRts w/ SD offset indicator is doing is similar except it’s using the stop level as a starting point rather than the mean.
Ideally, I want to enter long (short) trades when price is below (above) the SD offset and above (below) the ATRts. The closer price is to the ATRts when I enter the trade, the less risk I have because I close trades when the ATRts flips direction. Note that I’m selling a 10 delta option regardless of how far we are from the trailing stop so the amount of potential heat depends on how far price is from the trailing stop level.
What you’re saying about Donchian channels is very true as well and it seems like another way to objectively define a pullback. I also think the Z-score you’re describing sounds interesting. I haven’t personally explored that, but it does sound worth pursuing in a little more detail. I’m starting to dig around for some ThinkScript for Z-Score.
Thanks again and let me know if you have any other questions/comments.
Best,
Dan
Thanks for responding Dan. I think I understand now. I guess it still seems to me it might be useful to be consistent with what is being used to measure variation. As I understand what you are doing you could essentially use a Keltner Channel, based on ATR with minus 3 ATR as the lower channel line (and stop point) and an upper channel based on whatever value you choose (perhaps 3xATR). And you would not trade if price were outside the channel, long or short.
Anyway thanks again for responding and for posting what you are working on. I appreciate your generosity.
Just wondering if anyone has backtested this lately?