Weekend Market Commentary 6/13/14 – Stocks, Gold, Bonds ($SPY, $GLD, $TLT)
Big Picture:
We saw a little bit of a pullback in stocks this week and to me that suggests that stocks are going to take some time to digest their recent gains. That being said, the trend in $SPY is still very clearly bullish. Bonds pulled back early in the week and that was enough to flip the weekly pSAR from long to short. If you remember from last week, pSAR was very close to the market and in danger of getting hit. I covered the short puts and sold a couple of calls, both of which are are taking a little heat. I’ve been hesitant to sell calls on Gold after the big down move in recent weeks, but I used the strength this week to sell a call. The longer term trend in Gold is still lower, but the daily trend has flipped to neutral (from down).
I’m starting to real time test a weekly options trading system that sells out of the money vertical spreads in $SPX. The system has three potential options: no trade, a high risk trade, or a low risk trade. This week there was a potential high risk trade that I chose not to take. I’ll be posting additional information on the system over the next few weeks, but in the meantime you can check out the post from Thursday.
The Donchian channel system took a new position in $DBE (Energy) on thursday following a nice breakout.
Implied Volatility:
Implied volatility got a little pop this week with the VIX closing above 12 or 13.5% higher than last week. However, IV is still low relative to both the 3 month and 1 year range.
The Weekly Stats:
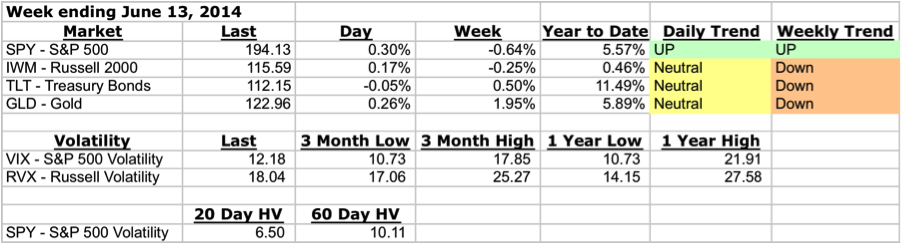
A note about trend . . . Trend on the daily timeframe is defined using Donchian channels and an Average True Range Trailing Stop. There are three trend states on the Daily timeframe: up, neutral, and down. On the weekly timeframe, I’m looking at Parabolic SAR to define trend and there are two trend states, up and down. In reality, there are always periods of chop and I’m using the indicator to capture the general bias of both the trend and those periods of chop.
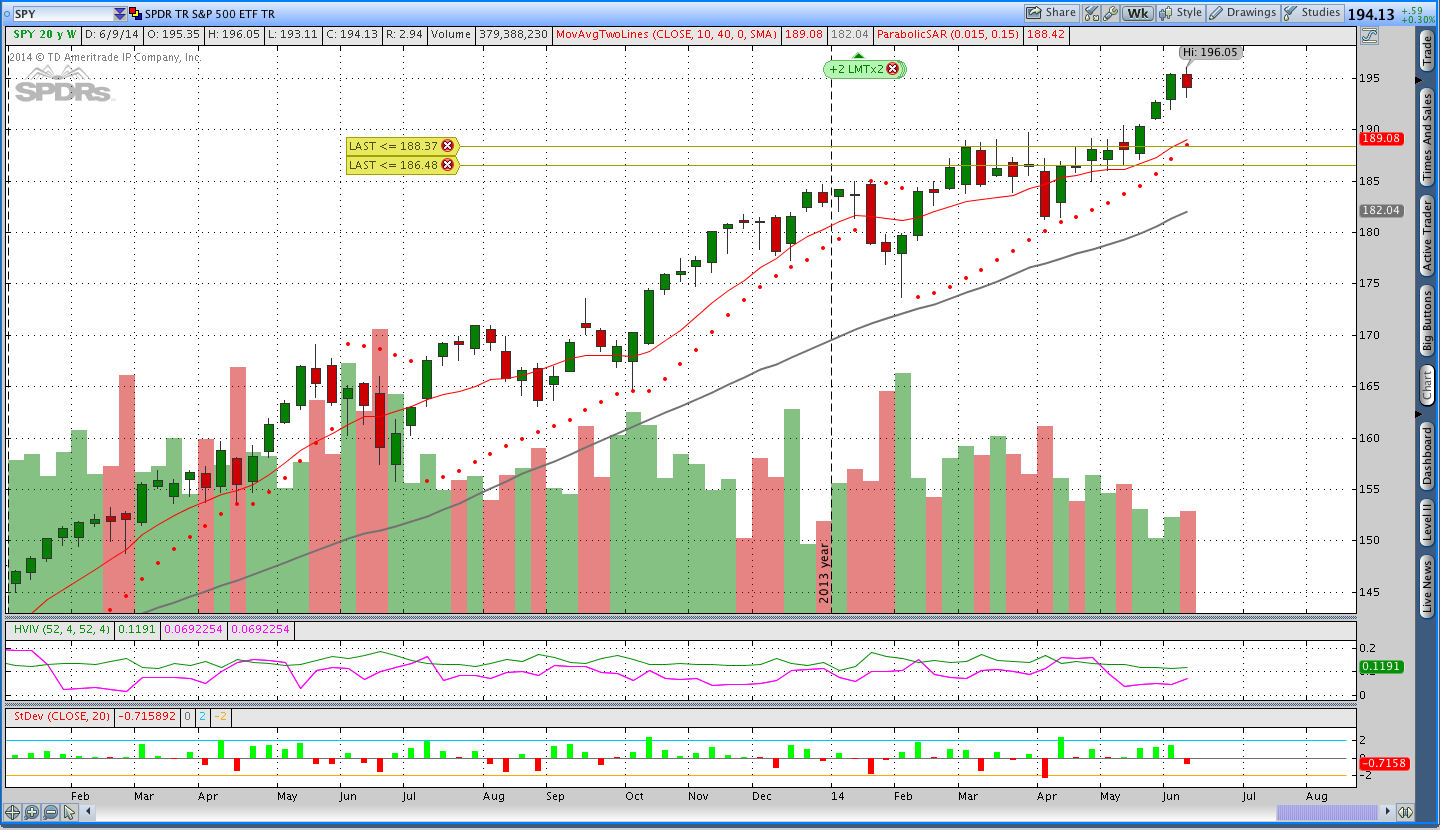
Stocks ($SPY – SPDR S&P 500):
Stocks took a breath this week and look like they’re consolidating after a big run. We saw the S&P off a little bit on the week, but there isn’t reason for concern yet. Note that volume in $SPY was up a little over last week even though price is still holding above the lows from last week.
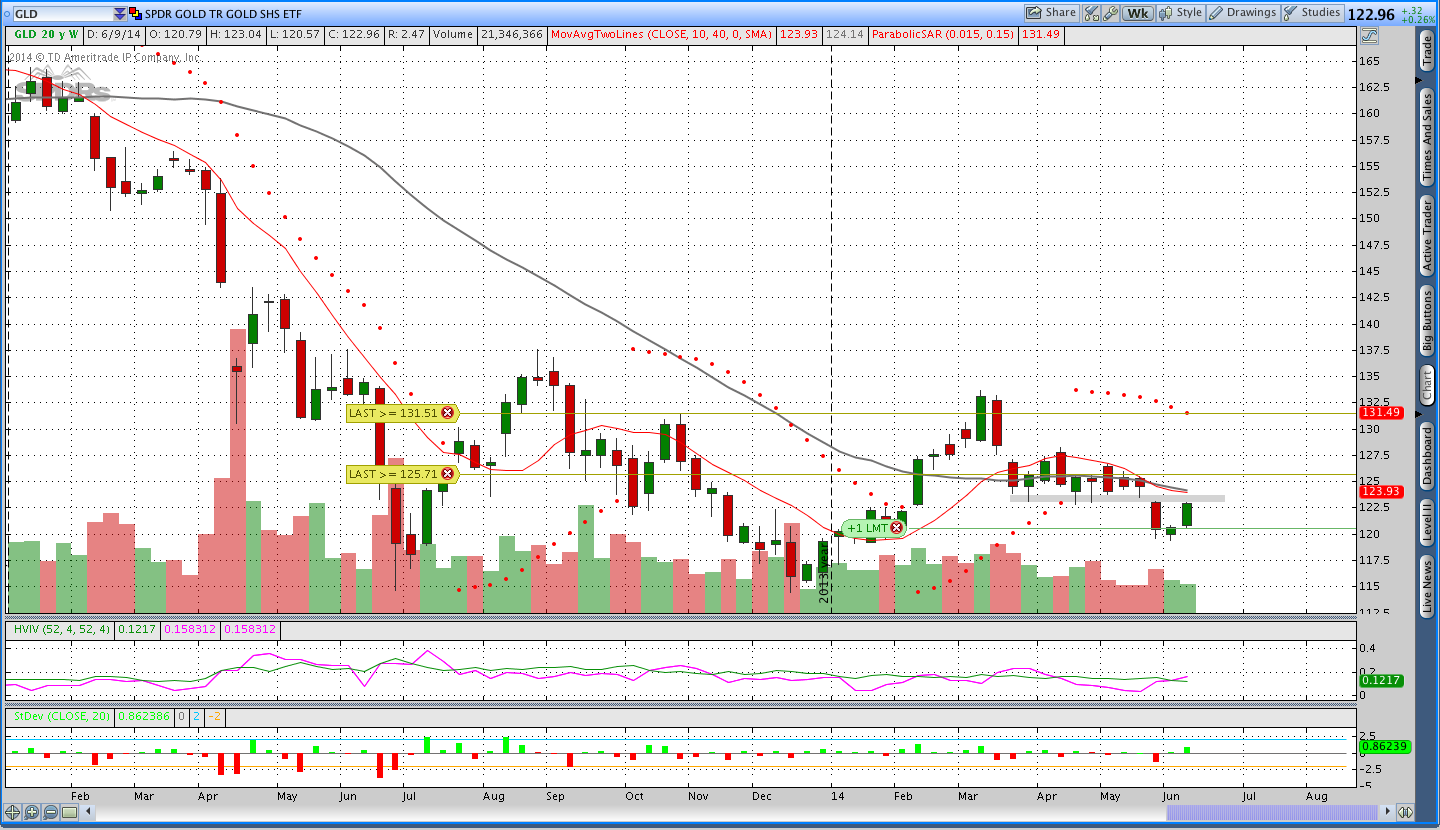
Gold ($GLD – SPDR Gold Shares ETF):
After pausing last week, Gold made a nice move higher this week. That being said, price is still below the declining 10 week (50 day) and 40 week (200 day) moving averages and we’re coming into an area of potential resistance. I’m a little short Gold and I’d like to see the market turn down next week.
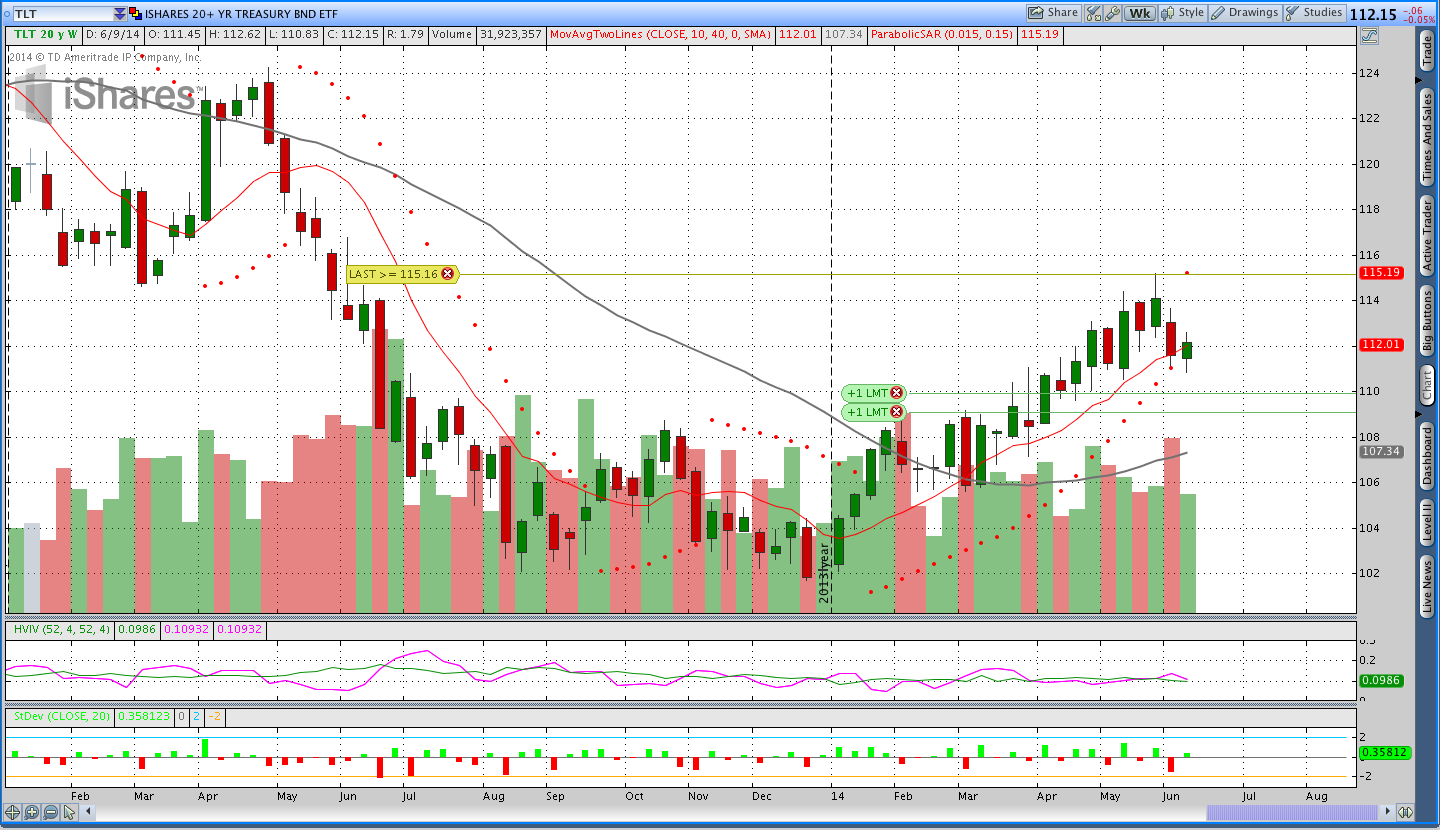
Bonds ($TLT):
Last week I mentioned that my short puts in $TLT were in danger of being closed. This week price traded below the Parabolic SAR flipping the trend from long to short and I closed out the trades. I sold a couple of calls and then Bonds firmed up a little bit. Oh well.
$TLT closed right around the 10 week (50 day) moving average. My opinion, not that the market cares, is that Bonds look like they’re consolidating a little bit and a period of chop is more likely that significantly higher or lower prices. I’d be happy to see a move down to the 40 week (200 day) moving average.
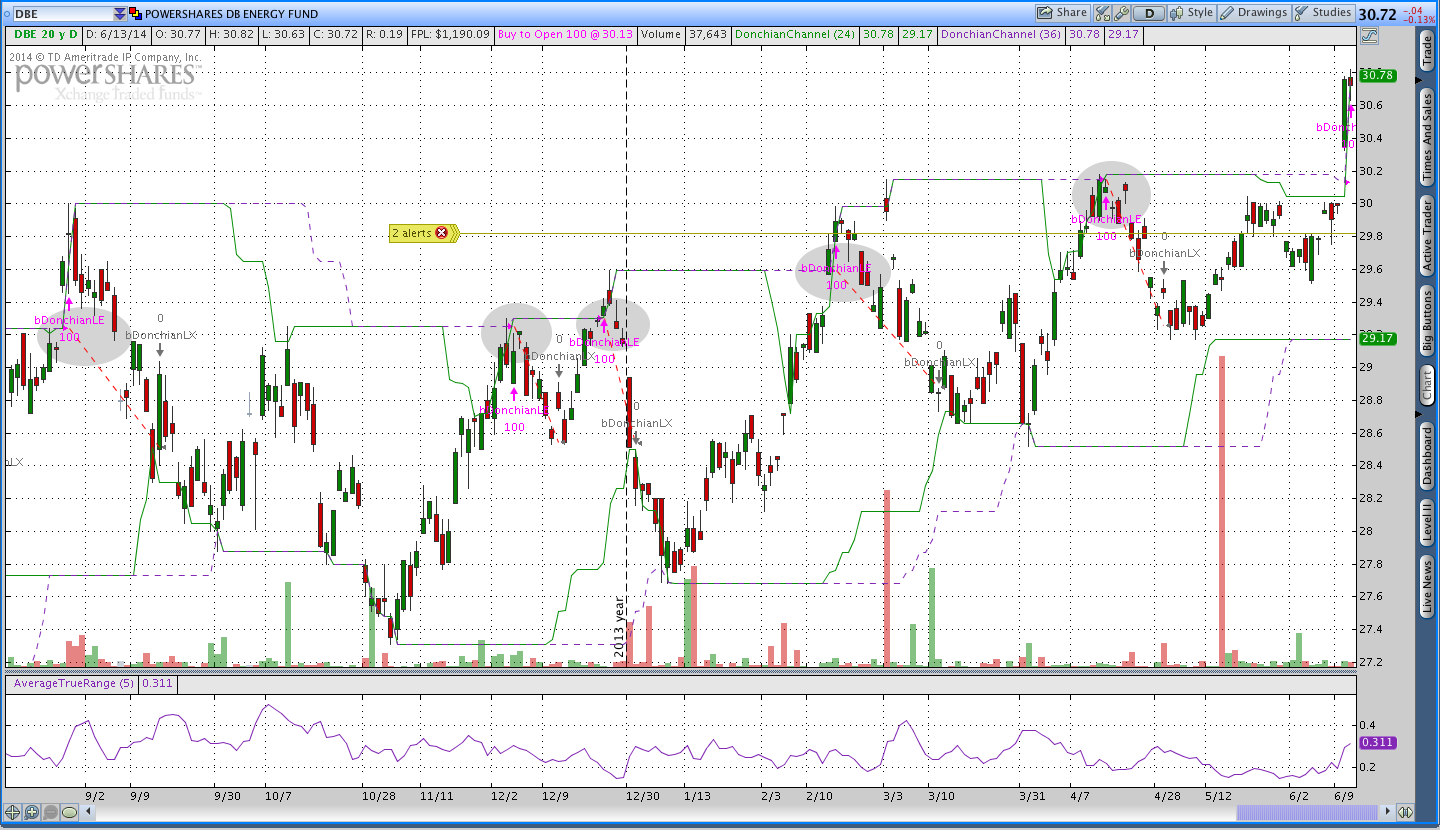
Energy ($DBE):
This week there was a new Donchian channel breakout in Energy ($DBE). In the chart below you can see that the last 5 breakouts in $DBE have failed. I’m hoping that this one is definitive enough to get the market up and moving. What the chart doesn’t show is that there are two additional failed breakouts prior to the 5 shown. What that means is that there have been 7 failed Donchian channel trades in a row. The amazing thing about the Donchian system is that it does make money over time because the winning trades can be so disproportionally large. This year the big winner has been Coffee ($JO).
Trades This Week:
TLT – Sold to open Sep 2014 117 call at .46
TLT – Sold to open Sep 2014 118 call at .40
TLT – Bought to close Short Aug 2014 105 Put for .35
TLT – Bought to close Short Aug 2014 107 Put for .69
GLD – Sold to open Sep 2014 134 call for .40 (should have waited to sell for .45)
SPY – Sold to open August 2014 177 put at .51
DBE – Bought to open 111 shares at 30.37
SPY – Sold to close 6 shares at 193.49 (to free up margin)
NZD/JPY – Covered short 5,000 notional units at 88.276
Option Inventory:
SPY – Short Aug 2014 173 Put (sold for .60)
SPY – Short Aug 2014 177 Put (sold for .51)
TLT – Short Sep 2014 117 Call (sold for .46)
TLT – Short Sep 2014 118 Call (sold for .40)
GLD – Short Sep 2014 134 Call (sold for .40)
ETF & Forex Inventory:
SPY – Long 12 shares from 188.58
DBE – Long 111 shares from 30.37
EUR/USD – Short 5,000 notional units from 1.3673
USD/CHF – Long 6,000 notional units from .8953
Looking ahead:
This week was a little rough for some of my options trades, but I think everything will work out fine. Most of the pain came from moves against the direction of the longer term trend so a little pain is to be expected. Nothing is in danger of hitting a risk based stop loss or roll point. Next week I’ll just be watching positions and continuing to work on the weekly options system. Hopefully a trade in the weekly’s will get triggered next week.
Thanks for reading and have a great weekend. If you enjoyed the post, please share it using the social button toolbar above.
Want to receive an alert as soon as the next market commentary is posted?

Sign up for my email list and stay up to date with the latest information on options trading and trend following.
Click here to sign up for the list, get a copy of the Theta Trend Options Trading System, the Trade Tacker I use, and information about new systems.
Even better . . . it’s all totally free.