Z-Score – An Indicator To Define Overbought and Oversold (Thinkscript)
Pain.
I’m always looking for ways to reduce pain when I’m trading and by pain, I really mean heat. I know that I’m not alone in that pursuit because I see credit spread traders waiting and waiting to fade big moves. For example, they might want the market to sell off as much as possible before selling a spread with the hope that they’ll take less heat on the trade and get as far away from the market as possible.
The challenge is that defining overbought and oversold is not easy. Good traders have a method or set of rules for determining market extremes and, in many cases, they rely on indicators or levels. In this post we’re going to explore Z-Score and how it might be used to quantify overbought and oversold conditions for potential trade entries.
Background
Let’s just start out by saying that I’m not a math expert and I realistically only know enough to come up with ideas. That being said, let’s talk about standard deviation. The Standard Deviation of price returns is a way of quantifying the amount we can expect something (the market) to move. Anyone who has completed basic statistics knows that a 1 SD move encompasses 68% of potential changes (34.1% above and below the mean). A 2 SD move encompasses around 95% and 3 SD represents 99% of the potential price changes. Most traders also know that the distribution of returns is not normal, but we’re not going to dig too deep into that right now.
From a trading standpoint, what we’re concerned about is what some type of SD move means. For example, if we see a 4 SD move, what does that mean? A 4 SD percentage change move means that the market has just made a move that is very unlikely (< 1% chance). However, the unlikeliness of that move is based on the sample size and market environment used to calculate SD. For example, if we use a calm market period to calculate SD, we can expect a 1 SD to be smaller than if we use the 2008 crash. Intuitively, we expected the market to move more on a percentage basis during that period. SD gives us a way to compare the size of moves independent of the individual percentage changes.
Z-Score
This is where it starts to get more practical. The Z-Score takes another step towards quantifying what the market has done. Very simply, the Z-Score describes the relationship of a value to the mean. For example, a Z-Score of +1 means the value is one standard deviation above the mean.
A Z-Score of +1 doesn’t mean anything in and of itself because it depends on the context of the mean. Normally we think about the mean as a static number, but in trading the mean is not static (neither is SD). Mathematically we know that the 20 day simple moving average is the 20 day average of closing prices. We also know that on the vast majority of days, the average will change because the market has changed.
The changes in a simple moving average can be either positive or negative, meaning the average can be rising or falling. In a bullish market environment, we expect the average to rise with rising prices. In a bearish environment, we expect the average to fall on most days. Taking that logic a step further, we expect pullbacks in a bullish market to resolve themselves higher. In a bear market, we expect the opposite (pushes higher are resolved to the downside).
Mathematically, the Z-Score is (X(the market price) – Mean)/SD. In terms of the market, we’re interested in knowing what the last price is relative to the mean in terms of SD.
Read more about Z-Score here or here.
Application to Trading
Let’s go back to the 4 SD move example. Suppose we use a 20 day window to calculate SD and the market makes a 4 SD move lower. Is that move a good time to sell puts? Unfortunately, we don’t know. A 4 SD move lower could indicate that there’s a big break in the market and the market will continue lower. However, it could just indicate a sharp pullback within an uptrend. In order to know if it’s a good time to sell puts, we need context about the market.
Now suppose we’re saying the 4 SD move is measured relative to the 20 day window of closing prices and 20 day simple moving average (the mean). If price trades 4 SD below the 20 day SMA, is that a good time to sell puts? Again, the context matters and we really don’t know.
In a downtrend, we know that indicators like simple moving averages slope down. That downward slope means that prices are generally moving lower. As a result, fading the move back to a declining 20 day SMA may or may not result in a winning trade. The reason is simply that the average might be lower than the point of entry by the time price trades to the average.
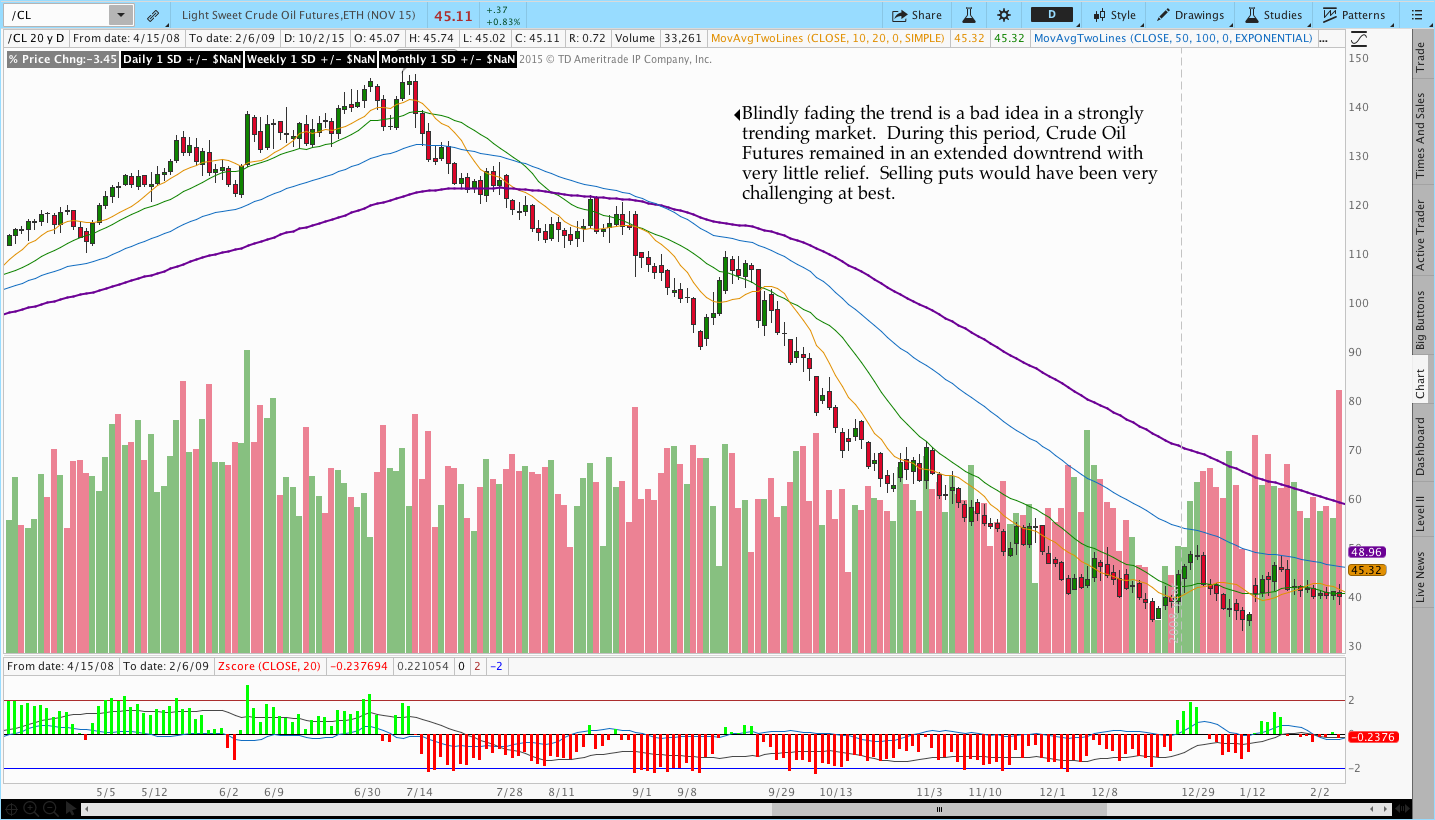
Over short periods of time, the market price can stray significantly from moving averages. In a strongly trending market, it’s not unusual to see the moving averages “catch up” with price rather than seeing price revert to the mean. In the chart below of Crude Oil Futures, you can see that the indicator can maintain a pattern of negative Z-Scores for a long period of time in a strongly trending market and using the indicator for counter trend trading can be dangerous in a strong trend.
Creating An Indicator:
The application of the indicator for trading purposes is better suited for another post. That being said, let’s look at a couple of recent examples of how you might use the indicator.
As I mentioned above, context of the market is extremely important for all counter-trend and trend based systems. People with more of a Trend Following mindset could find value in the indicator as a timing tool for pullbacks. Counter Trend traders might find value in the indicator for predicting reversals.
The image below provides an illustration of how you might use it for entering options trades in the direction of the primary trend. For purposes of our discussion, we’ll just say that when the 20 day SMA (yellow) is above the 200 day SMA (black) the market is in an uptrend. The Z-Score indicator shown below has a zero line equal to the mean with values plotted above and below with extremes set at 2 SD.
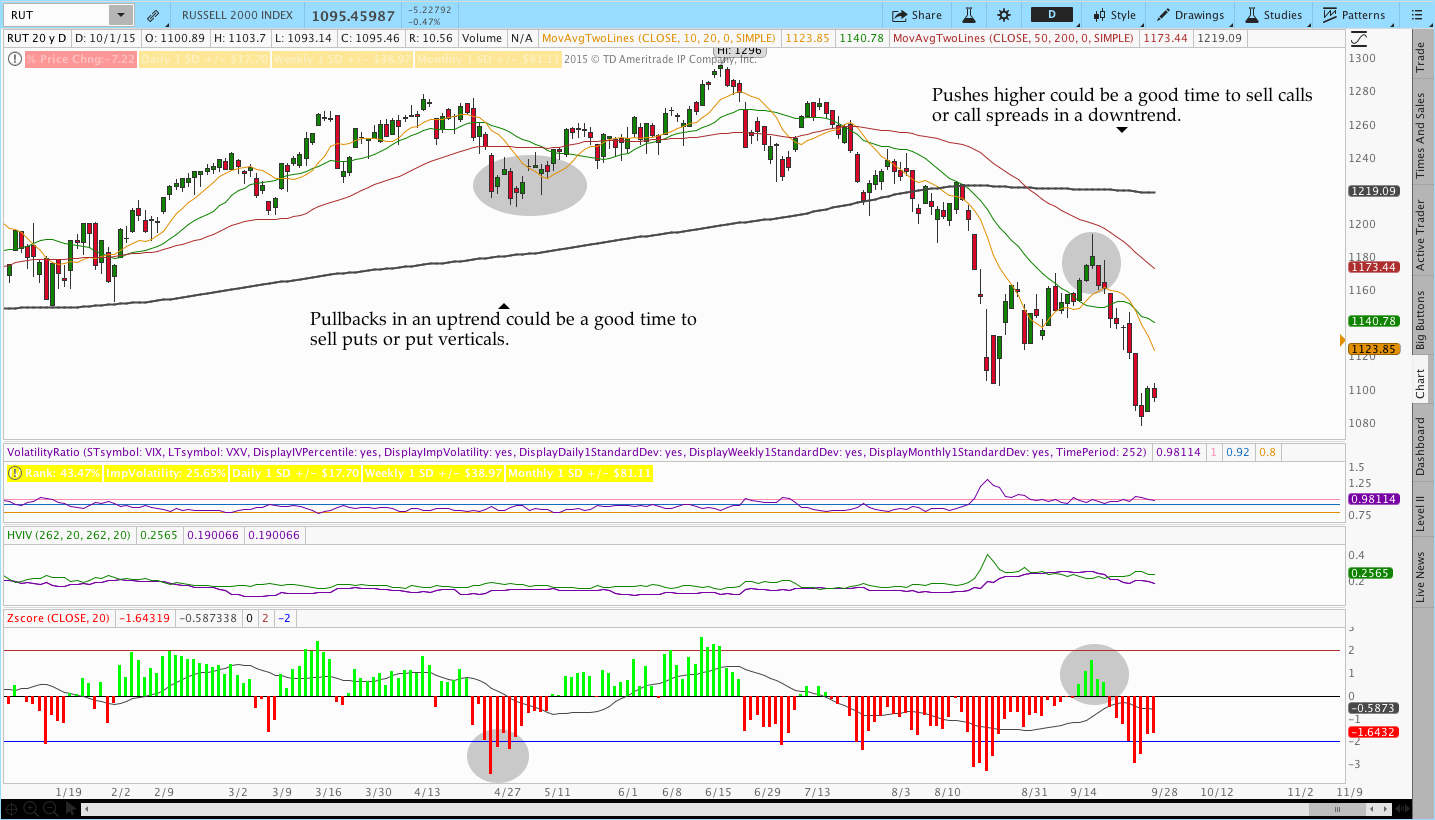
The Z-Score indicator shown above also includes a moving average as part of the code. The moving average is the 20 day moving average of the Z-Scores. When price declines below the 20 day SMA and continues lower, the moving average of the Z-Scores begins to fall.
Indicator Code:
The Thinkscript code below is designed for you to copy and paste it into ThinkOrSwim. Feel free to re-distribute the code, but please share a link back to this page.
I’m still looking at some practical applications for Z-Score so we may be revisiting the indicator in the future. For now, enjoy the code!
#Computes and plots the Zscore
#Provided courtesy of ThetaTrend.com
#Feel free to share the indicator, but please provide a link back to ThetaTrend.com

declare lower;

input price = close;
input length = 20;
input ZavgLength = 20;

#Initialize values
def oneSD = stdev(price,length);
def avgClose = simpleMovingAvg(price,length);
def ofoneSD = oneSD*price[1];
def Zscorevalue = ((price-avgClose)/oneSD);
def avgZv = average(Zscorevalue,20);

#Compute and plot Z-Score
plot Zscore = ((price-avgClose)/oneSD);
Zscore.setPaintingStrategy(paintingStrategy.HISTOGRAM);
Zscore.setLineWeight(2);
Zscore.assignValueColor(if Zscore > 0 then color.green else color.red);

plot avgZscore = average(Zscorevalue,ZavgLength);
avgZscore.setPaintingStrategy(paintingStrategy.LINE);

#This is an optional plot that will display the momentum of the Z-Score average
#plot momZAvg = (avgZv-avgZv[5]);

#Plot zero line and extreme bands
plot zero = 0;
plot two = 2;
plot negtwo = -2;
zero.setDefaultColor(color.black);