Weekend Market Commentary 9/25/15 – $RUT, $RVX, $SPX, $VIX, $VXV
Big Picture:
 Lately I’ve been thinking about relevance. What matters, what doesn’t, and, of course, why. When you follow financial markets, the volume of information is overwhelming and the vast majority of it doesn’t matter and will be quickly forgotten. A good policy is to assume that whatever you read, hear, or see doesn’t matter. If you’re still thinking about it later, it might matter. If you see something later that is the result of the earlier information, then it does matter. How often will something matter? Probably not very often.
A few weeks back all the technical analysis guys on the web were drawing little triangles around the market price. It was an ascending triangle, a bear flag, or whatever the hell they said it was. Additionally, there was the fundamental story that the Fed could be the catalyst to force a breakout.
Guess what? It was just historical price action with no predictive value. One of the things I’ve noticed about chart patterns is that the more noise there is surrounding some pattern, the more likely it is to fail. All we can do is control our risk and react when the market does something we’re not expecting.
The market really will do whatever it wants, whenever it wants (vague Eminem reference). In most cases, price does not play out the way I would expect and, at the same time, you can still make money. The only time you really run into a problem is when you start “wanting” or “willing” the market to do a certain thing. Once you’ve reached that point, the trade is over (even if you don’t know it yet).
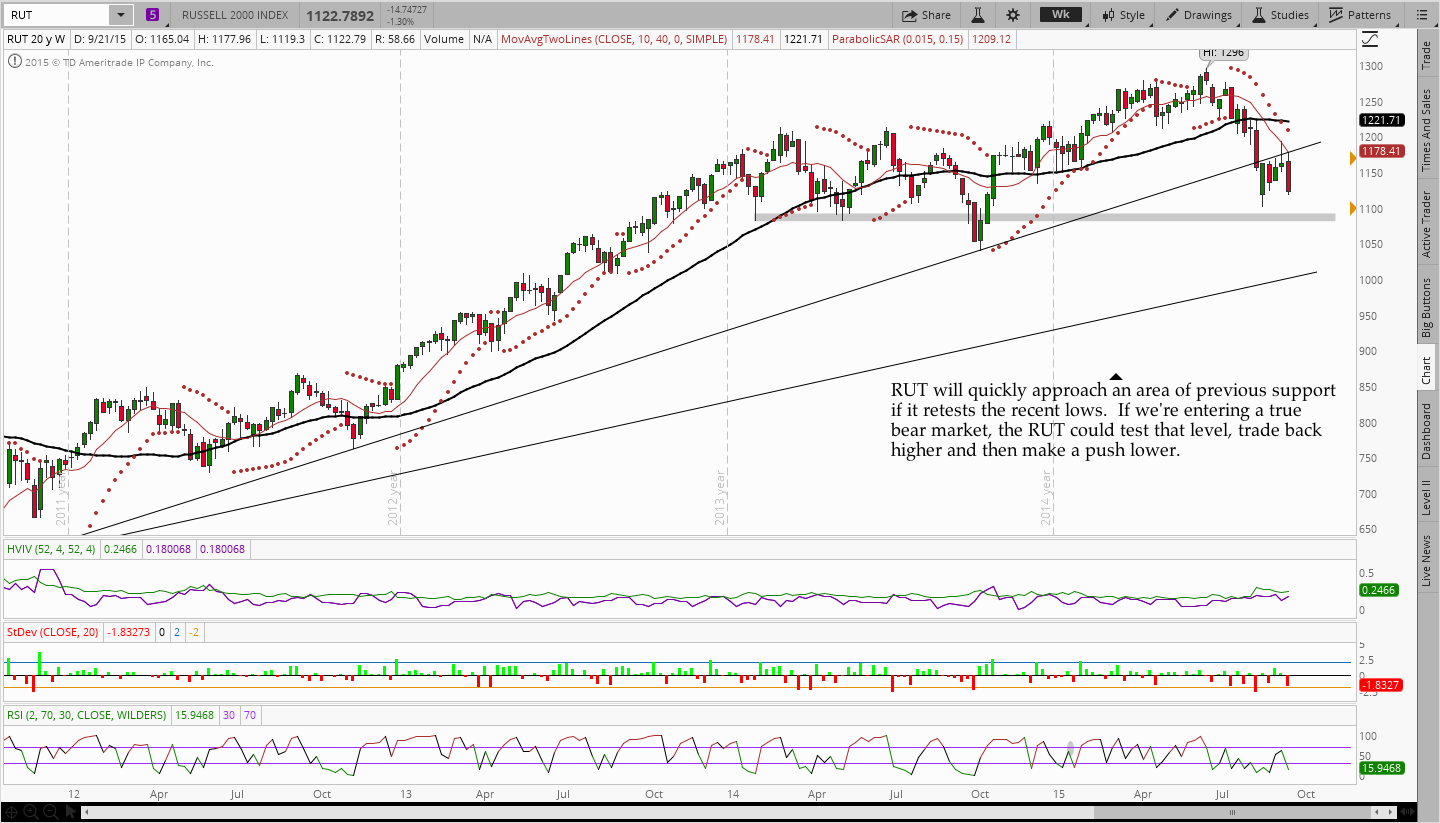
A couple of weeks ago, I was expecting a market decline. Instead, the market traded up much higher into the Fed number and then, when it was ready, sold off. That sell-off continued this week and the Russell 2000 is in the neighborhood of the recent lows. When markets get close to significant levels, they seem to be drawn to the levels until they test them. We’re getting close to the lows and it looks like a test is in order, but I wouldn’t be surprised to see a little bounce higher first. Maybe we’ll never make it lower. Nobody knows, and if someone does, that someone certainly isn’t me.
A smart person told me that the market likes to inflict the greatest amount of pain on the greatest number of participants. That pain shakes people out before it does what everyone was expecting. Is that about to happen?
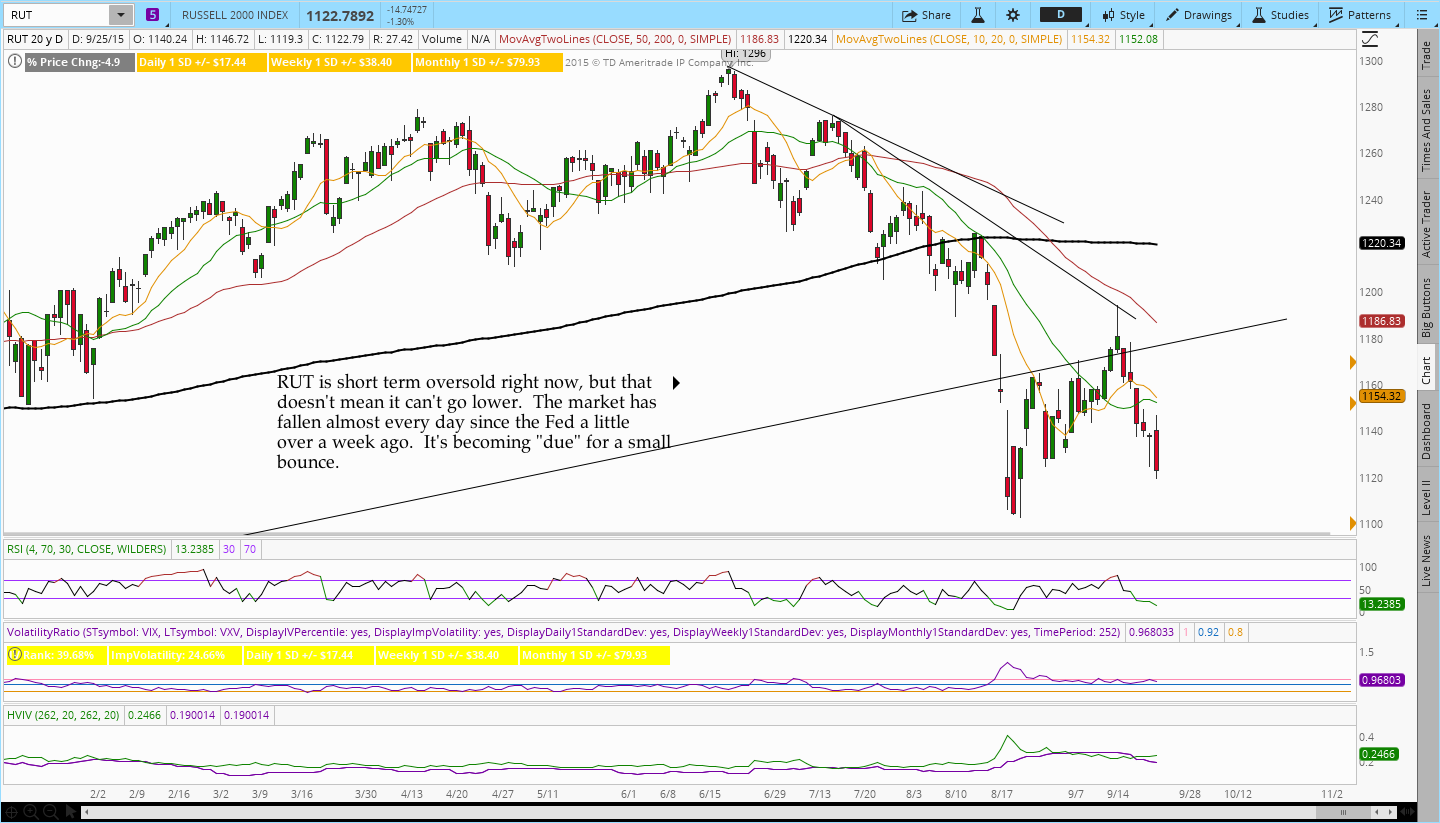
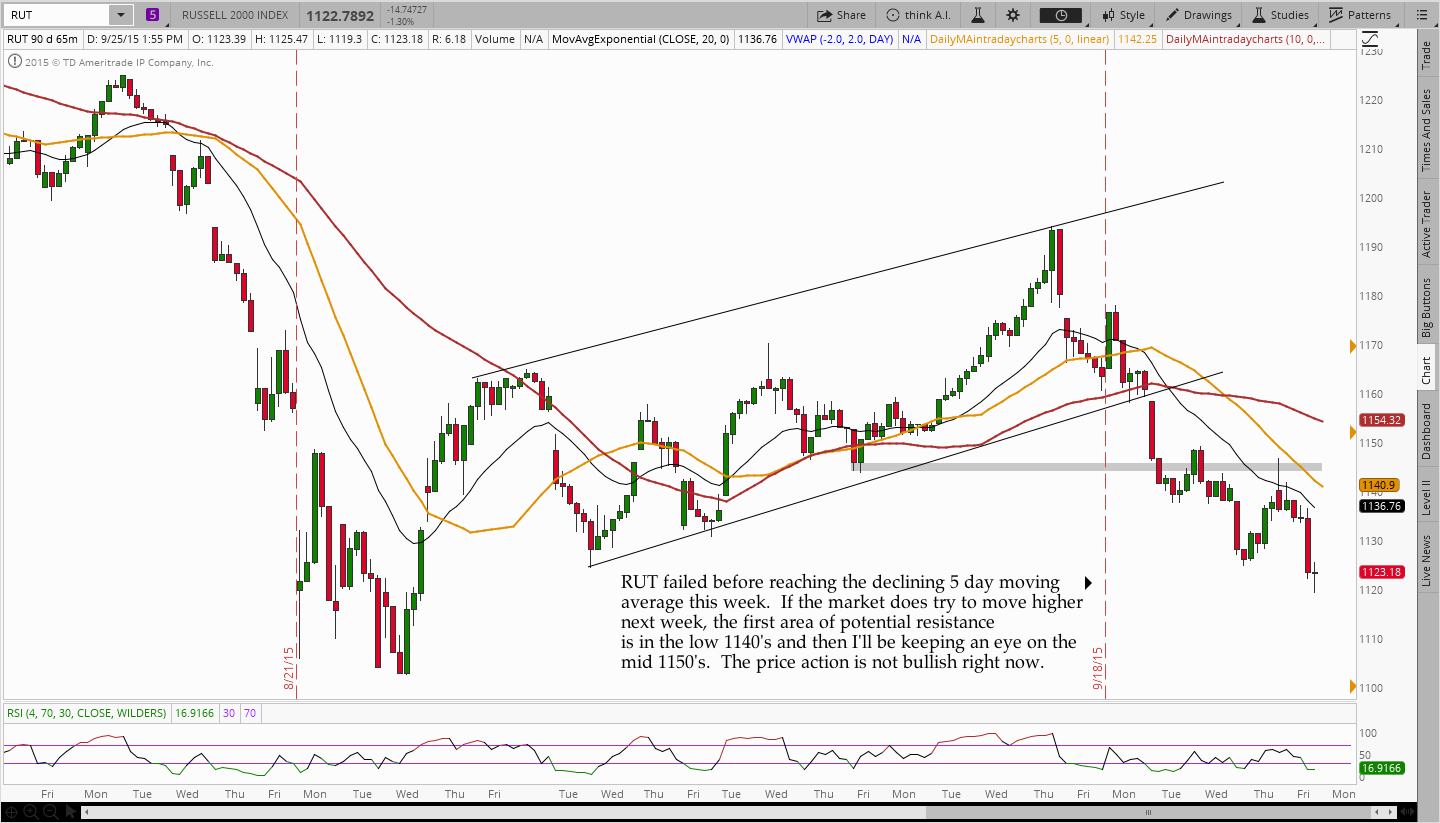
The Russell 2000 is weak right now. It’s below the declining 5 and 1o day moving averages, but it has also just traveling from the 1190’s to the low 1120’s. It has made that trip without any significant bounces up. The bounce higher yesterday morning into the 1140’s was sold and RUT ended the week down at 1122. RUT was significantly weaker the than S&P 500 this week.
For the time being, the markets are trading in a relatively wide range with elevated volatility. However, the race to buy protecting looks like it has slowed slightly. The Russell was off over 3% on the week while the $RVX barely nudged higher from 23.70 to 24.50. The panic from a couple of weeks ago seems to have faded and a little bounce wouldn’t be surprising. That being said, the market is still very damaged and we need to remain cautious because moves can happen fast and they can happen in either direction.
Market Stats:
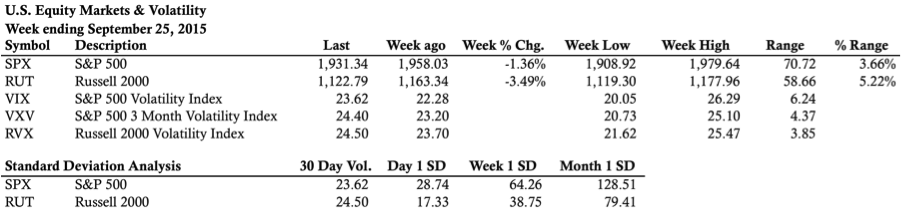
Levels of Interest:
In the levels of interest section, we’re drilling down through some timeframes to see what’s happening in the markets. The analysis begins on a weekly chart, moves to a daily chart, and finishes with the intraday, 65 minute chart of the Russell 2000 ($RUT). Multiple timeframes from a high level create context for what’s happening in the market.
Live Trades . . .
The “Live Trades” section of the commentary focuses on actual trades that are in the Theta Trend account. The positions are provided for educational purposes only.
My positions are light this week and I had a good week for trading. Early in the week I was able to close my October Butterfly for around the target profit. The October position required a large number of adjustments, but the trade went through some big price swings and still came out okay. You can read the review of the October Butterfly here.
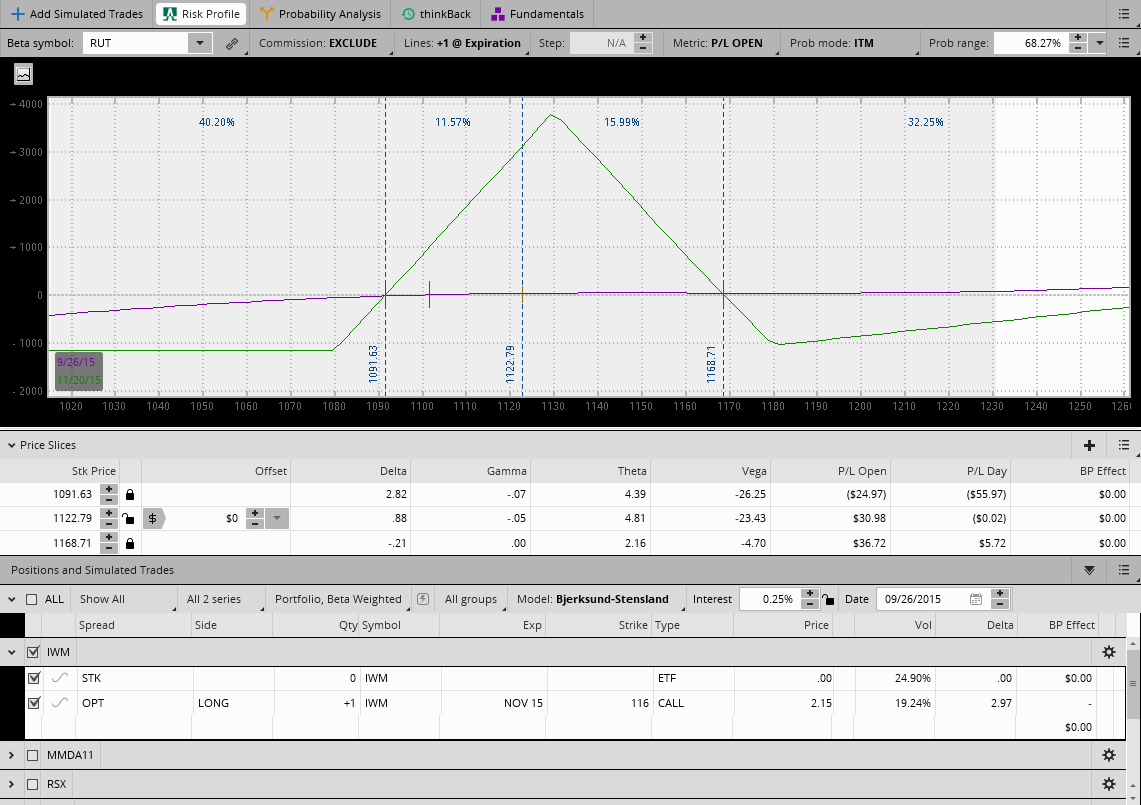
The image below shows the November Butterfly. I opened the trade a little earlier than planned, but my reasoning is that I like the trade location if RUT remains in the large range it has been trading in. Pushing into new lows will force me to roll back the position and I have a good amount of room on the upside before getting to an adjustment point.
Looking ahead, etc.:
Every week we get a little new information and adapt. For the past month, the market has made us wait without providing any type of real direction. The tumble lower happened about a month ago and things have stabilized somewhat, but what we’ve really seen is a wide consolidation. All we can do is expect that to continue . . . until it doesn’t.
Thanks for reading and have a great weekend.
Please share this post if you enjoyed it.
Click here to follow me on Twitter.
Want to receive an alert as soon as the next market commentary is posted?

Sign up for my email list and stay up to date with the latest information on options trading.
Click here to sign up for the list, get a copy of the Theta Trend Options Trading System, the Trade Tacker I use, and information about new systems.
Even better . . . it’s all totally free.