Weekend Market Commentary 2/27/15 – $RUT, $RVX, $SPX, $VIX, $RWO, $TLT, $SCHA
Big Picture:
It worked . . . until it didn’t. This week stocks continued their move higher and it seems like every day for a while now they were run up into the close. Even if price was slightly lower on the day, buyers were coming in during the last half hour of trading and pushing price higher. On Friday, the opposite happened. In the last 20 minutes of trading, stocks sold off and ended their positive week with a down day that closed on the lows of the day. The Russell 2000 was on a 7 day winning streak before the close on Friday, but still looks strong.
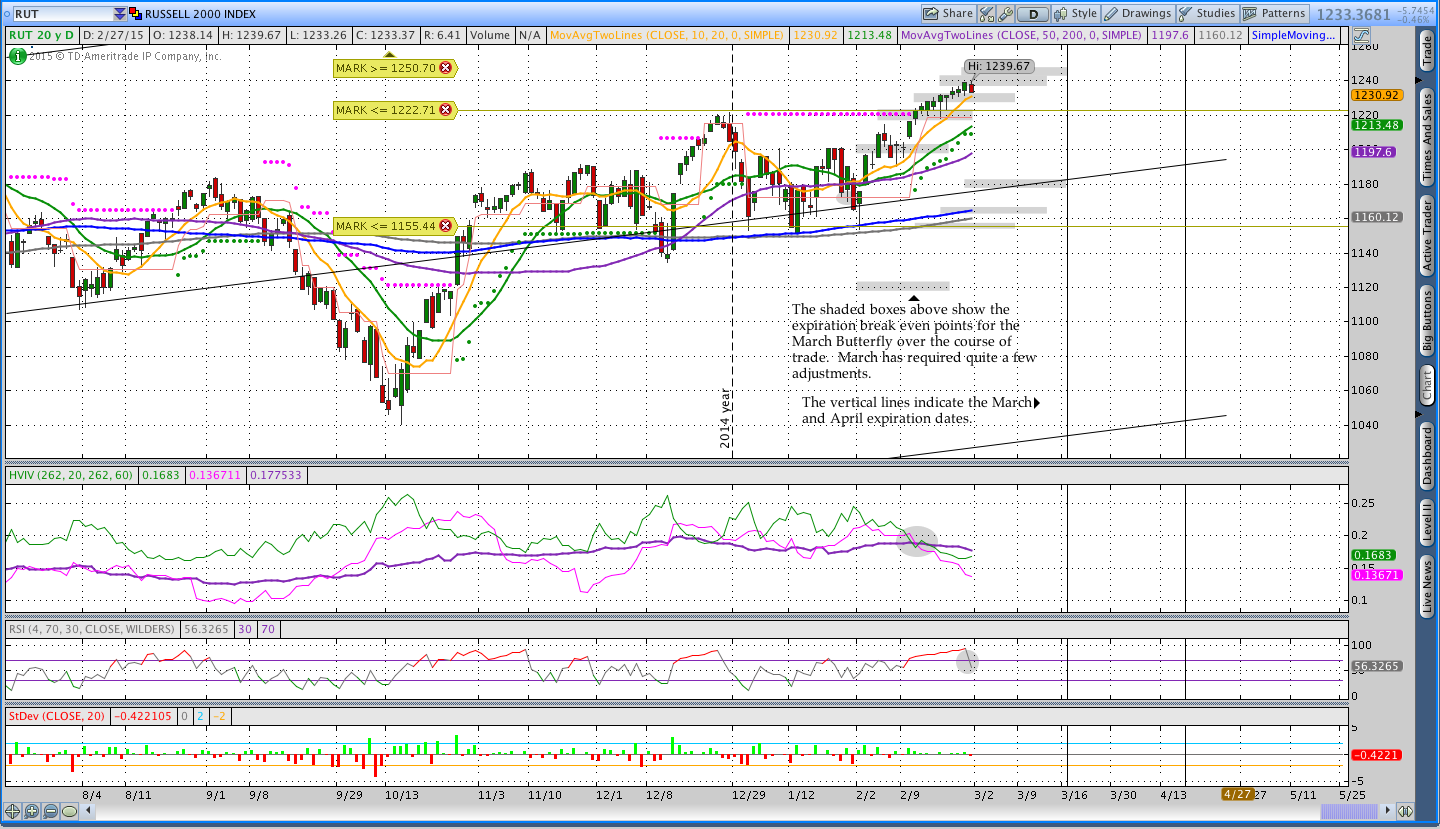
Despite the selling on Friday afternoon, the $VIX closed down on the day and went into the weekend below 14. The Russell 2000 volatility index ($RVX) made a new 3 month low this week in something of a confirmation of the move up. Another thing to point out is the 20 day Historical Volatility on the $RUT fell below 60 day HV and has been trending lower. Generally when shorter term HV falls below longer term HV, we see a calmer sideways to slightly bullish market. (See the daily chart of $RUT in the Options Trading section below).
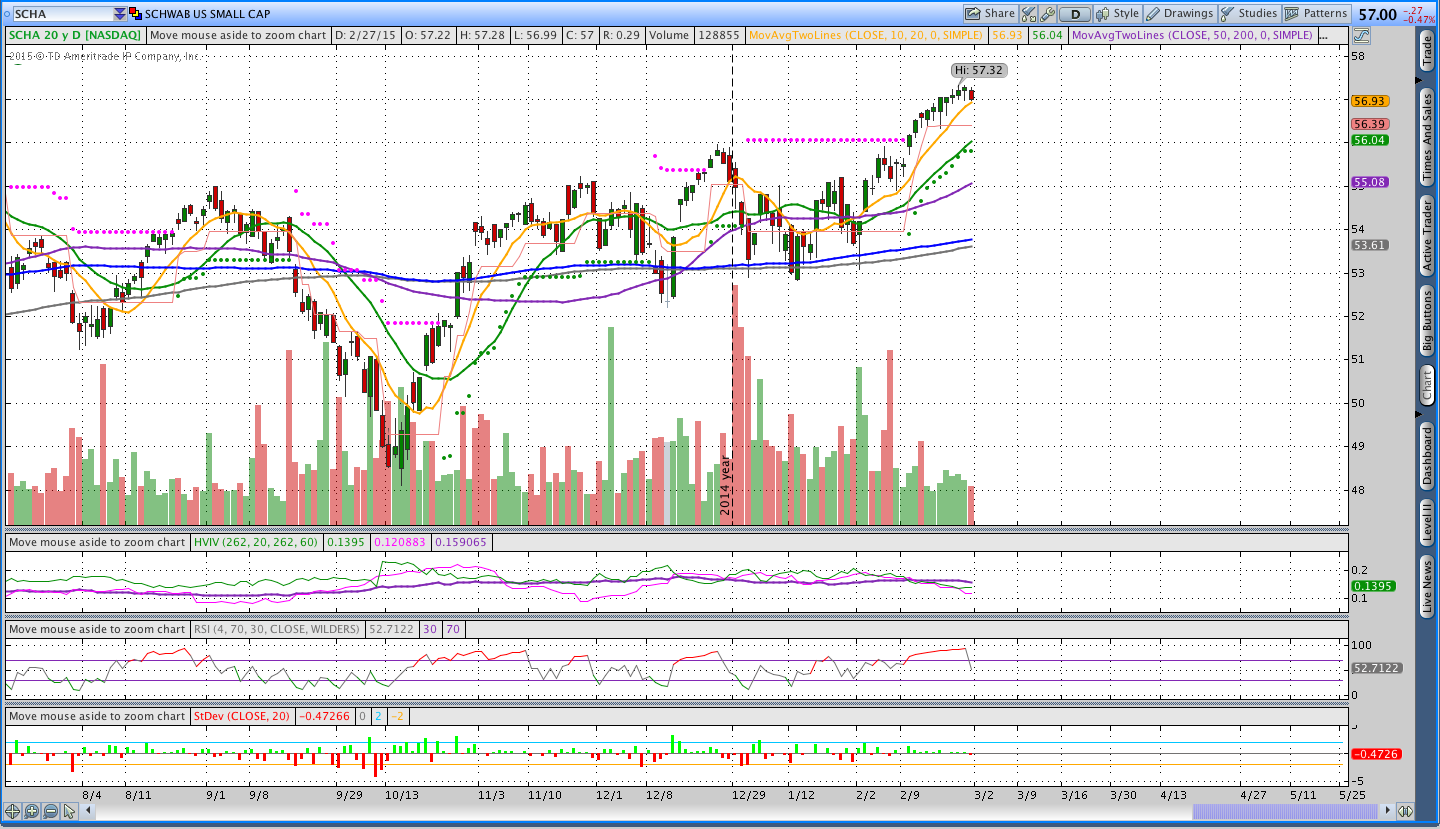
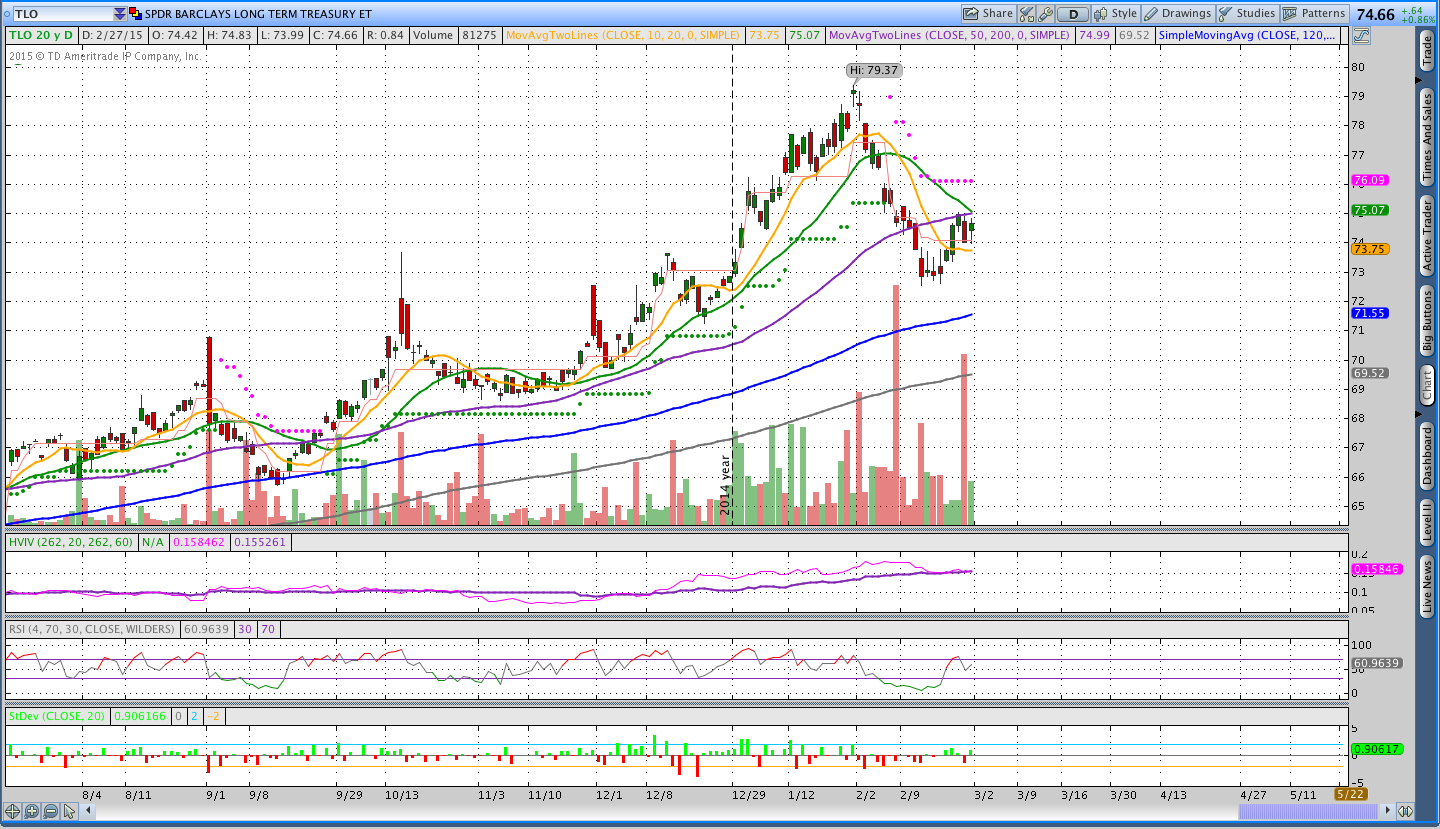
This past week was the end of February and, as a result, I adjusted and updated the ETF Rotation System positions. Earlier in the month I closed out the basic system positions to free up some margin for the Butterfly trades, but the Schwab system is still rolling along. Real estate fell out of the rankings for both systems and Small Cap Equities (Russell 2000) moved in. Bonds ($TLT) finally got a pop and finished the week up over 2%. The month of February was good to Commodities and Stocks.
The Weekly Stats:
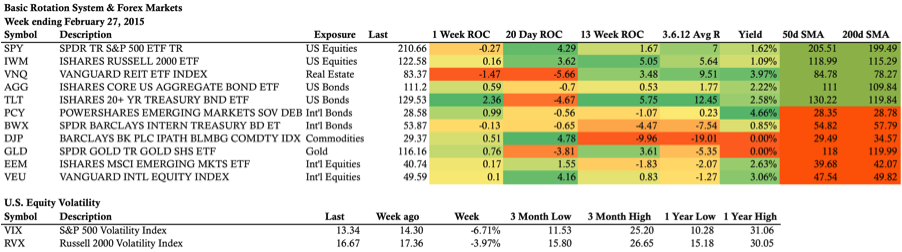
ETF Rotation System Positions:
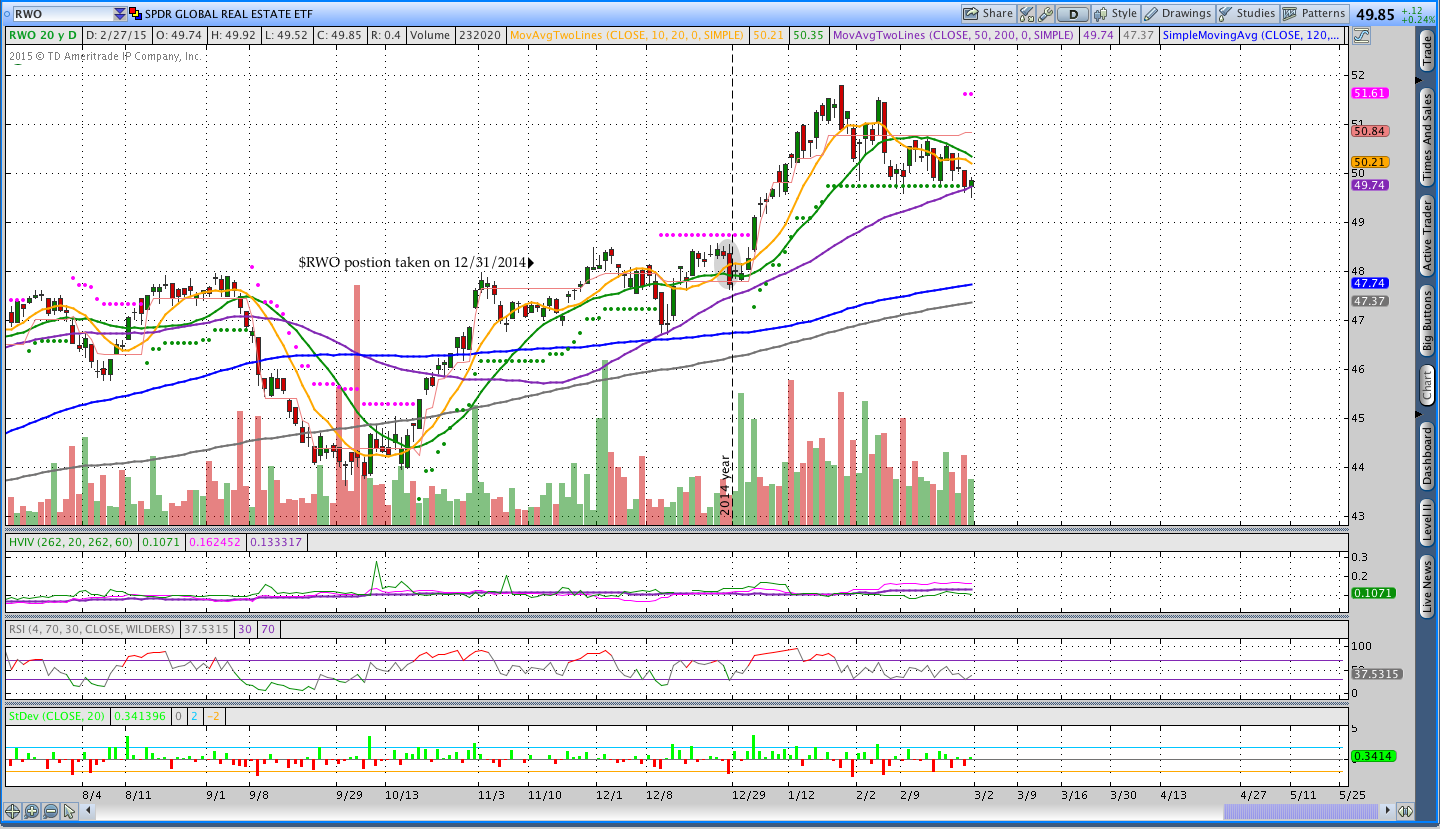
The ETF Rotation Systems had a down month. I’m in the process of selling my house and moving so I haven’t had a chance to push out the February Newsletter yet, but I will have an update on the performance sometime soon. The Schwab System swapped the Real Estate position for Small Cap Equities ($SCHA). The system is also long International Real Estate ($RWO) and Long Term Treasury Bonds ($TLO). Images of the current positions are shown below.
Click here to visit the Market Momentum Newsletter page that covers the systems in more detail.
Options Trading . . .
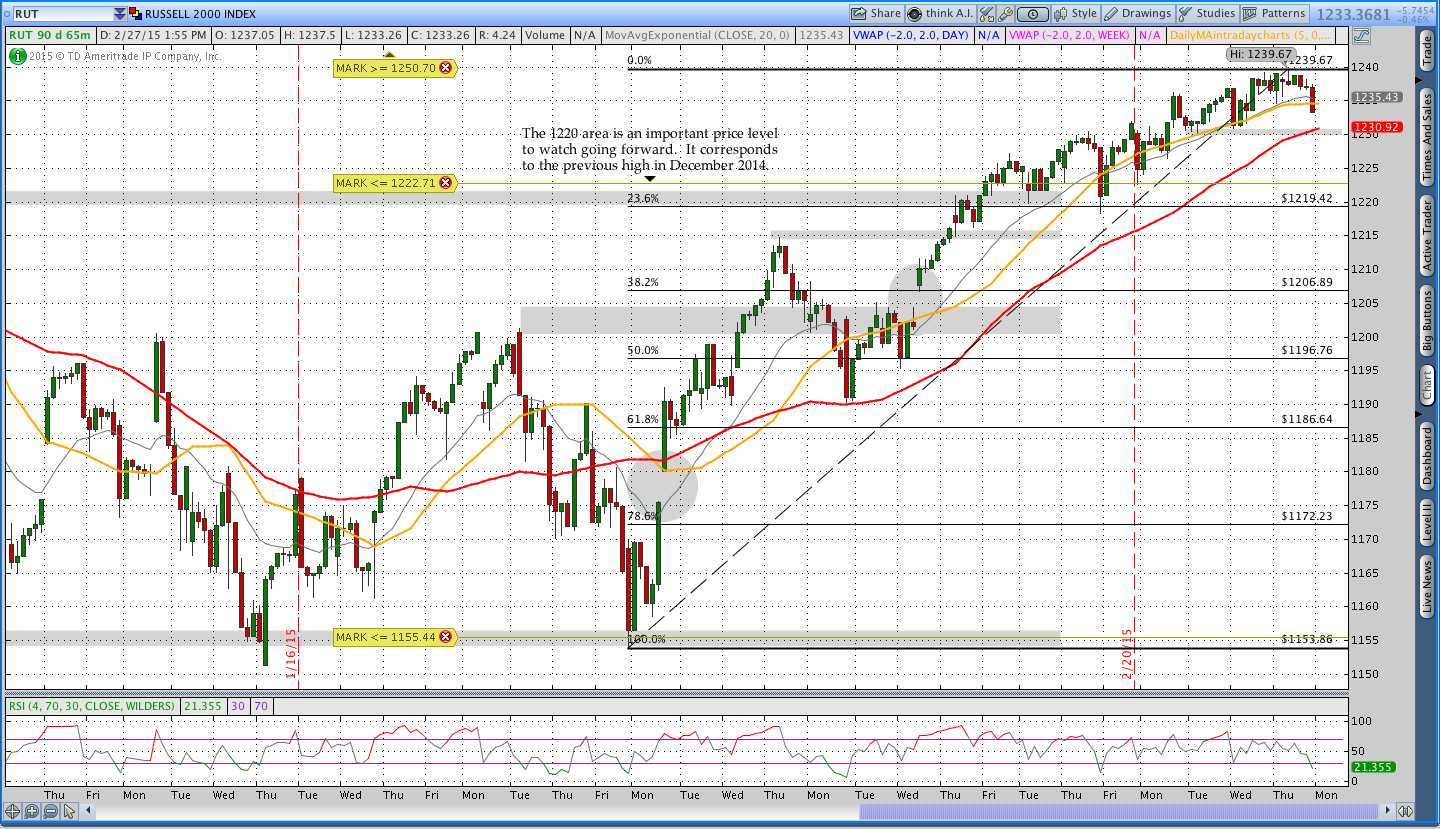
As many of you know, I’ve been leaning a little short delta in my butterfly positions and hoping for something of a pullback. I’ve been forced to make upside adjustments because, despite my willpower, price always does what it wants. The adjustments that I make are generally at specific price levels, but they also involve some discretion about what’s going on in the market. I use an intraday 65 minute chart to get a sense for what’s happening on a shorter term basis. In addition to the 65 minute chart I use 30 minute and 5 minute charts to watch futures. On the shorter term timeframes, I keep a close eye on daily and weekly VWAP (volume weighted average price).
Recently the Russell 2000 has has a few deeper intraday pullbacks, but all of those pullbacks are finding support at key levels. Specifically, the Russell is finding buyers around either weekly VWAP or the rising 5 day moving average. On Friday we had a close below the 5 day moving average and I wouldn’t be surprised to see a slight pullback next week, but I’m not very bearish right now.
Would anyone like a video post that discusses how I look at the shorter term timeframes in the context of options trading? Let me know either in the comments below or via email.
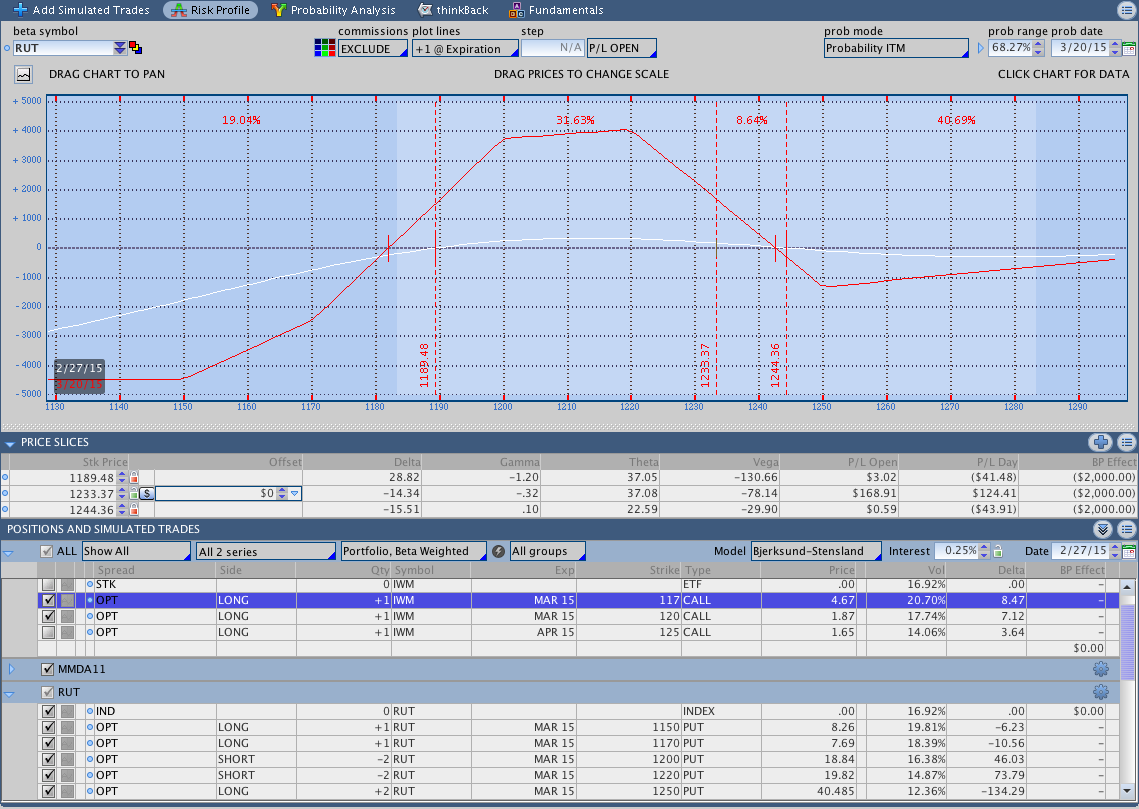
$RUT March 2015 Options Put Butterfly:
The March Butterfly is still open and looks good. I will probably be able to close the trade if we see a little bit of a pullback in the Russell 2000 next week. I entered the trade when $RUT was around 1170 and price is now trading at 1230 so the trade has been moved up, up, and up some more to keep price trapped under the expiration break even line. Fortunately, the position is up money and getting close to expiration. I partially closed the position this week to cut my upside risk and the image below shows the current position including all adjustments.
The links below explain the two most recent adjustments to the trade:
A Simple $RUT Options Butterfly Adjustment to Cut Delta and Risk
I try to tweet out my trades whenever possible so you should click here and follow me on Twitter.
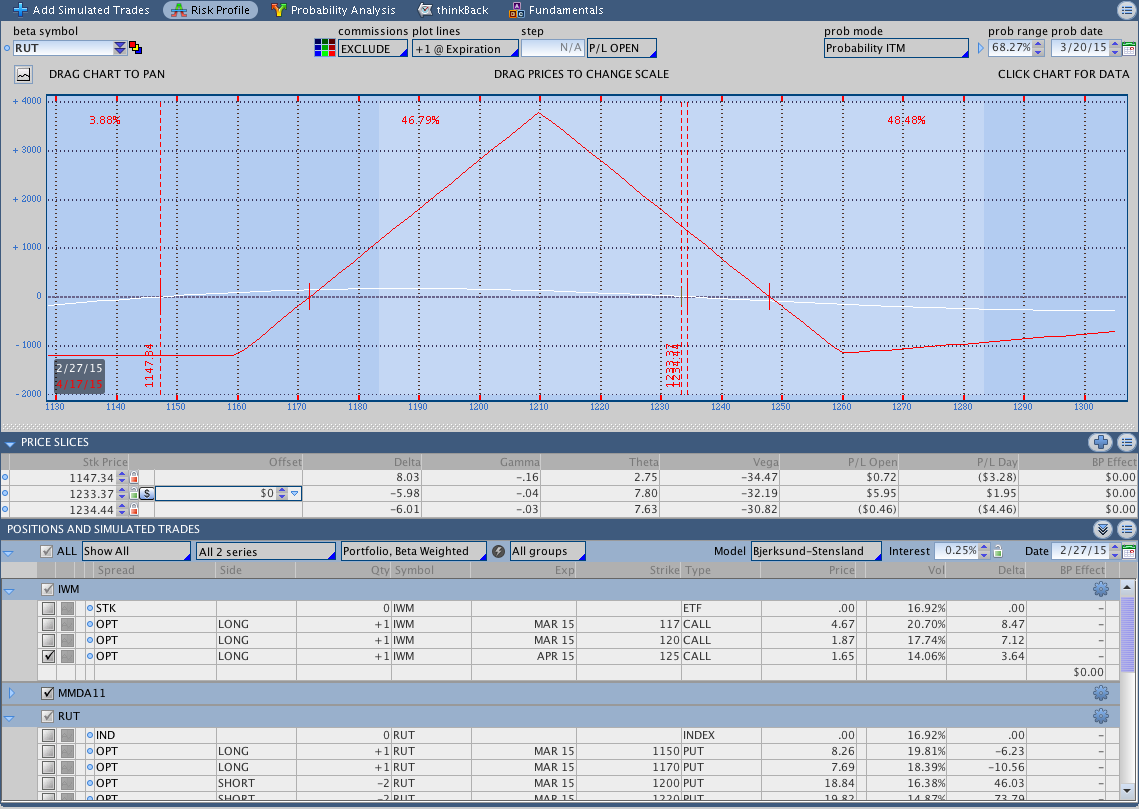
$RUT April 2015 Options Put Butterfly:
The April Butterfly has been a no maintenance trade so far and that’s always a good thing. I entered the neutral to slightly bearish position a few days earlier than usual and $RUT has just grinded a little bit higher since my entry. An image of the position is shown below. Note that the long call is decaying slightly and that’s causing the T+Zero line to drop on the upside. I don’t want to do about the decay right now, but it is something to watch going forward.
Trades This Week:
RUT – Sold to close March 15 1130/1180/1230 Put Butterfly for 8.50
SCHH – Sold to close 117 Shares at 39.61
SCHA – Bought to open 57 Shares at 57.179
ETF, Options, & Forex Inventory:
SCHA – Long 57 Shares from 57.179
RWO – Long 92 Shares from 48.49
RWO – Long 5 Shares from 50.92
TLO – Long 63 Shares from 78.94
RUT – 1150/1200/1250 March 2015 Put Butterfly bought for a 12.20 debit
RUT – March 2015 1170/1220/1260 Broken Wing Put Butterfly for 8.85. Rolled down the 1260 put by selling a 1250/1260 Put Vertical for a 7.15 credit
RUT – April 2015 1160/1210/1260 Put Butterfly bought for a 10.40 debit
IWM – March 2015 120 Call bought for a 1.87 debit (Butterfly Hedge)
IWM – March 2015 117 Call bought for a 4.67 debit (Butterfly Hedge)
IWM – April 2015 125 Call bought for a 1.65 debit (April Butterfly Hedge)
Looking ahead, etc.:
The Russell 2000 closed below it’s rising 5 day moving average this week and that’s generally a reason for a little bit of short term caution in the market. That being said, price is at all time highs and still looks bullish. I’m expecting a little bit of sideways action with some tests of support in the next week, but we’ll need to see what happens. The March options trade is getting closer to expiration and I’m hoping to get out of that position sometime this week. For those of you who missed it, I had a post show up on See It Market this week that you might want to check out.
Have a good rest of the weekend and thanks for reading.
Please share this post if you enjoyed it.
Click here to follow me on Twitter.
Want to receive an alert as soon as the next market commentary is posted?

Sign up for my email list and stay up to date with the latest information on options trading and trend following.
Click here to sign up for the list, get a copy of the Theta Trend Options Trading System, the Trade Tacker I use, and information about new systems.
Even better . . . it’s all totally free.