Understanding Position Sizing For Options Income Trading
The other day I received an email from a reading asking about position sizing. His basic comment was that position sizing is sort of confusing and I can see why it might seem that way. The bad news is that if you’re having questions about position sizing, it means you have a much bigger problem than position sizing itself.
When you take an outright position in an underlying, like buying long stock or an ETF, it’s relatively easy to determine your position sizing. If you have a stop loss in place and know where you’re getting out, you can easily assess your capital at risk. If you know where you want to place your stop, you can back into the number of shares you want to purchase based on the percentage of your account you want to put at risk. For more information on basic position sizing see this post.
However, options trades are different. A defined risk position has a maximum loss at expiration, but that max loss is frequently less than our intended max loss. By “intended” max loss I mean the loss we’re willing to take when we enter the position.
In this post we’ll look at how position sizing works for defined risk options trades like Vertical spreads, Iron Condors, or Butterflies. To get started, let’s look at the short vertical spread below.
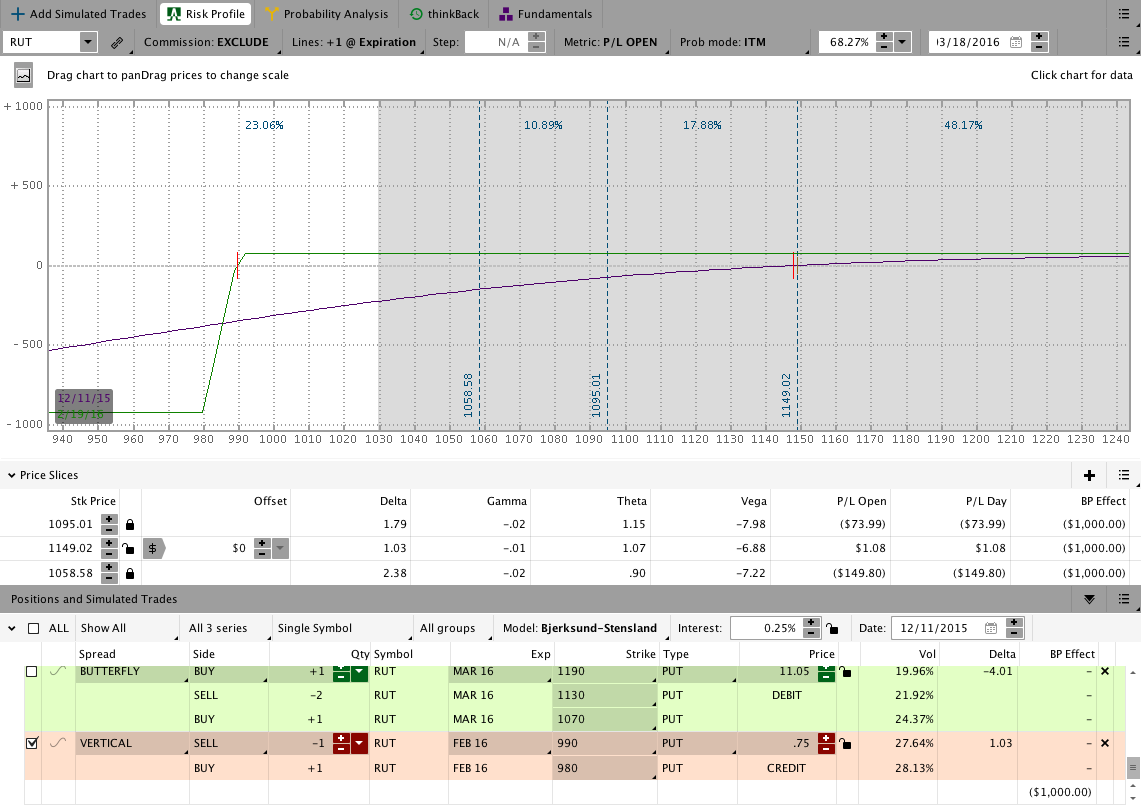
The picture above shows the RUT February 990/980 Put Vertical. At the time the image was taken, the spread was selling the 10 Delta Put and had around 70 days to expiration. Since the spread is 10 points wide and can be sold for a .75 credit, the maximum risk on the position is $925 = $1,000 (max risk) – $75 (credit received). Keep those numbers in mind and we’ll shift gears and come back to them.
How much risk should we take?
I’m a pretty conservative trader and I feel comfortable risking at most 3-4% of my account on a trade that has a high probability of winning like an options income strategy. I risk less when I trade a system that wins less often (like with Trend Following strategies that might only win 40% of the time). Some people are comfortable with more risk and some prefer less. If we convert that 3-4% to dollars, that means a $10,000 account would risk $300-$400 per trade.
In the vertical pictured above, the maximum risk is $925. If someone is trading a small, $10,000 account, a $925 loss represents over 9% of the account. That’s a pretty big loss on a single trade. However, what if we wanted to risk less than 9% and decided 3% ($300 on $10k) was a good number.
With the $300 risk in mind we’re presented with a few choices for the vertical pictured above. We can either sell one spread and risk $300, 2 spreads that risk $150 each, 3 spreads that risk $100 each, 4 that risk $75 each, etc. The specific numbers we chose are less important than the concept.
Applying Risk Choices To A Strategy
The first part of understanding how many contracts to trade is understanding how much you’re willing to risk per contract. In all cases, that should be done prior to placing a trade.
Once you’ve made a decision about your risk per trade, you can apply it to the strategy you’re trading. Using a simple example like a vertical spread, you could manage the position based on the initial credit. For example, say you sold the spread for .75, you could choose to take the position off when the credit doubles to 1.50 meaning your open loss is $75. You could also choose to wait until the open loss is twice the initial credit or $150. Those options are illustrated with the price slices shown in the image above. The major point is that you need to know what your stop point is BEFORE you can determine how many contracts to trade.
Once you know your risk per contract and the percentage of your account you want to risk, the math is simple. If you want to risk $300 and you maximum loss per contract is $150, you can trade two contracts. All we’re doing is taking the maximum risk per trade divided by the risk per contract. If you know your risk per contract, it’s simple. If you don’t know your risk per contract, it isn’t.
Using a specific strategy (the CIB) as an example:
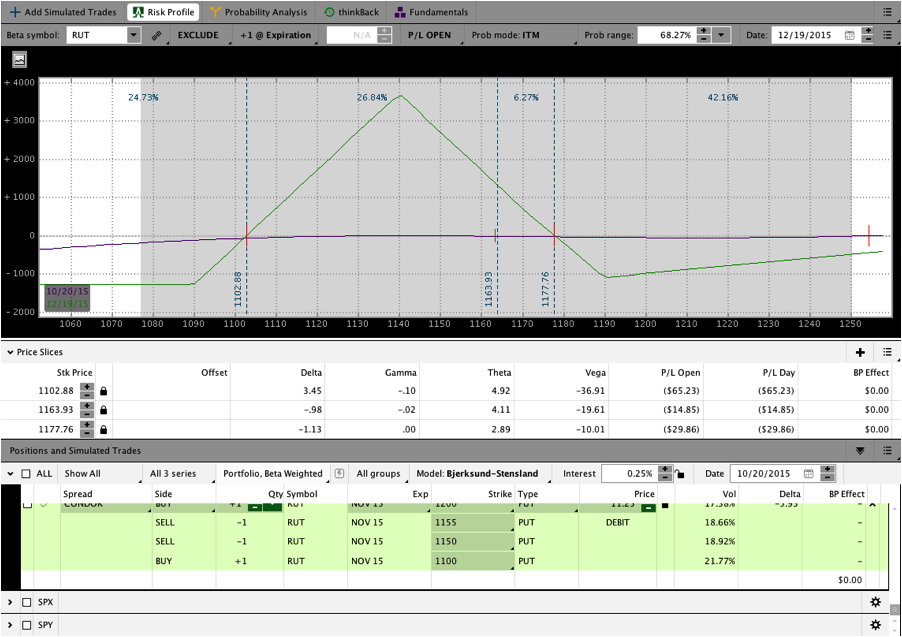
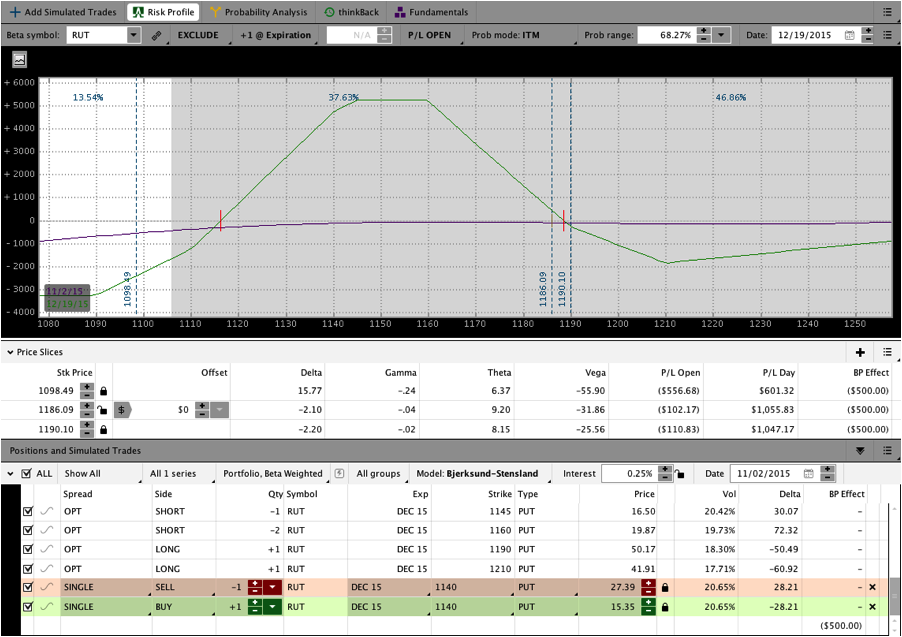
As many of you know, I like strategies that have a flat T+Zero line like the CIB. The image below shows a few different stages of the CIB trade.
Stage 1 – Entry:
Stage 2 – Adjustment #1:
Stage 3 – Adjustment #2:
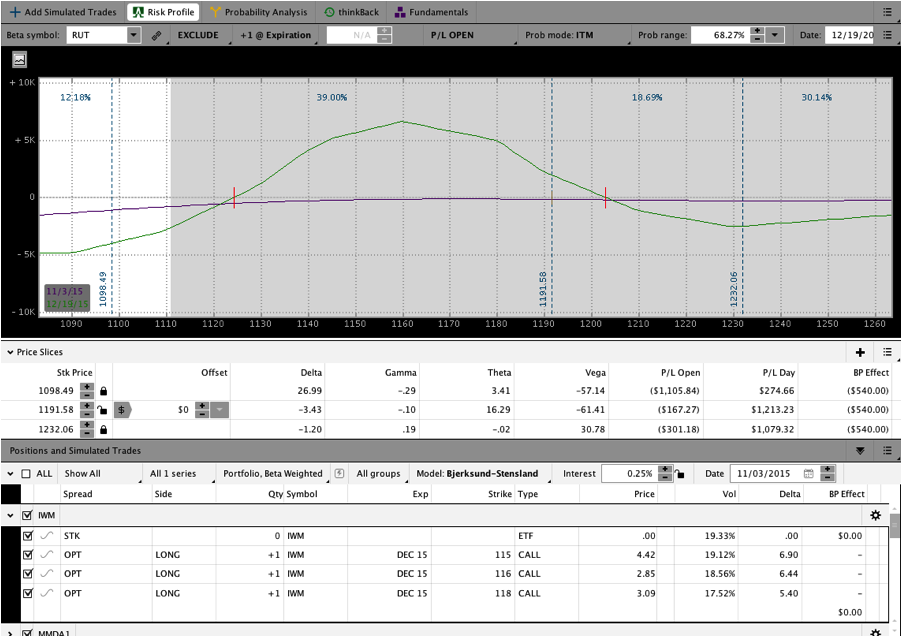
When you first glance at the images above, it seems like it would be really hard to determine how to size your position. After all, there are a bunch of Butterflies and the number changes over the course of the trade. Guess what? It’s actually quite simple. It’s simple because the maximum loss is determined prior to placing the initial trade. If at any time the trade exceeds the maximum loss, the position is simply closed. Easy. Done.
In the case of the Core Income Butterfly (also here), I decided on a maximum risk of $300 with the same maximum gain. I frequently let my winning trades run over the $300 number a bit to pay for commissions, but the general rule holds.
Knowing that my maximum risk is $300 also allows me to calculate the number of positions I can trade. The CIB begins as a single Butterfly, but it can grow up to 3 in size as the trade progresses. I do sort of prefer a 2 Butterfly version, but that’s beyond the scope of this post. Since I’m willing to risk 3-4% per high probability trade and the maximum risk on a CIB is $300 per position, that means I can trade one CIB per $10,000 in capital. In order for the trade to actually hit the $300 number, the market needs to move quite a bit. On the downside, it’s unlikely to happen unless there’s a catastrophic gap lower.
How many contracts can you trade?
Did you notice that I didn’t say you can trade 2 verticals per $10,000 or something similar above? The reason is that it depends on your strategy and that’s the most important aspect of this post. You need to have a strategy prior to placing a trade in order to know if you have enough contracts, not enough, and when you’re getting out. Without that, the market will take your money. Maybe not today and maybe not tomorrow, but someday it will. If you aren’t sure how many contracts you can trade, it’s because you haven’t determined your acceptable risk per trade. If you know the acceptable risk, position sizing is relatively simple.
Going back to the vertical spread example, you need to decide when you’re making an adjustment or closing the trade. You also need to know the maximum loss you’re willing to take. You can base your risk per spread on the market price, the price of the credit, delta, whatever, but there needs to be some way of determining risk per spread in advance. Hell, you can even say taking the maximum loss is acceptable risk if that’s your plan and you size the trade appropriately.
The take away is to have a strategy and a plan. That plan should be designed with positive expectancy in mind, but we’ll save that discussion for another post. Know your intended risk per contract prior to placing a trade and know how much of your account that loss represents. If you really want to hold yourself accountable, make sure those numbers are written down in advance so you don’t try to “figure it out” after you’re in the trade.
Next up . . . we’ll revisit the vertical spread and talk about creating a positive expectancy system.