3 Steps to Normalize Risk Using Volatility Adjusted Position Sizing
Overview:

One of the biggest challenges in trading is knowing how big to trade or how to size positions. If you knew with 100% certainty that your next trade would be a winner, you could theoretically go full tilt boogie with leverage and have a big payday. The reality of trading is that we don’t know whether the next trade will be a winning trade or not. As a result, making positive expectancy bets over time is what enables us to stay in the game and ultimately allows us to make money. In order to continue trading, it’s essential to not bet “too much” on any one trade.
A common rule in trend following systems is to never risk more than 1-2% on any one trade. If you size you positions so that you never risk more than 1-2%, you can take quite a few consecutive losses before things get bad. Note that the percentage risked per trade has significant implications for all trading systems and this article is using a static number rather than discussing the impact of bet size on a trading system. Percentage risk per trade will be approached in another post.
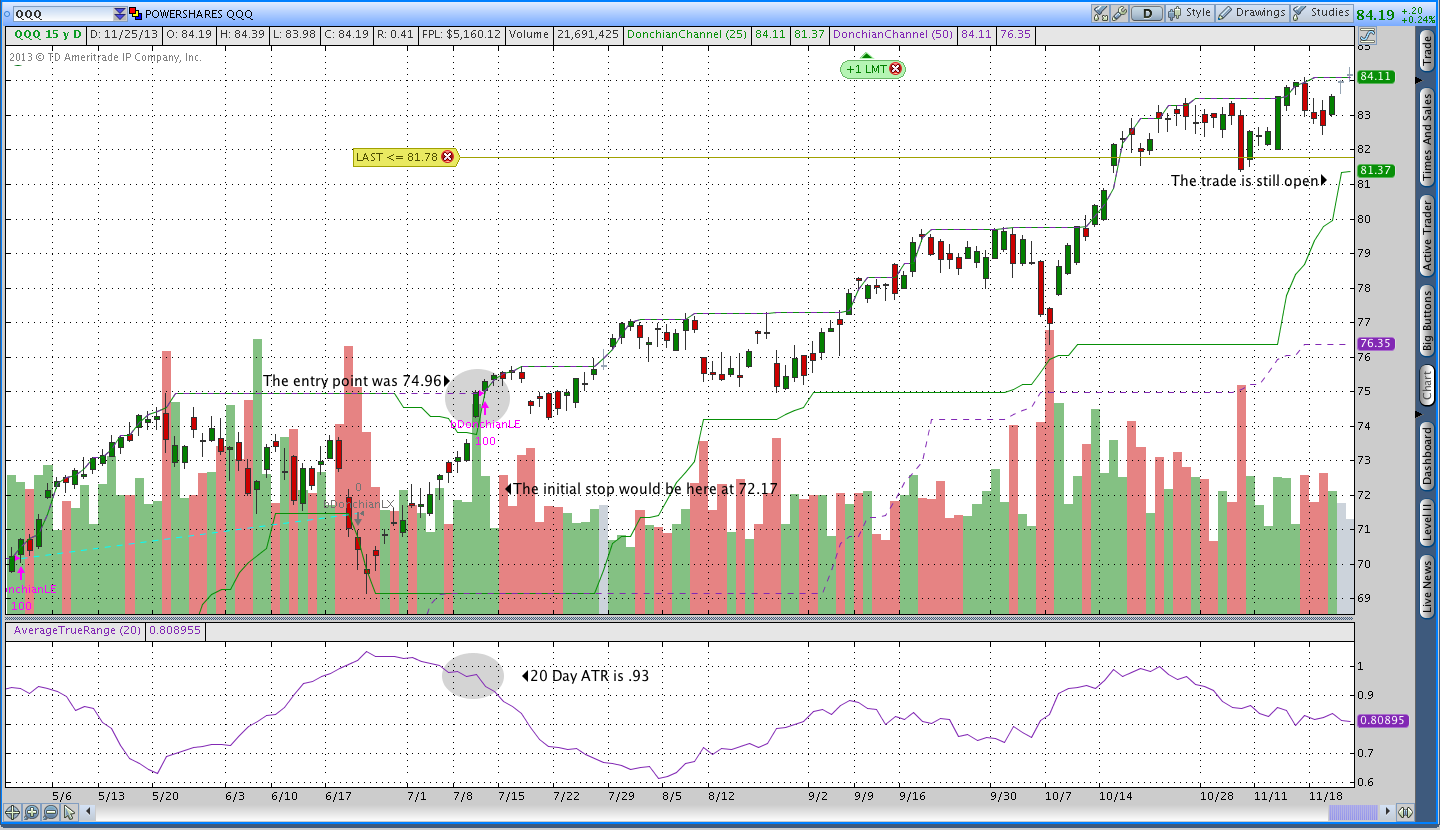
Volatility adjusted position sizing takes that 1-2% you’ve decided to risk and normalizes it across all markets. By normalizing the risk, you can risk the same amount in Bonds, Gold, Oil, Stocks, etc. In addition to risking the same amount, your stop is consistent across markets in terms of average true range or whatever other indicator you use for a stop. Intuitively what we’re trying to do is trade all markets the same way and with the same amount of risk. I’ll work through a numerical example that goes through the calculation of an initial stop using average true range. The image below with the Donchian Channel trading system helps illustrate the steps that follow.
Step 1 – Determine Your Risk Percentage
The percentage (of account equity) you choose to risk has huge implications. In a profitable trading system, as you increase your risk size both returns and equity volatility increase up to a point. At some point, returns begin to decrease because the system can’t recover from drawdowns. Finding the optimal risk percentage is a combination of both the math and what you’re comfortable trading. Many trend following trading systems use 1% of equity as their risk amount, so I’ll use that amount for this example.
Step 2 – Normalize Risk Across Numerous Assets
The second step in volatility adjusted position sizing is determine how to normalize the risk. Using an outright amount like $1 or 3% won’t create the uniform risk we want. For example, a $1 stop on a $100+ ETF (like IWM) has a very different effect than a $1 stop on a $35 ETF (USO). A percentage stop has similar limitations because the likelihood of the stop being hit is entirely dependent on the volatility of the underlying market. An intuitive way to think about the percentage stop limitation is that Biotech stocks tend to have greater percentage moves than Blue Chip stocks and would be more likely to hit a percentage stop. As a result, we need to normalize the risk and take into consideration different levels of volatility in different markets.
A great indicator to normalize daily movement is average true range. Without going into the details of the calculation, we can think about average true range as the amount the underlying moves on a daily basis. For example, IWM has an average true range of 1.44 and USO has an ATR of .47.
In my Donchian Channel System, the initial stop is place 3 times the 20 day average true range away from the market. What that means is that I take the daily average true range and multiply it by 3, then I take that amount and subtract it from the entry price.
Step 3 – Calculate Volatility Adjusted Position Size
Ok, this is where it all comes together and we figure out how many shares, contracts, or lots to trade. Let’s say that we have a $10,000 account and we’re willing to risk 1.5% per trade, which means our maximum risk per trade is $150. We’ll also assume that a one way commission is $5 and I’m going to refer back to the QQQ Donchian Breakout pictured above.
We can determine our position size using the following formula:
($Risk per trade – Commission)/Stop Value = # of Shares
In the QQQ Donchian Breakout example this translates to:
(150 – 10) / (.93*3) = 50.18 Shares, which rounds down to 50
Big Assumption – The Stop Value calculation works because the value of a $1 QQQ move equals $1. In some situations, think futures, a $1 move is equal to greater than $1. In those situations, the Stop value needs to be multiplied by the value of a $1 move. For example, a $1 move in the E-Mini S&P is worth $50 and the stop value calculation would be:
Stop Value = (ATR * 3 * Tick Value)
Stop Value = (14.22 * 3 * 50) = $2,133
To take the example one step further, if we want to risk at most 1.5%, we need an account size of at least $142,200 to trade one S&P futures contract using a 3*ATR trailing stop with 1.5% risk per trade.
What you get out of this:
If you apply the steps above, you create consistent risk regardless of what market you’re trading. With consistent risk across multiple markets, you can trade a diversified group of markets without being heavily weighted in any one sector. However, a huge driver in the success of a trading system is amount risked per trade. An increased risk will lead to an increased return up to some point. After crossing the point of maximum returns, increasing risk will lead to decreased returns as the system fails to recover from drawdowns. The percentage risked per trade is so significant that it really shouldn’t be an arbitrary number and that will be the subject of another post. Stay tuned.