Options & Volatility Outlook For March 10, 2015
Around this time last week, the Russell 2000 and the S&P 500 were near all time highs and looked like they might push even higher. However, as I noted in Volatility Might Be Flashing A Warning Sign For Stocks, I had some concerns about the strength of the market as it made new highs. Even though Volatility isn’t a predictor of price direction, it does exhibit some patterns that are worth considering.
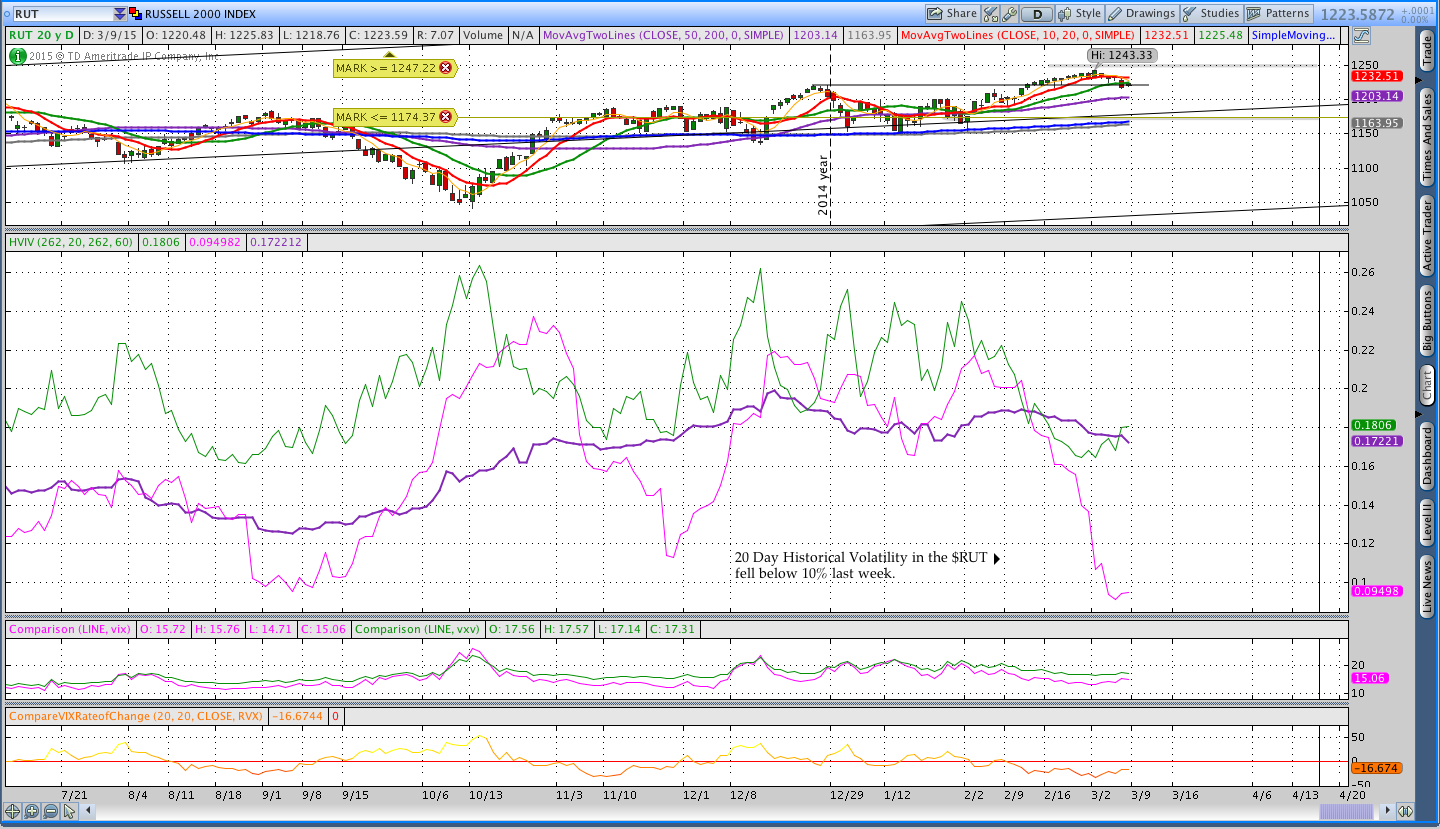
One of the most important observations about Historical and Implied Volatility is that they rise and fall, but also revert to a longer term mean. We know that periods of low HV will tend to be followed by an increase in HV. While that doesn’t always suggest lower prices, stocks are generally more volatile when they decline in price. Over the weekend in my Weekly Market Commentary, I mentioned that 20 day Historical Volatility in the Russell 2000 had collapsed to less than 10%. That is an extremely low level for the Russell and suggests, if nothing else, that volatility should increase. The image below has an expanded volatility panel that shows 20 day HV (pink), 60 day HV (purple), and Implied Volatility (green) for the $RUT.
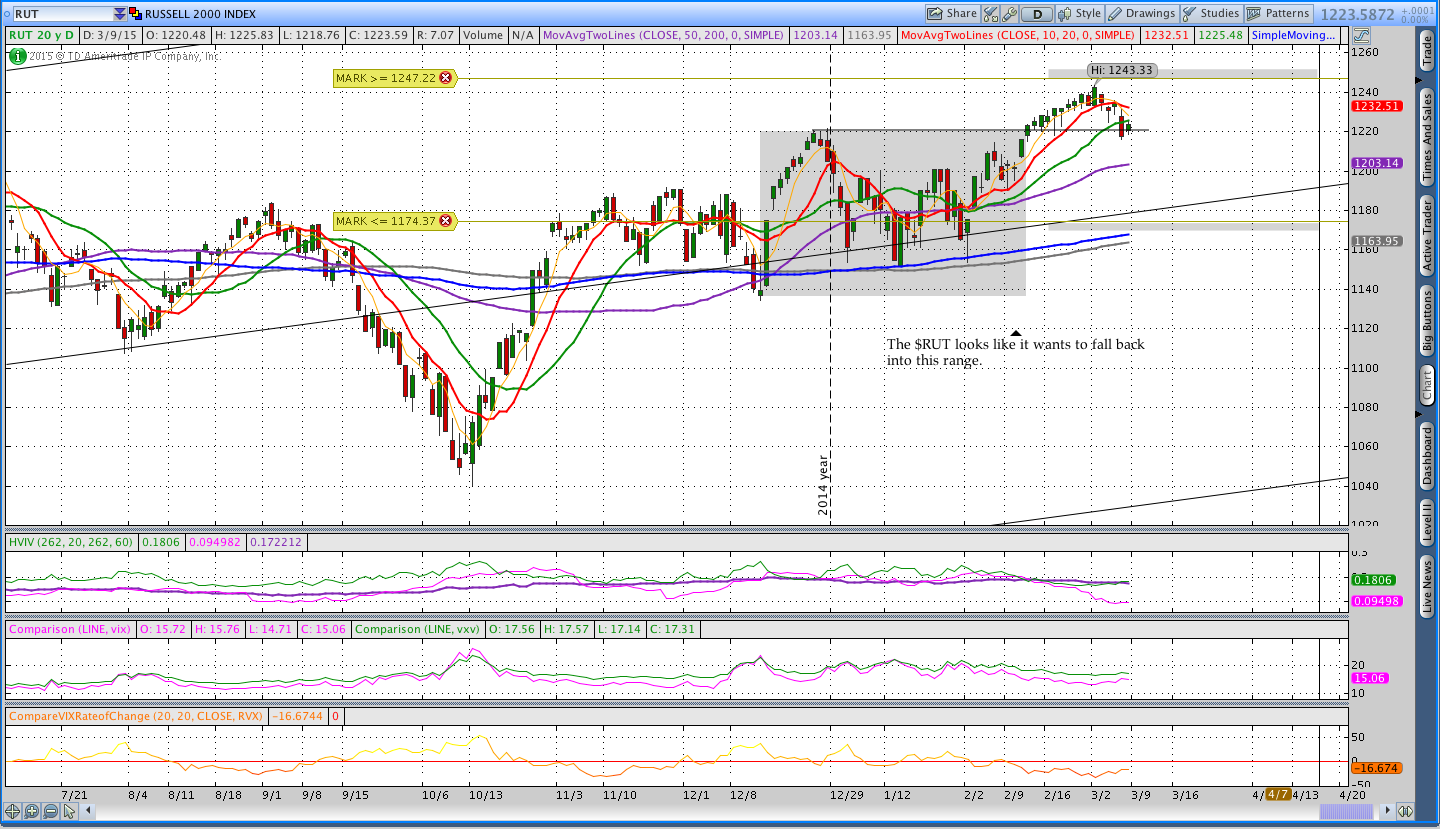
In the Volatility panel above, we can see that all three types of volatility have been declining in the $RUT over the past few weeks. However, the big drop in 20 day HV suggests that things have gotten a little too quiet. As a result, it’s reasonable to expect an increase in daily price swings, but it seems a little premature to get bearish on the market. In the price chart below we can see that the Russell looks like it’s ready to fall back into the 3 month range it just left.

Even through price seems to want to trade lower and we’re expecting an increase in daily price swings that will translate into higher HV, price is still in a primary uptrend. We’re seeing some short term weakness in price with $RUT trading below the 5, 10, and 20 day moving averages, but the longer term 50, 100, and 200 day moving averages are bullishly arranged and sloping up. The conflicting signals we’re seeing in price and volatility suggest more range bound price action with larger price swings as the market tries to find direction. From a neutral to bearish options traders standpoint, the market should provide some good opportunities as long as we don’t see a sharp increase in 20 day HV. The next warning sign for options traders will be when 20 day HV trades back above 60 day HV. Until then, slightly short Delta positive Theta positions should work nicely.
This post originally appeared on See It Market and is going to be a mid week look at Volatility and Index Options that will be published there around Tuesday or Wednesday of each week.
