Weekend Market Commentary 3/6/15 – A Little Too Quiet $RUT, $RVX, $SPX, $VIX
Changes:
Well, it’s Saturday and that means it’s time to dig into some of the changes for the Weekend Commentary. Earlier this week I wrote about the motivation for the changes in What I’ve Learned From Living Wrong so you might want to read that if you haven’t already (or not). The changes I discussed in that post are largely about listening to what feels right and what doesn’t.
When I started the Theta Trend blog, my focus was on Trend Following strategies and options trading. Over the years, we’ve talked about a large number of topics including and beyond Trend Following and options trading. However, it seems like we’ve gone slightly astray at times and I’m going to refocus our discussion. Going forward, we’re going to focus on options trading with an awareness of trend. In some cases that type of trading is trend following in nature and sometimes it’s delta neutral (non-directional). The toolkit we’re using to evaluate the markets will change slightly and you’ll also see some changes to the organization of the site.
My belief is that having more cohesive content will allow us to dig deeper and, ultimately, increase the value of the information on the site. I’m always looking for ways to improve and I appreciate your feedback so please get in touch and let me know what you think.
On to the markets . . .
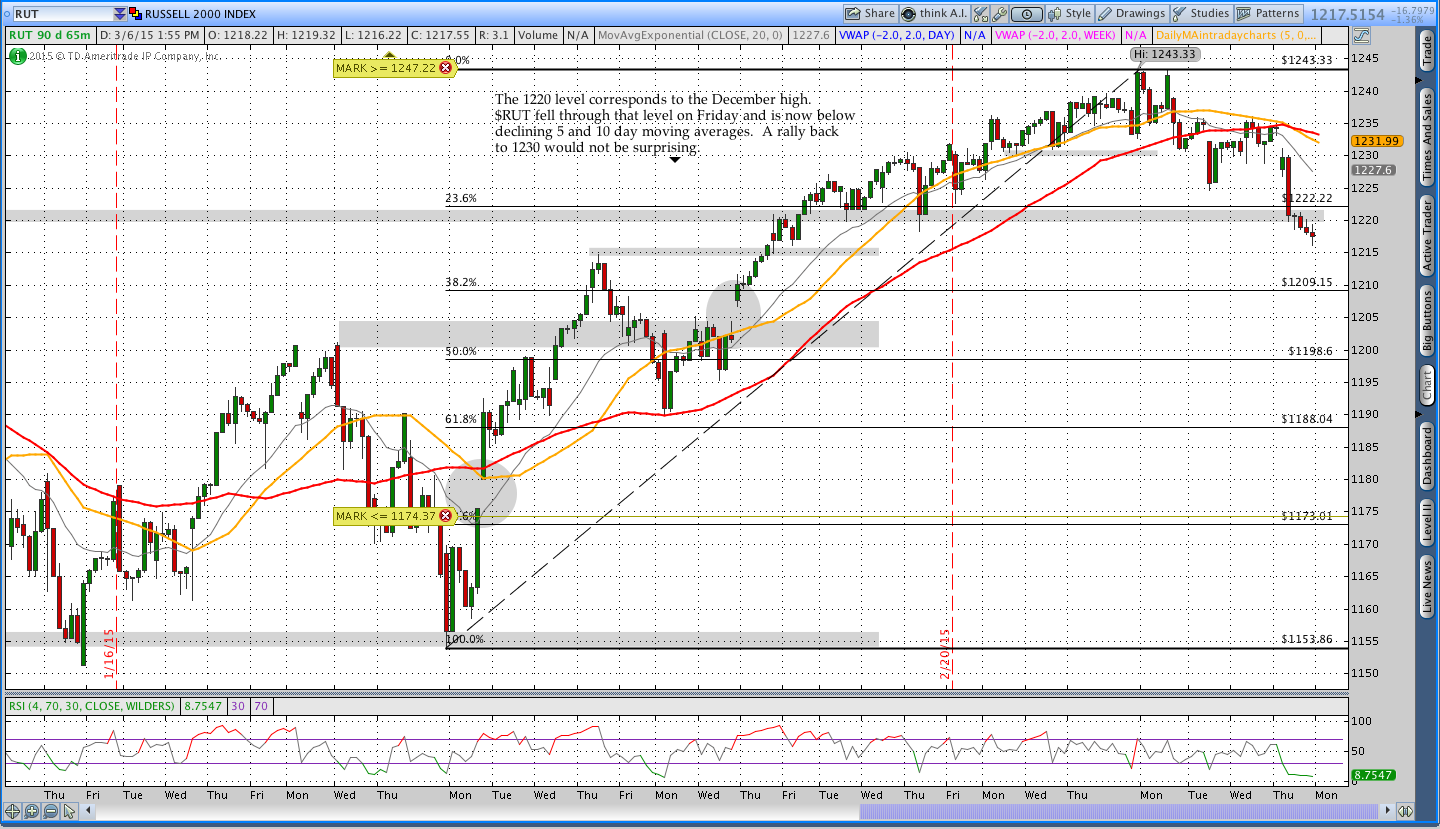
After several weeks of creeping higher, the U.S. Equity markets pulled back on Friday. If you recall, last week I mentioned that the Russell 2000 closed below the 5 day moving average and that was a reason for some short term caution in the markets. You were warned.
Supposedly the move on Friday was a reaction to some better than expected fundamental information that left participants expecting the Fed to hike rates sooner rather than later. Bonds, stocks, and gold all took big hits and it seems like the only thing anyone wanted to buy was the U.S. Dollar. We never know why markets move, but they do move in reaction to news releases. I take that statement back. Markets move when there is an imbalance of buyers or sellers that causes price to head higher or lower. The explanations we get from the media are “nice,” but understanding why something has already happened has limited, if any, value from a trading standpoint.
From a shorter term technical perspective, the markets seemed a little out of breath coming into the week and were sitting around their 5 day moving averages. The 5 and 10 day moving averages are usually the first to fail and also the first to provide resistance and/or support. Last Friday the Russell closed below the 5 day moving average, which was the first sign of weakness. Early this week, we saw the Russell push to a new high and immediately fall back in a move that seemed more like a stop run than a new high with legitimate buyers. After the push higher, the Russell decided to retest the 5 day moving average before giving it up and making a lower low on the 65 minute timeframe.
The Russell is now below a declining 5 and 10 day moving average while sitting close to all time highs. Short term caution is warranted, but the tide is still bullish.
Market Stats:
At the time of writing, the ThinkOrSwim software was not working correctly and would not update some custom statistics I usually present. As a result, the market stats below are very abbreviated. Unfortunately, TOS seems to like doing their IT maintenance on Saturday mornings.
VIX Futures Term Structure:
We haven’t talked very much about the VIX Futures term structure on the blog, but that will be changing in the coming weeks. The term structure of futures contracts shows the relative prices of front through back month contracts. Most futures markets represent a cost of carry combined with some component of market expectation. However, there is no cost of carry for the VIX so the futures just represent information about market expectations for future volatility. A post will be showing up sometime soon to discuss VIX Futures in more detail.
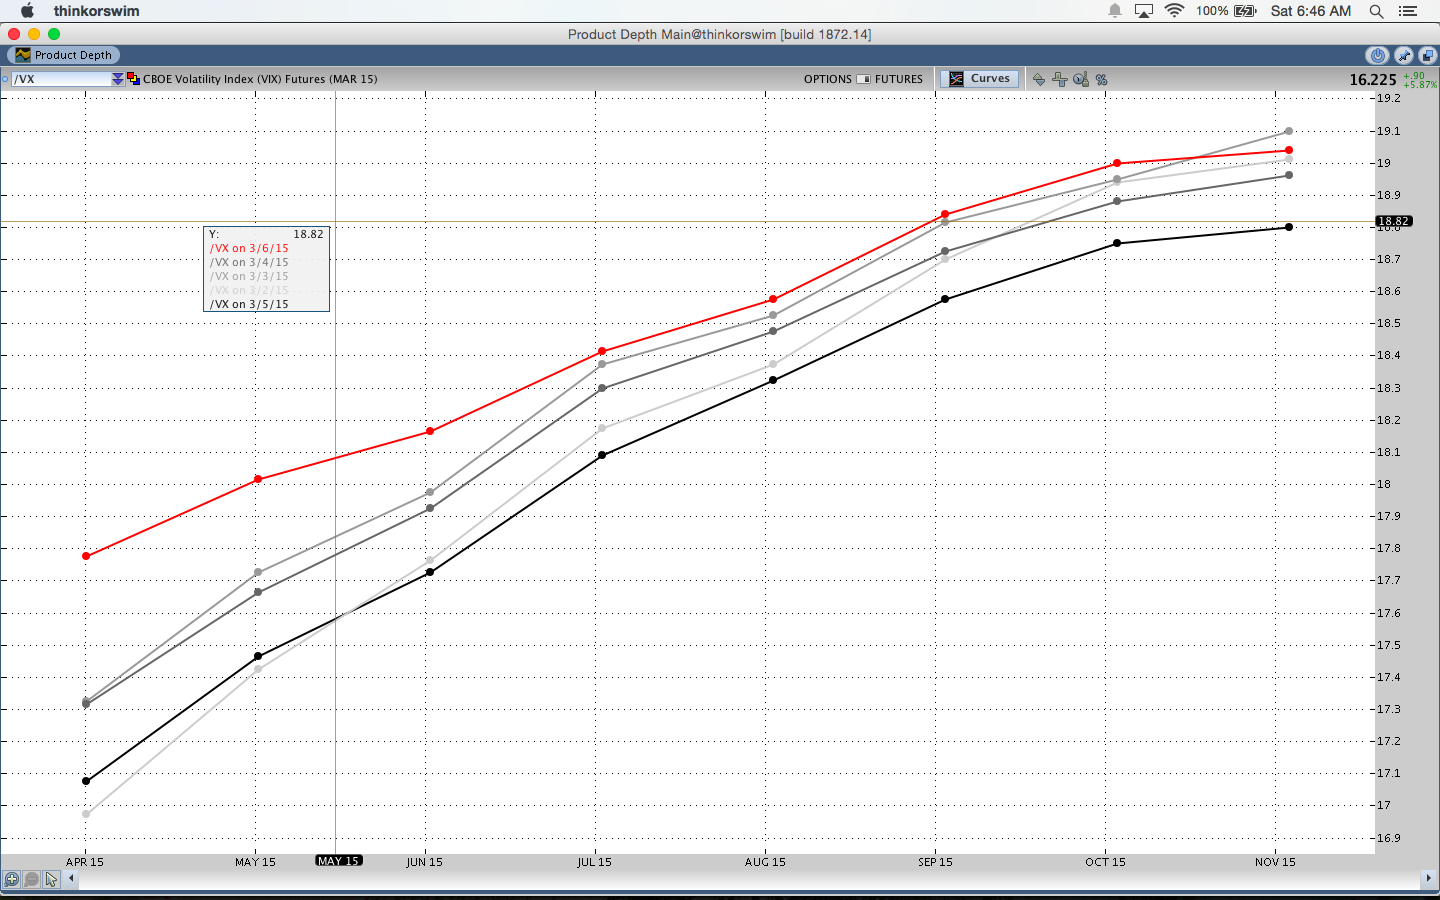
The image below shows a week of the VIX Futures Term Structure. The gray lines become darker on subsequent days of the week and finish with a red line for Friday. The curve shifted up and flattened significantly on Friday as the near term futures rose more than the further dated contracts. In other words, the short term outlook for volatility increased in response to the move.
Implied & Historical Volatility:
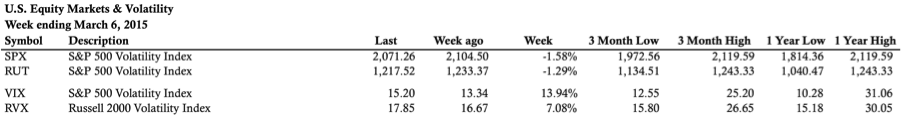
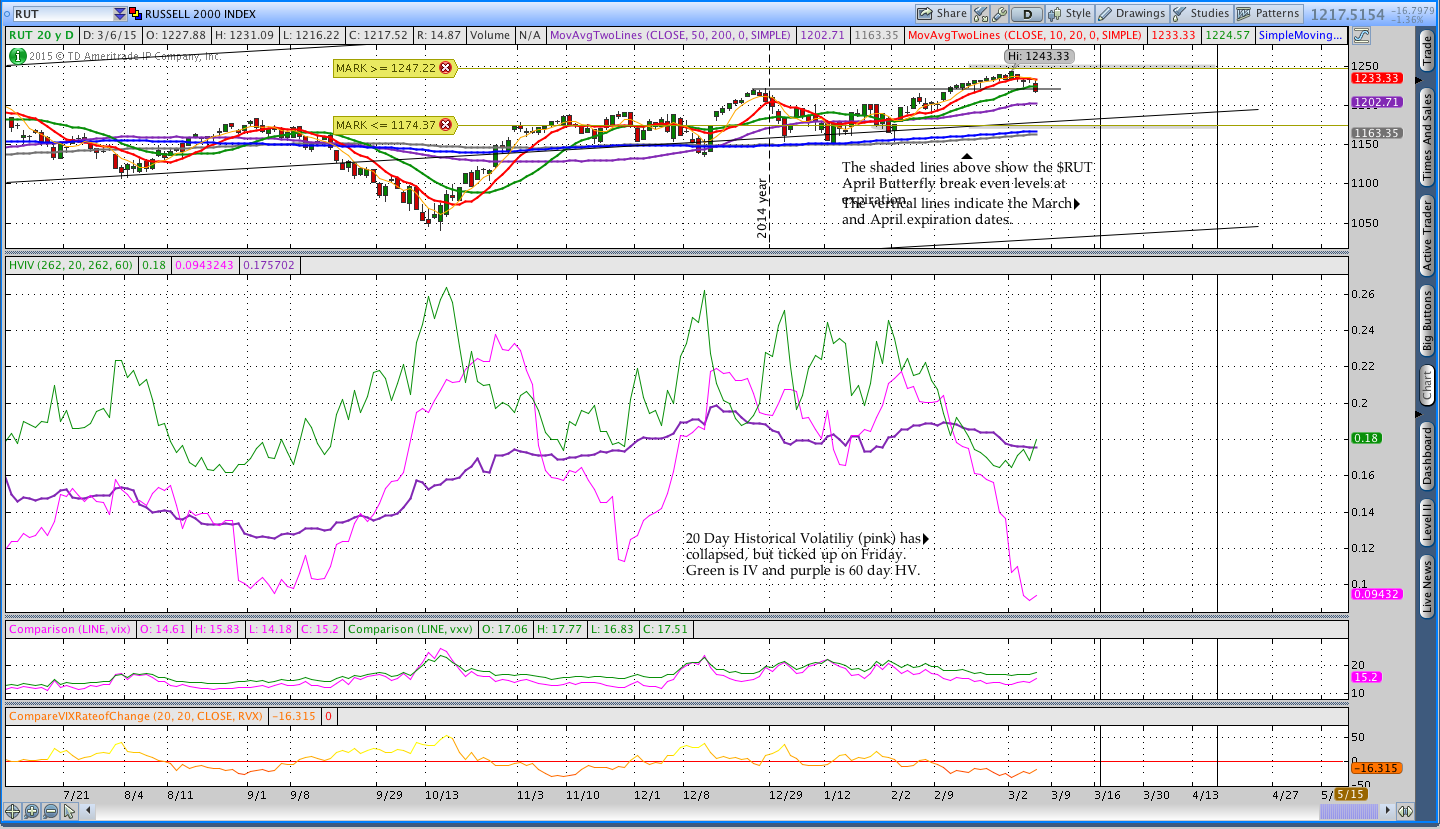
From a volatility standpoint, the break on Friday should not have been a surprise. 20 day historical volatility in the Russell 2000 collapsed below 10% and that means things have gotten a little too quiet. If you recall from this post, historical volatility represents the annualized standard deviation of returns over a window of time. When HV falls, it suggests the standard deviation of returns has decreased. While it can be difficult to predict price, we can expect some markets to move more than others and, consequently, have a higher historical volatility. We don’t know what direction the market will head when 20 day HV in $RUT falls below 10%, but we can reasonably expect volatility to increase.
Under the hood . . .
The “Under the Hood” section of the commentary focuses on actual trades that are in the Theta Trend sample account.
On Monday I closed the March $RUT Butterfly for a pre-commission gain of around $250. Closing the trade on Monday was the wrong move and the position would have made significantly more money if held until Friday. The trade required several upside adjustments and I’ll have a post to discuss the trade in more detail soon.
I try to tweet out my trades whenever possible so you should click here and follow me on Twitter.
$RUT April 2015 Options Put Butterfly:
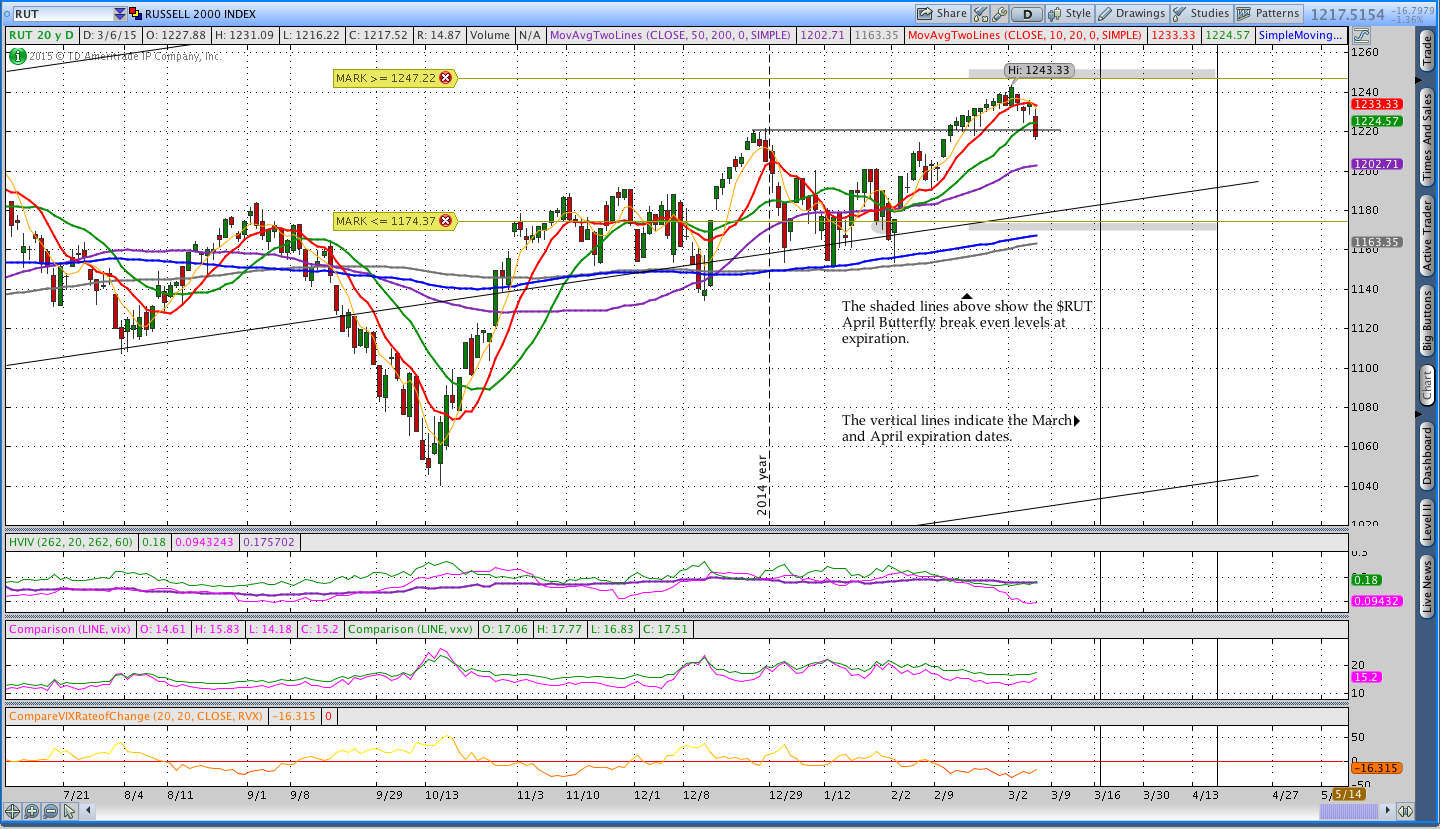
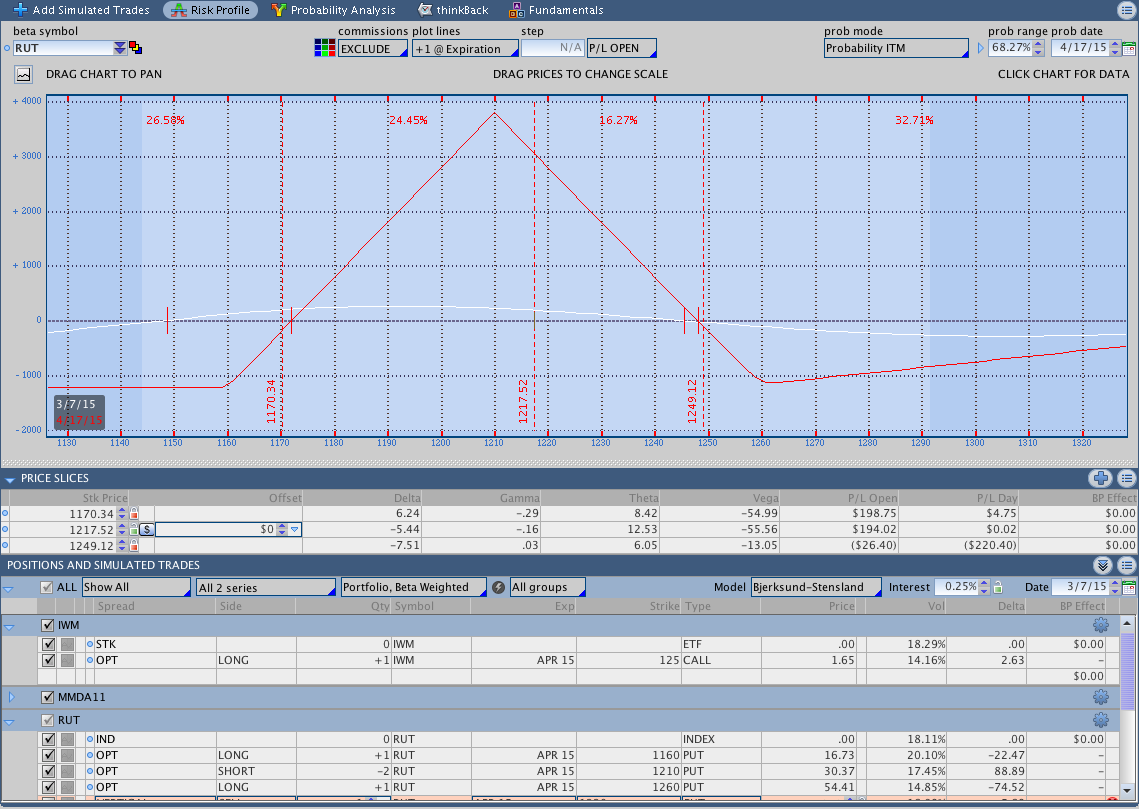
The April $RUT Butterfly is still open and doing well after the move lower on Friday. The Greeks are under control and, as usual, the risk I’m concerned about is more on the upside than the downside. I’m keeping an eye on the T+Zero line fairly closely because a move back into the 1240-1250 area will begin to put the trade under pressure. The only adjustment I would consider at this point would be to roll down the long call to protect the upside a little better.
$SPY March Quarterly Butterfly:
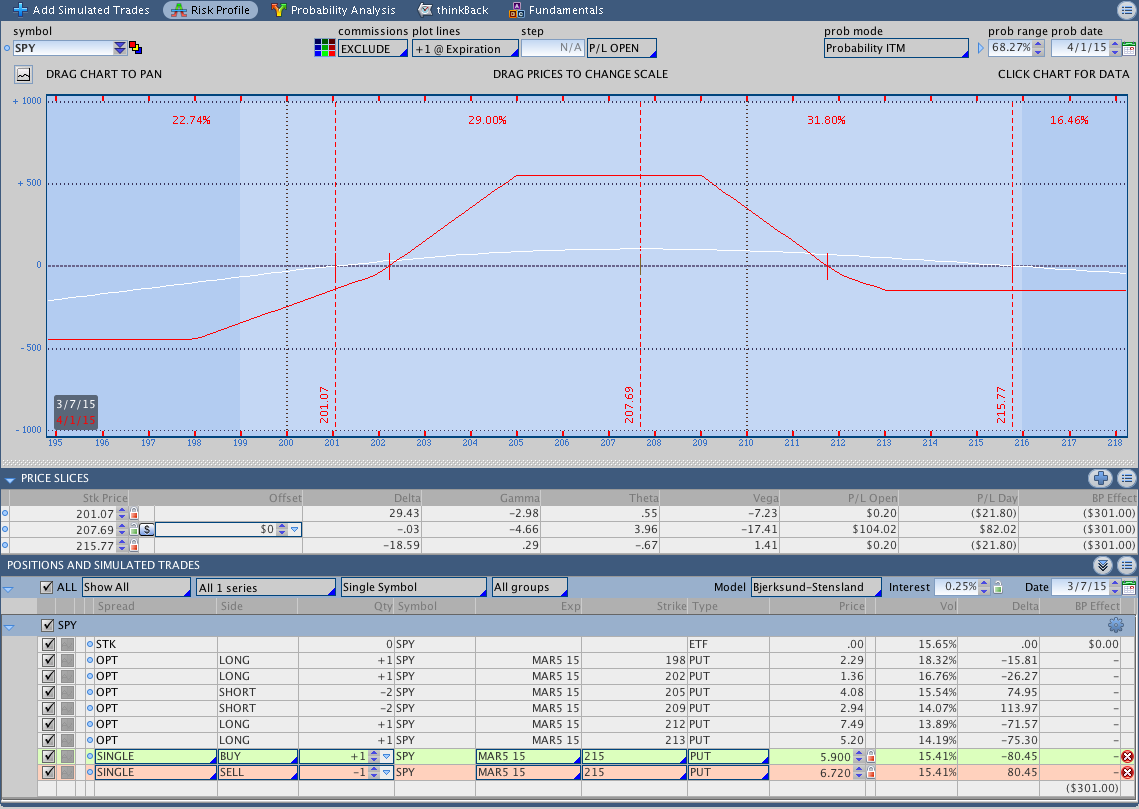
The $SPY trade shown below is a trade that I haven’t mentioned on the site before because it isn’t in my primary account and I’m still in the process of developing the strategy.
I have a very small IRA at ThinkOrSwim (around $1,000) that I use for testing strategies on a small scale. However, one of the things I’m considering discussing going forward is how to trade options with a small (and it this case very small) account. The position below started as a 7 point wide Butterfly on SPY. When SPY violated the upside break even, I added to the position with a broken wing butterfly that was 7 points wide on the downside and 6 points on the upside. That adjustment stretched out the expiration break even line and gave the trade room to breath. On Thursday I rolled down the highest upside put to protect the upside profit on the trade and the trade is quite healthy right now.
The Butterfly strategy is intended to be a low risk way to trade options with a small account. Is anyone interested in hearing more about that? If so, let me know if the comments below or send me an email.
Trades This Week:
RUT & IWM – Closed the March Butterfly position. A trade recap will be posted sometime this week.
ETF, Options, & Forex Inventory:
SCHA – Long 57 Shares from 57.179
RWO – Long 92 Shares from 48.49
RWO – Long 5 Shares from 50.92
TLO – Long 63 Shares from 78.94
RUT – April 2015 1160/1210/1260 Put Butterfly bought for a 10.40 debit
IWM – April 2015 125 Call bought for a 1.65 debit (April Butterfly Hedge)
Looking ahead, etc.:
I’m short term cautious on the markets right now, but I am expecting an increase in realized volatility. Things have been a little too quiet and that usually means volatility will start to pick up. That volatility may or may not mean lower prices and I wouldn’t be entirely surprised to see the move lower find support and be followed by a fast move higher. From a practical trading standpoint, I’m trying to keep delta as flat as possible with room on both sides of the markets. Fortunately, the positions shown above are doing just that. We’re a few weeks away from entering any May expiration trades so there isn’t much to do now other than wait.
Have a good weekend and thanks for reading.
Please share this post if you enjoyed it.
Click here to follow me on Twitter.
Want to receive an alert as soon as the next market commentary is posted?

Sign up for my email list and stay up to date with the latest information on options trading and trend following.
Click here to sign up for the list, get a copy of the Theta Trend Options Trading System, the Trade Tacker I use, and information about new systems.
Even better . . . it’s all totally free.