Backtesting One Indicator For Weekly Options . . . Weekly Theta
Overview:
Last week I mentioned that I was in the process of putting together a system to trade weekly options. In building the system, I wanted to design something relatively simple, objective, and trend following in nature. The discussion below goes over some of the basics of the system and manual backtest results from 2013. I’m satisfied enough with the results that I’m going to start trading a version of this system and I’ll be posting trades to the blog as they become relevant.
The system probably needs a name so we can keep things straight. Let’s call it Weekly Theta.
Weekly Theta Explained:
The Weekly Theta system sells a 10 point wide vertical spread in $SPX the Thursday before expiration (7 or 8 days to expiration). The spread uses around a 10 Delta short option and doesn’t sell spreads for less than a .40 credit. Risk is managed using both the price of the vertical and the $SPX price. The maximum loss on any trade should not exceed 100% of the credit received. For example, a vertical that is sold for .45 with an open loss of $45 or greater should be closed. Additionally, the profit target for all trades is 80% of the initial credit.
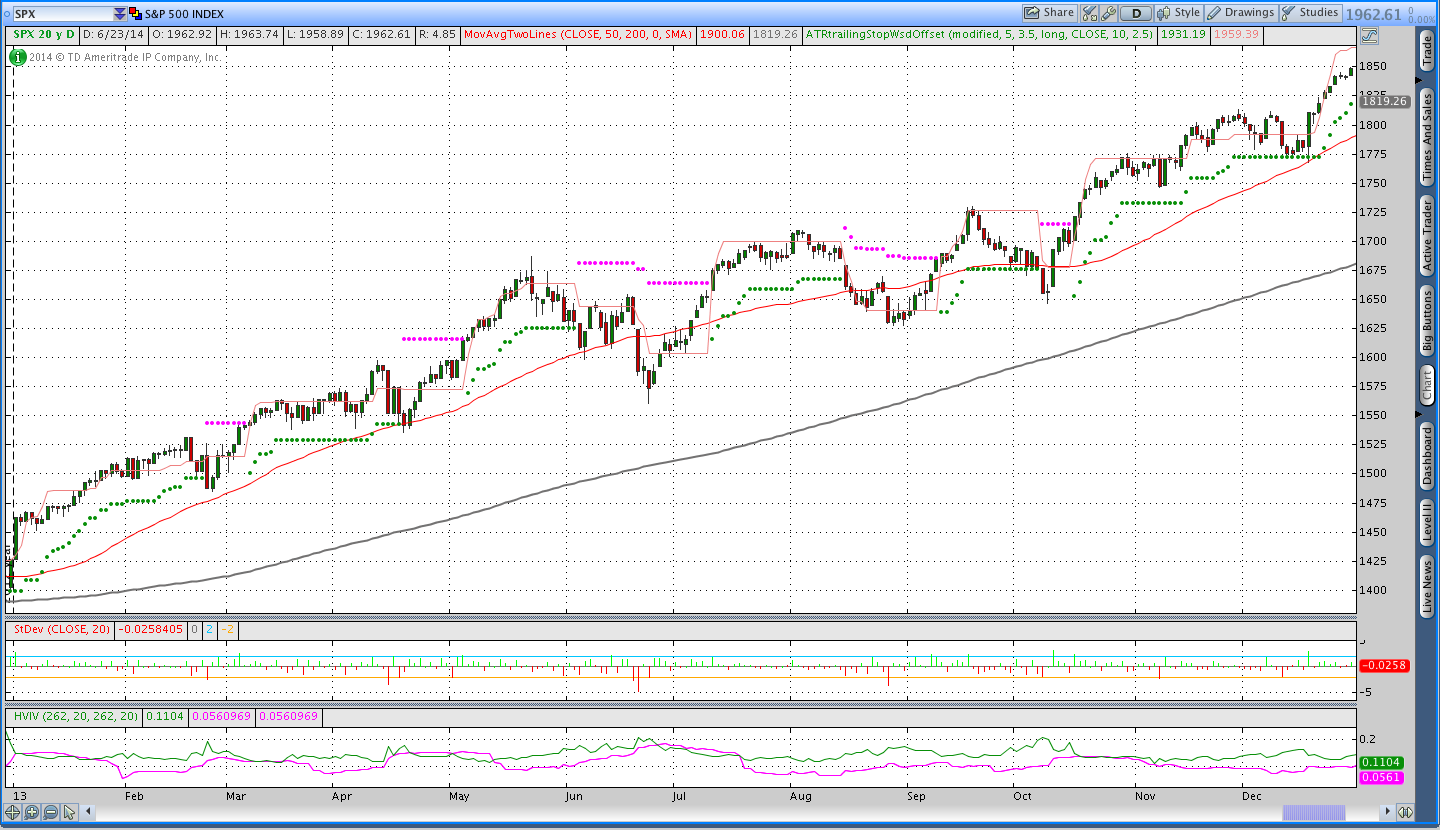
Trend is defined by a 3.5 x Average True Range Trailing Stop with a 2.5 standard deviation offset. Long (short) trades that sell put (call) credit spreads are valid when price is trading above (below) the ATRts and below (above) the SD offset. If the $SPX price is outside of the area between the ATRts and SD offset, no trades should be taken. The idea behind the SD offset is that keeps you from selling verticals when the market is overextended and likely to reverse.
The Rules Briefly:
- Sell a 10 Delta $SPX Vertical approximately one week from expiration in the direction of the trend.
- Cover the short Vertical when 80% of the credit has been received or the trade is taking 100% of the initial credit in heat.
- Trend is defined using a 3.5 x Average True Range Trailing stop using a 5 day loopback period for ATR.
- Note: You can get the ThinkScript Indicator code at the bottom of this post.
Test Period:
I manually backtested the system over 2013. A chart of that period with the indicator is shown below. As everyone knows, 2013 was a very bullish year for stocks, but the indicator changed trend direction 10 times over the course of the year. Despite the strong uptrend, short trades still performed well.
Results:
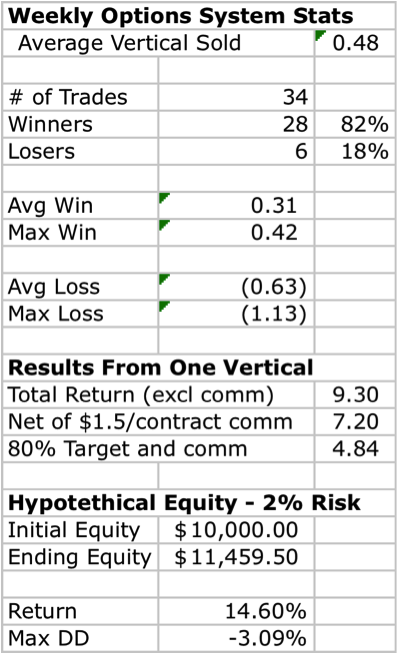
The image below shows the results from the one year test. The system was in the market approximately 65% of the time. Sizing positions based on 2% risk per trade using the average loss generated a 14% return with a 3% draw down . . . nice. The standard deviation offset filter avoided a couple of large losses that would have greatly reduced the system performance. Avoiding large losses is a very important rule in trading and extremely important for a system that trades weekly options.
Risk and Equity:
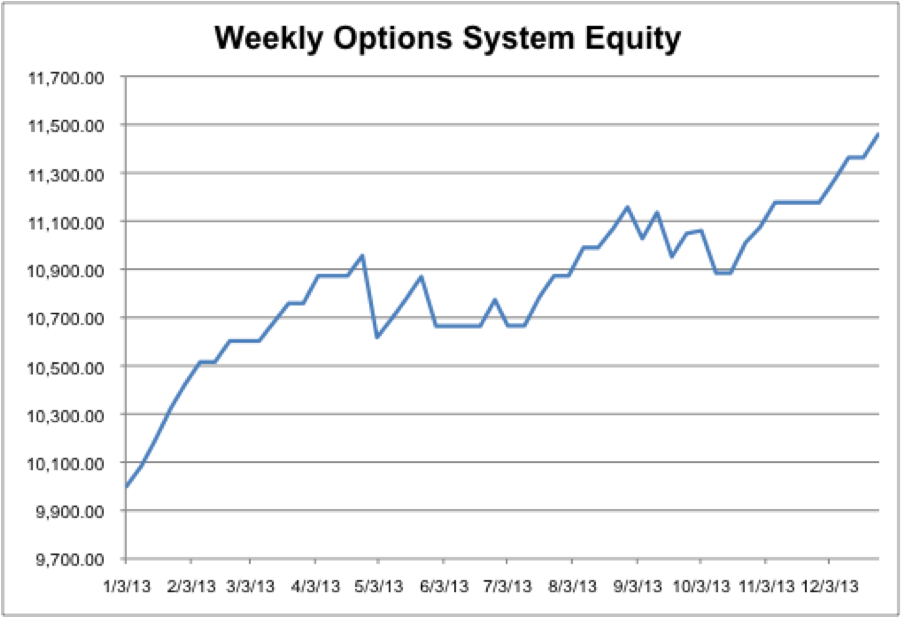
The image below shows the hypothetical equity of a $10,000 account that risked 2% per trade. While the system theoretically risks 100% of the credit received per trade, the average loss for the system was slightly higher than that amount. Part of the reason for the slightly higher average loss is that closing prices did not always provide an exit that met the risk threshold, which resulted in an average loss that was around 130% of the credit.
Based on the one year look back, we know that the average loss is .63 and 2% of our initial equity is $200. Simple math shows that we can initially trade 3 contracts.
Looking Ahead:
I’m going to begin trading this system live and posting both signals (in advance) and results on the blog. However, in an effort to effectively utilize capital and trade other systems I’ll be using a risk threshold of 1.25% per trade. That risk threshold translates into 2 SPX verticals based on a $10,000 account.
Thanks for reading and please share this post using the social toolbar above if you enjoyed it.
Want to receive an email alert when I post new systems and weekly trade signals?

Sign up for my email list and you’ll received alerts for new systems and the weekly options trades.
Click here to sign up for the list, get a copy of the Theta Trend Options Trading System, the Trade Tacker I use, and information about new systems.
Even better . . . it’s all totally free.
4 thoughts on “Backtesting One Indicator For Weekly Options . . . Weekly Theta”
Comments are closed.