Why I’m Getting Naked with Russell
Background on the trade:
Let me be totally frank, I keep my pants on when I trade. Generally anyway. But that’s not what this is really about.
You might recall that a little while ago I went back through all of my losing options trades and started looking for ways to improve. What I found is that by diligently managing risk, I could have had a much greater return by selling naked options rather than vertical spreads. Since doing that review, I’ve been working on a trend following options system for naked options. This is a brief look at where I’m going with the system and it has some overlap with how I trade Iron Condors. Note that what I’m discussing below is riskier than selling vertical spreads and I’m just beginning to trade it so I’ll be tweaking it as I go. This is by no means a comprehensive options trading system; it’s a system in progress.
The trade:
11-12-13 Sold 1 Jan 2014 IWM 96 Put for a .49 credit. Disclaimer: This is not investment advice or a recommendation to take the same trade.
General objective:
Sell out of the money options in a systematic, trend following manner. That’s it. The plan is relatively straightforward conceptually and it looks something like this:
- Objectively identify the direction of the trend and only sell options on one side of the market.
- Find low delta options to sell 60-90 days from expiration.
- Manage the trade based on either a trend violation or reaching max loss.
Trend identification:
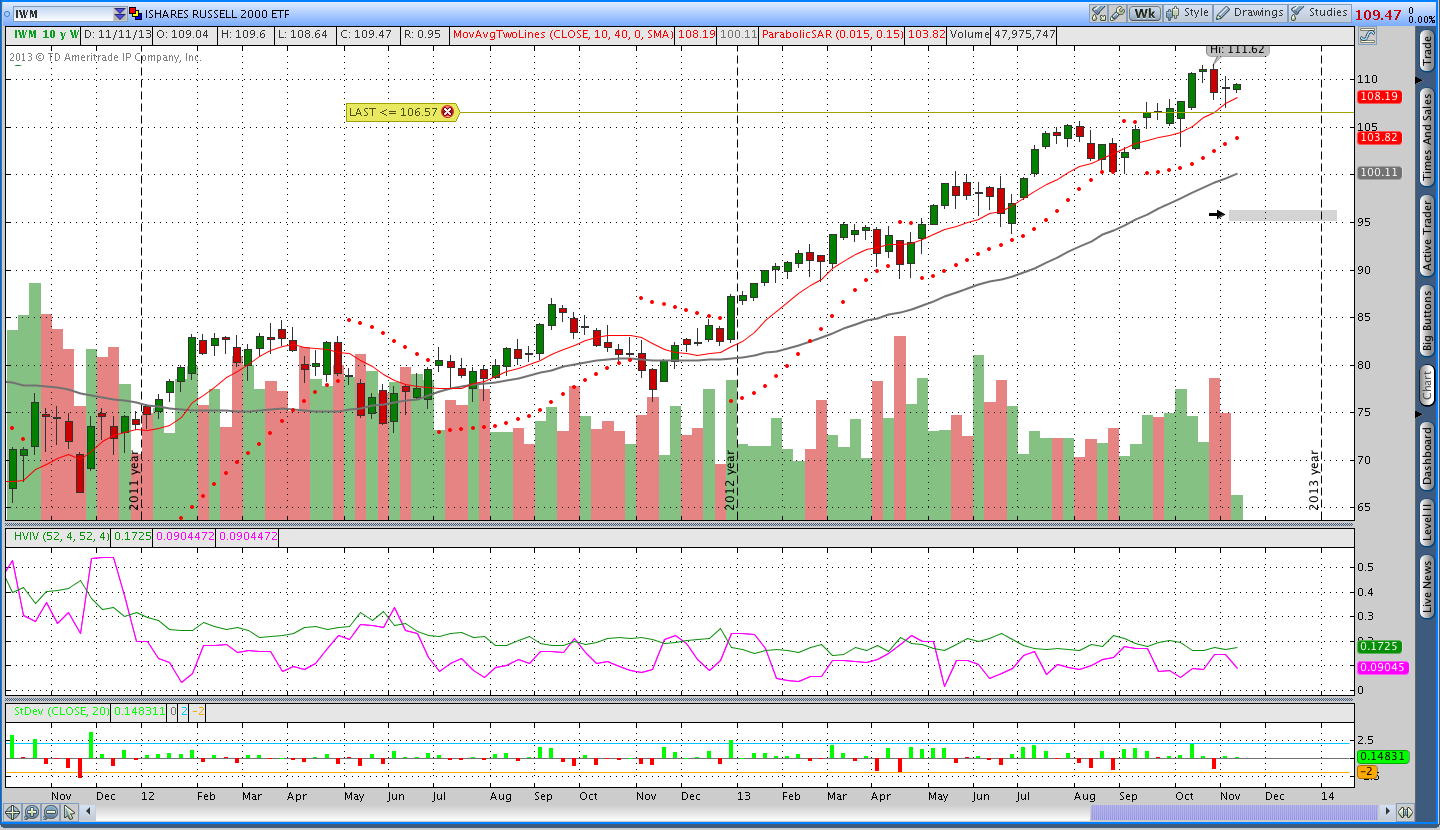
When I trade vertical spreads, I use a daily chart with an average true range trailing stop to identify the trend. For naked options I’m using a weekly chart with a Parabolic SAR, but it shouldn’t matter too much. I have reasons for changing up the indicator, but I’ll save that for another day. The real purpose of a trend indicator is to objectively identify the trend because I only want to sell options on one side of the market. In other words, if the trend is going up I will be short puts. If the trend is going down, I will be short calls.
The image below shows a weekly chart of the Russell 2000 (IWM) with a Parabolic SAR. The Parabolic SAR parameters I’m using are slightly slower than the default parameters. I’m using slower parameters because I want to be able to stay with the trends as long as possible without being whipsawed.
Additionally, I’m using a weekly chart rather than a daily chart because I will be selling the naked options further out of the money. More on that later.
The what and when:
I’ll be selling naked options at around a 10 delta with 60-90 days to expiration. The reason I’m selling a lower delta is that I do not want these options to go in the money. Selling a longer dated, out of the money option gives me a position with a lower delta with a reduced likelihood of being stopped out. Options that are further from the money have a lower delta so if the market moves agains the position it won’t be as immediately painful. However, as the market moves against a position, gamma will kick in and the delta will grow so keeping risk under control is extremely important.
Managing risk:
The most I’m willing to lose on any short options trade is what I receive as a credit. For example, the IWM put that was sold for a .49 credit has a maximum loss of about $50. That means I’m closing the trade if it’s suddenly down $50. The hard part of having such a small stop loss is that it makes you want to ride out the position, but staying with losing trades can end very, very badly.
I will leave the door open for myself to roll down the position. If my short delta increases by 6-8 or the position ends up down 60% of the max loss (down $30 in this case), I will roll down and increase my size on the roll down. However, I will only roll down once and I’ll exit if the Parabolic SAR it hit regardless of what is going on.
My goal in the position is to be out in 30 days or so and to buy back the short for a nickel and skip the commission.

Position discussion:
The risk graph below shows the short put I sold in the Russell (IWM) yesterday. As of today, the first adjustment point would be hit if IWM makes its way down to 106.65. The Parabolic SAR level is a bit lower at around 103.82 and that would result in a loss of around $80, but as long as the market does not gap down that won’t happen.
If you have questions about what or why I’m doing this, please send me an email on the About page. Lastly, if you enjoy what you’re reading here (and you either hate it or love it if you’ve made it this far), click above to share this on your favorite social media platform. Thanks for reading.
2 thoughts on “Why I’m Getting Naked with Russell”
Comments are closed.