Improving Returns with Position Sizing and Trendiness of Assets
Note: This article is based around an options trend following trading system. Essentially I’m using the principles outlined in the Theta Trend document. The document is a comprehensive system for options trend following and will give you some additional background for the discussion below.
Background:
Unlike a trend following system that takes an outright position in a market, positive theta options trend following requires new trades to be entered every month. Intuitively, if we’re selling a vertical spread and we hit our profit target, there is no reason to hold the trade because profit is a fixed number. Trend following with short options is different than taking an outright position because outright positions can be set up without fixed profit targets and held until a trailing stop is hit.
Short options trend following systems tend to lose money in one of two ways: the trend move is a “fake-out” and price reverses or a trend has been running for some time and it finally ends. In the cases when trend ends, a trend following options system should have several profitable months leading up to the end of the trend.
The Question/Hypothesis:
Can we determine how many days we expect an asset class to stay in a trending state? If so, how can we use position sizing to increase the returns in a trend following system? For example, let’s say we look back at the data and find that USO (Oil) generally stays in a trending state for 47 days before reversing. If we’re currently long USO and it has been trending for 75 days, we could reduce our position size because the trend is likely to end soon. I’m not saying the trend will end, but I am saying that based on averages, it’s likely and we should bet less. On the flip side, if USO just issued a new long signal we might want to bet more because we know the trend is likely to continue.
Assumptions:
Let’s assume that we always have an options trade on in USO meaning we’re either long or short. Since this is a system, we’ll define the direction we want to trade using an average true range trailing stop. As a result, if price is above the average true range trailing stop, we would sell a put vertical below the market. On the other hand, if price is below the trailing stop, we would sell a call vertical above the market price.
An Illustration:
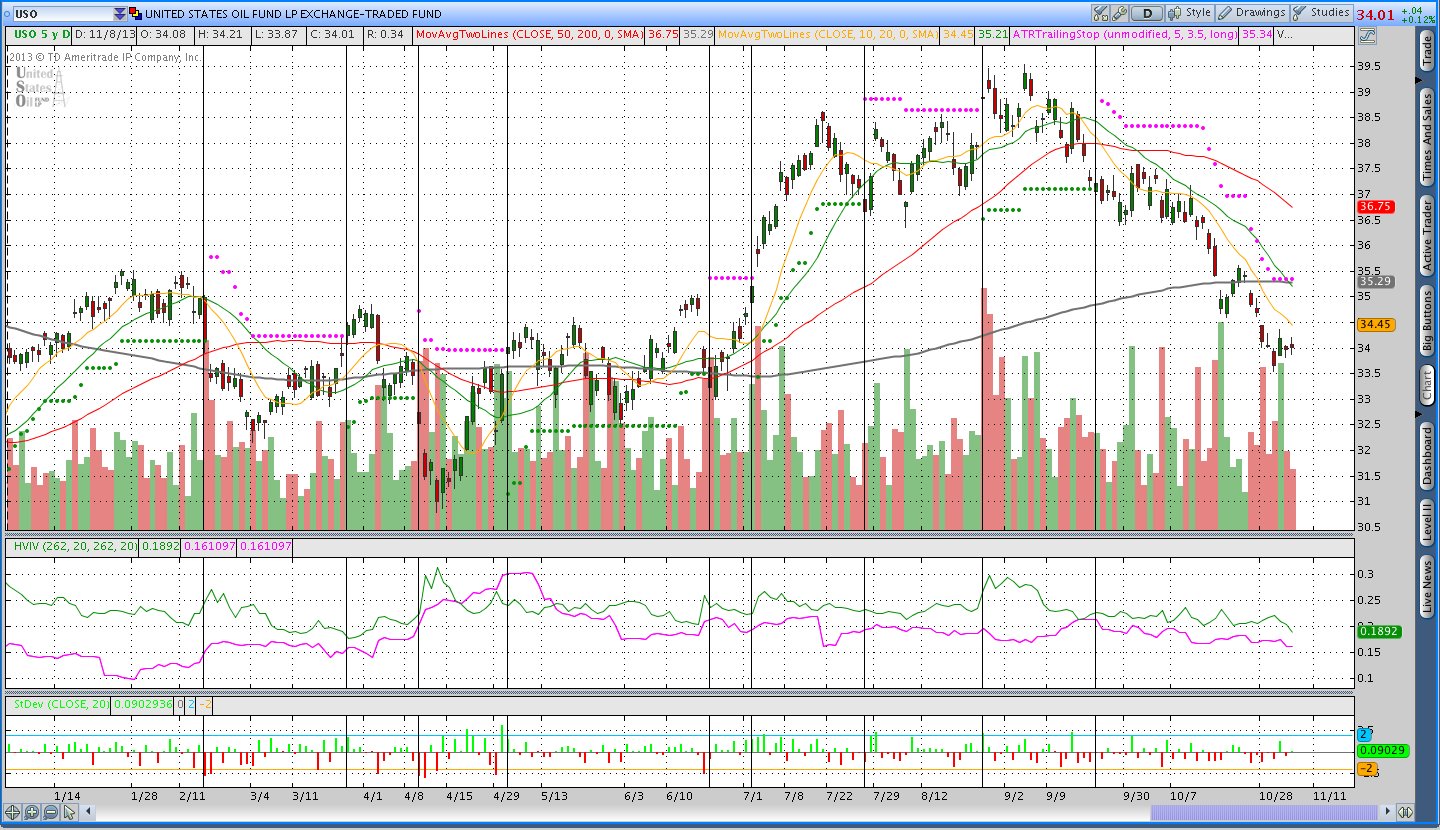
When selling vertical spreads, I use an Average True Range Trailing stop to both identify trend direction and my stop level. The chart below is a year to date chart of USO with vertical lines drawn to illustrate the trend changes. From a purely visual standpoint, the chart shows that the past year has been very choppy with numerous price changes. If we know approximately how long a trend should last we can determine two things: whether or not to take a trade and how much to bet.
Here’s a numerical description:
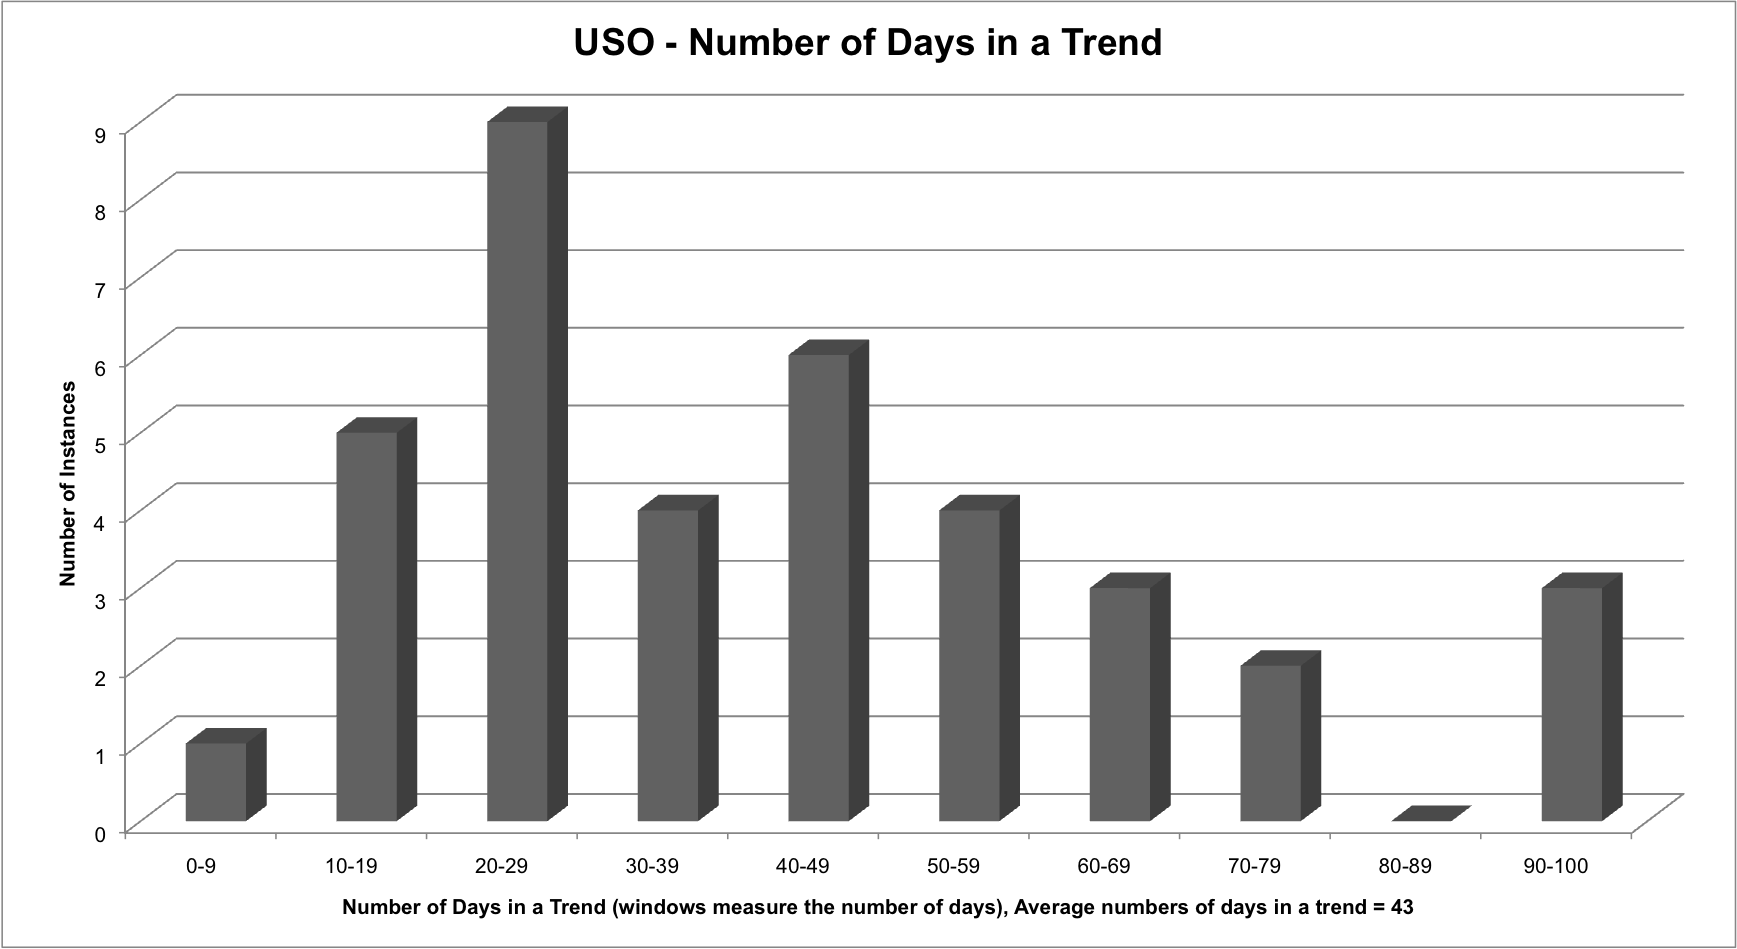
I went back and looked at the data for USO over the past 5 years and found some interesting things. Over the past five years, USO stayed in a trending state for an average of 43 days (the mean) and the standard deviation was about 24.71 days. In cases where the trend was greater than the average, USO stayed in a trending state on average 64 days. Over the past five years the data was skewed and one outlier of 195 days was eliminated. The frequency distribution below shows a more exact breakdown and while the same set is limited, the data does not appear to be normally distributed.
What we know from looking at the data below is that over the past 5 years, trends in USO have generally lasted 20-50 days. However, if the trend continues, it might do so for some time.
How to apply the information:
If we know the trendiness of an asset class we can make decisions that increase our expectancy. What I noticed is that only 46% of the trends in USO are greater than the average 43 day trend. We could call the trends greater than the average the “home run” trends. Additionally, the average duration of the home run trends was 64 days. Fortunately for us, 64 days is approximately equal to two options expiration cycles. What that means is that if we sell a USO vertical after one winning trade (in the first expiration cycle), we only have a 46% probability of success. Let’s take a look at things below in terms of expectancy:
Expected outcome = P(winning)*Avg Win – P(Losing)*Avg Loss
Where P(winning) means the probability of winning and P(Losing) is the probability of losing
Suppose we know that our system has a roughly 60% chance of making money on the first trade and our average win and loss are both $80:
EO = 60%*80 – 40%*80 = 48 – 32 = $16 expected win
Now let’s assume that we just took the trade and made $80 on the first expiration cycle and we think we want to sell the next month. Remember from above that we know only 46% of the trends will last through the second month. If the trend doesn’t last through the second month, we’ll get stopped out. If we assume a full win and loss, this is how our expectancy looks:
EO = 46%*80 – 54%*80 = 36.80 – 43.20 = $(6.40) expected loss
The next thing to consider is why outright trend following systems make money if the trends are unlikely to continue and the explanation is exactly why trend following works. In an outright system, the winners are significantly larger than the losers so a low winning percentage can be overcome. The equation below does a better job of illustrating a trend following system that takes outright positions.
EO = 40%*200 – 60%*100 = 80 – 60 = $20 expected win
Closing thoughts:
The big take away is that it might not make sense to continue selling vertical spreads in every month a trend continues. Ultimately it depends on the probabilities in the second, third, etc expiration cycles. Lastly, options trend following strategies do not have the 2 to 1 payout of a typical trend following system and following a trend further is a less favorable bet.
Another way of increasing the duration of a trend is to use a looser fitting indicator or to use a weekly timeframe. Part of the idea behind the naked options trading is that the weekly timeframe will result in longer trends. Selling low delta options should also result in a higher probability of success.
It sounds like there’s quite a bit more to explore in future posts! Please share this article above if you enjoyed it.