Weekly Market Recap: Analysis Of Stocks, Bonds, Gold, And Option Inventory
Overview:
This is my first weekly market recap. We’re going to take a look at few different markets from a technical perspective (any fundamentals are presented for entertainment and/or snickering only). The weekly recap is made up of two parts: a discussion related to the 4 markets and an inventory summary with trades I’m watching next week.
Do me a big favor: if you have any questions about any of this, please post in the comments below or send an email to dan at thetatrend dot com. Additionally, let me know what you think. Specifically, let me know what you do or don’t like and what you’d like to see if it isn’t here. Thanks and read on.
How we’re going to define trend:
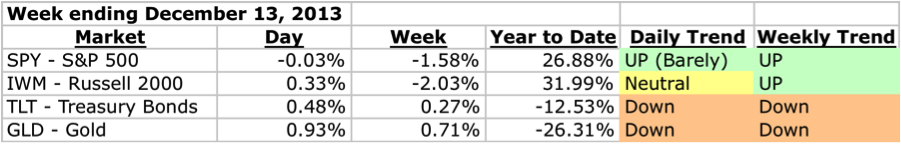
Trend on the daily timeframe is defined using Donchian channels and an Average True Range Trailing Stop. There are three trend states on the Daily timeframe: up, neutral, and down. On the weekly timeframe, I’m looking at Parabolic SAR to define trend and there are two trend states, up and down. In reality, there are always periods of chop and I’m using the indicator to capture the general bias of both the trend and those periods of chop.
The weekly stats:
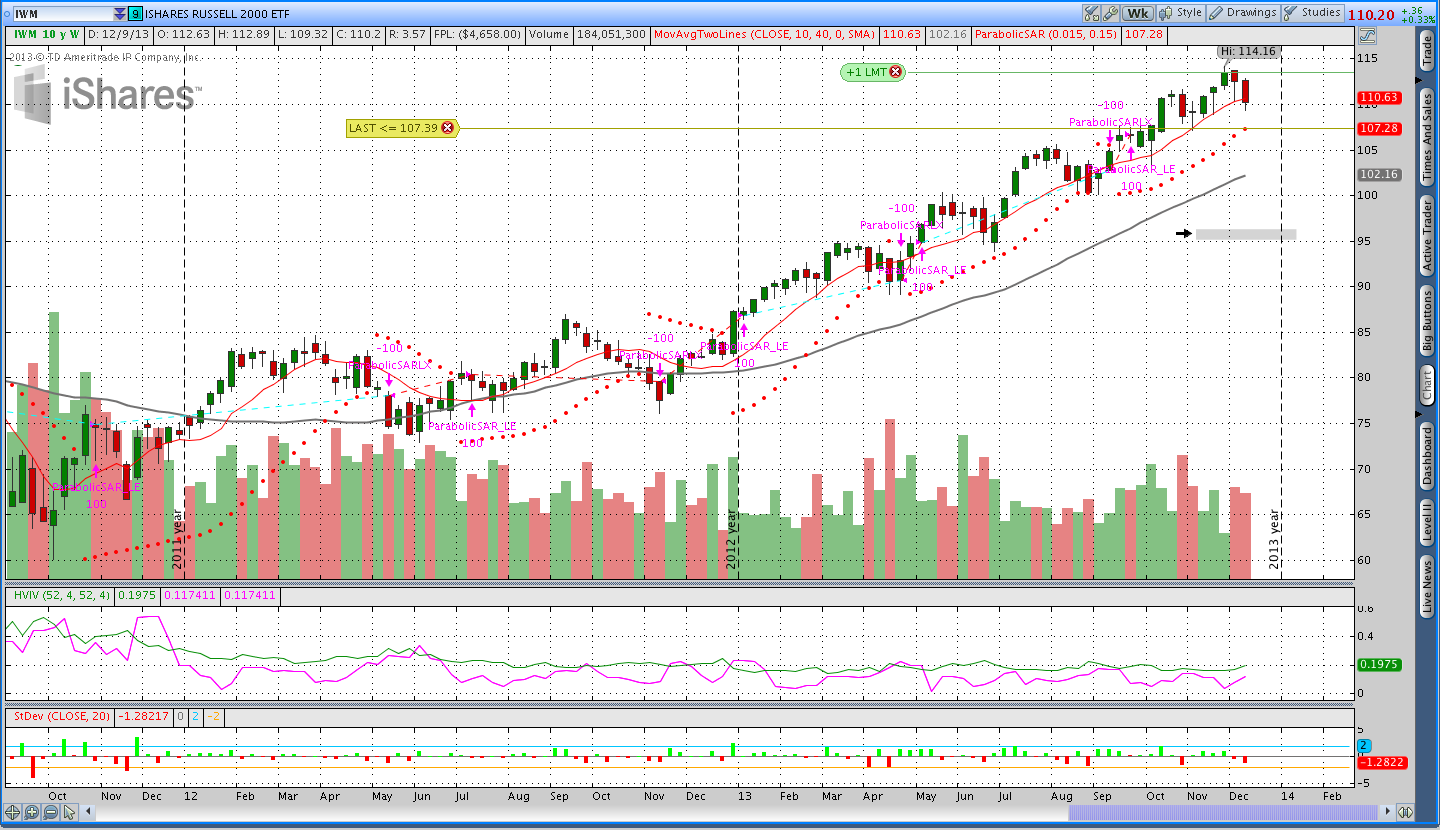
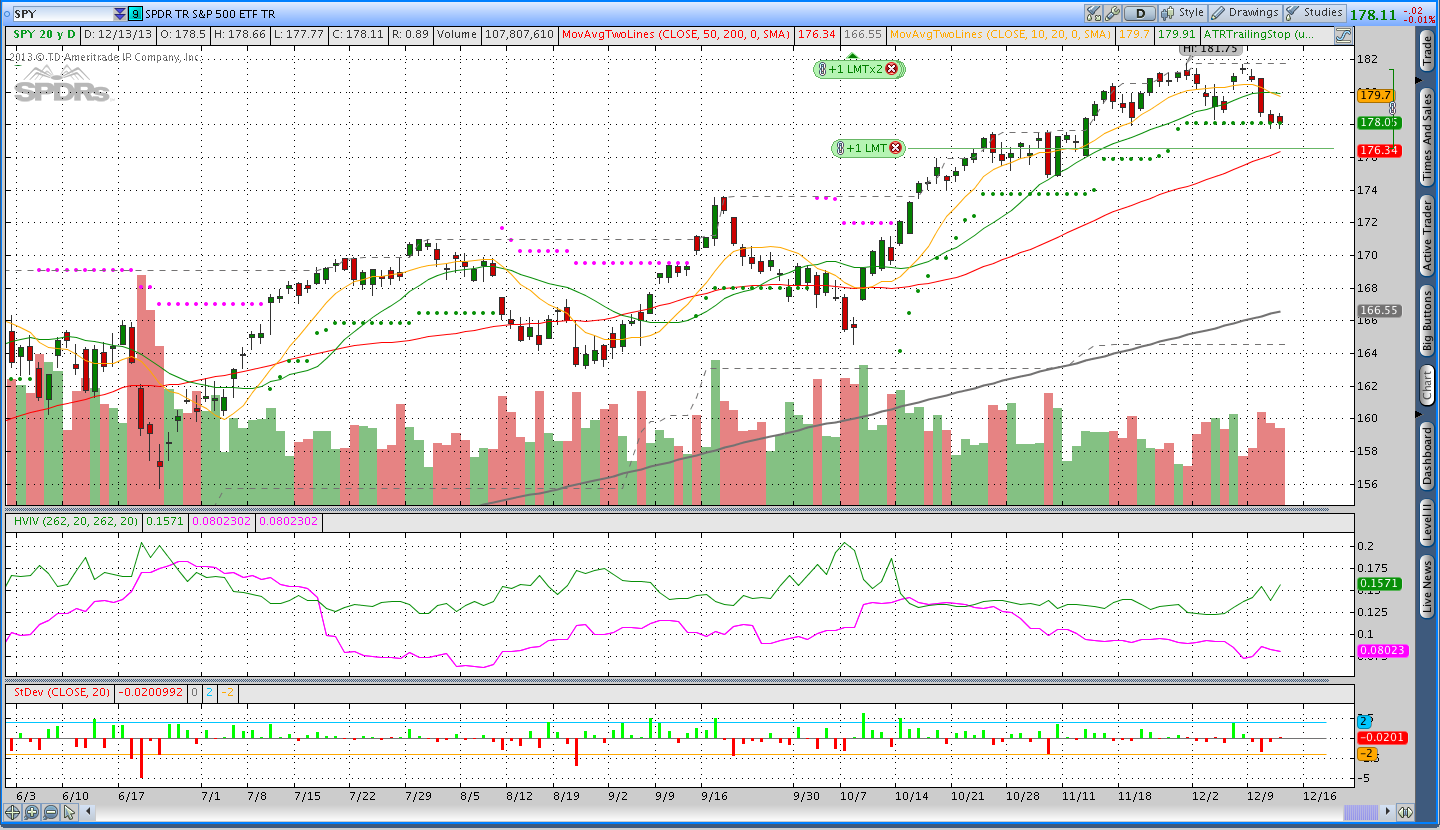
Stocks (SPY – SPDR S&P 500 ETF and IWM – iShares Russell 2000 Index ETF):
US stocks had a little bit of a pullback this week with the Russell 2000 falling slightly more than the S&P. The Russell fell enough to take out the ATR trailing stop and put it into neutral mode on the daily timeframe. On the weekly timeframe, the primary trend is still up. The S&P 500 remains in an uptrend on the daily and weekly timeframes, but price is sitting right around the ATR trailing stop level. A close below the ATR trailing stop will put the SPY into neutral.
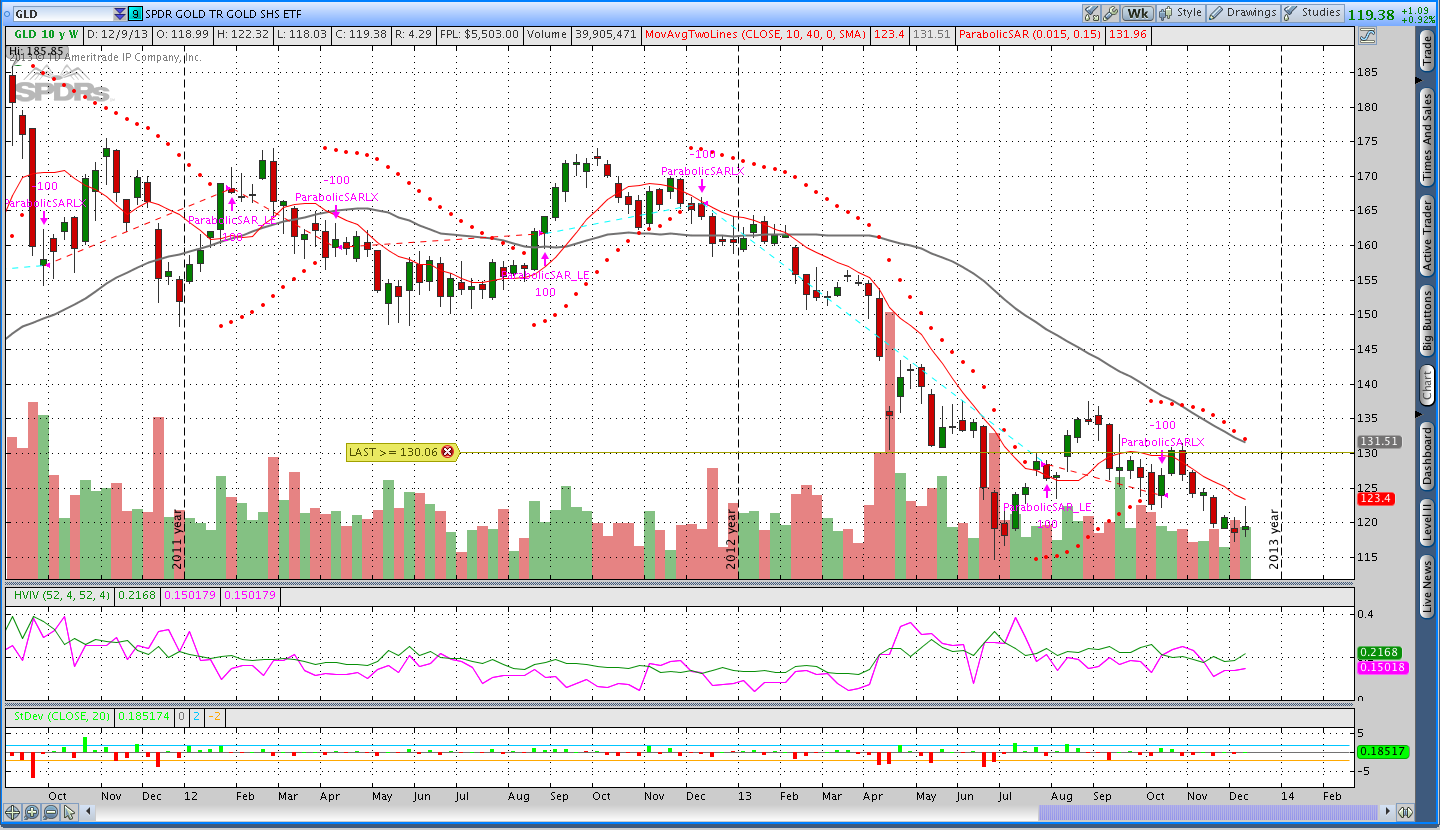
Gold (GLD – SPDR Gold Shares ETF):
Gold took a big hit this week on Thursday and my timing was lucky on Wednesday when I sold the call. We saw a little bit of a bounce on Friday and GLD closed up slightly on the week, but the primary trend is still lower on both the daily and weekly timeframes.
It seems like there are numerous articles about “why” Gold should go higher and “why” it’s a great investment. However, as long as price remains in a downtrend, I will be short gold. It is very much my view that we buy investments we want to appreciate in price. If our goal is to buy things that will appreciate in price, there isn’t much reason to buy them as they’re going generally lower. The entire notion that we should buy things that are becoming cheaper is based on a retail or consumer mentality. When we’re trading, we need to think in terms of being the store rather than the consumer and buy things that are appreciating in price (ie there is a demand for them). We can talk about this more another day . . .
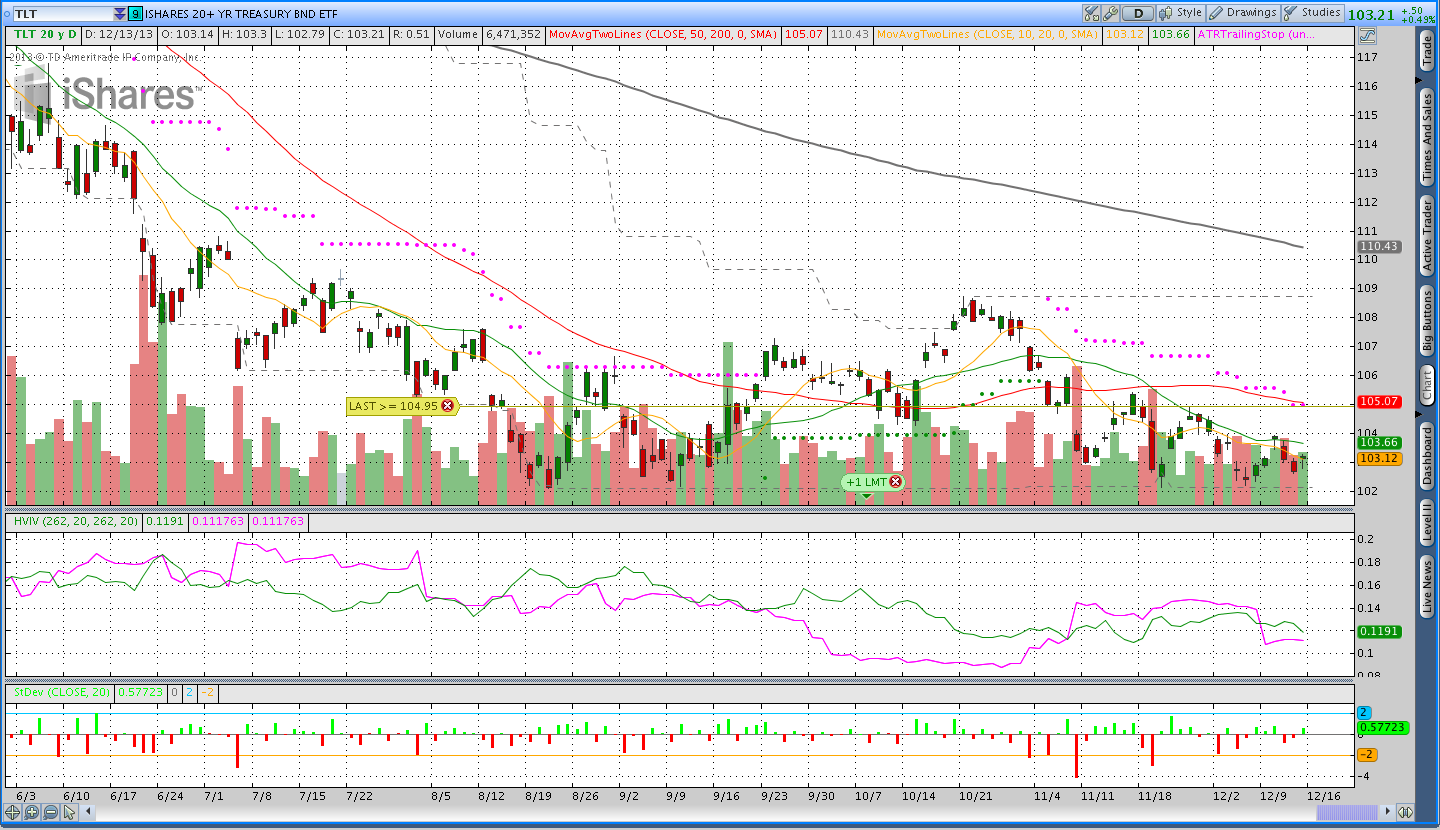
Bonds (TLT – iShares Barclays 20+ Year Treasury Bond ETF):
This was a choppy week for US Treasury Bonds with stronger finish on Friday that put TLT into positive territory for the week. However, the daily and weekly trends are still pointing lower. While it doesn’t matter, and I won’t trade on it until the trend confirms my feeling, I think Bonds could move higher (yup, I’m still short).
It seems like people have wanted Bonds to go down for a couple of years now and there has been a lot of attention paid to the notion that rates are at all time lows and must go higher at some point. I feel like the 12% move down in bonds this year might be pricing in higher rates. As price moved down in 2013, I think the party in Bonds ended and people believed they understood why they should unload their bonds. To some extent, I wonder if the move is overdone and we’ll see prices stabilize or even move slightly higher in 2014. All that being said, I won’t take any long trades in Bonds unless the market confirms my theory. Remember, fundamentals are presented for snickering only.
Trades This Week:
USD/CHF – Sold Short 4,000 Notional Units
GLD – Sold March 2014 139 Call for .53
Inventory:
SPY – Short Jan 2014 Strangle 188 Call/162 Put
IWM – Short Jan 2014 96 Put
GLD – Short March 2014 139 Call
TLT – Feb. 2014 106/106 Call Credit Spread
PGJ – Long 102 shares from 29.42
Forex Inventory:
NZD/JPY – Long 3,000 notional units at 80.56
USD/JPY – Long 4,000 notional units at 100.61 and long another 4,000 at 101.64
USD/CHF – Short 4,000 notional units from .8874
Looking ahead:
Next week is expiration and I’m looking to sell March 2014 SPY or IWM puts at around a 10 delta. While I think it’s unlikely that the weekly trend direction will change, it is possible and that would lead me to sell calls rather than puts.
Thanks for reading and please comment below or send me an email to dan at thetatrend dot com to let me know what you like/dislike about this summary and what you’d like to see more of going forward. Enjoy the weekend.
Dan – this is great stuff. I am new to this website and have a lot to learn. I understand how the Parabolic SAR indicator determines the weekly trend but not sure how the combination of Donchian channel and ATR determines the daily trend. Are these all covered in your website elsewhere?
Hi Lee Tang and thanks for the question. I started looking for ways to improve on the initial Theta Trend system discussed in the system document and I ended up using Donchian channels as an entry filter. Donchian channels are really common in trend following breakout systems so I thought it would be interesting to combine them with short options.
Essentially if price makes a new 50 day high, I consider price to be in an uptrend until price closes below the ATR trailing stop. Once we get a close below the ATRts, I consider trend to be Neutral. When price makes a new 50 day low, I consider price to be in a downtrend until a close above the ATRts. When price closes above the ATRts, the trend goes from down to neutral.
A video discussing Donchian channels is here:
http://www.thetatrend.com/options-trend-following-donchian-channels-theta-breakout-video/
A post explaining the system:
http://www.thetatrend.com/theta-breakout-selling-options-on-donchian-channel-breakout/
And, lastly, a post about the manual backtest:
http://www.thetatrend.com/backtest-results-short-options-trend-following-new-questions/
Thanks for reading the blog. Enjoy!
Excellent!
Very interesting ideas here Dan. Would be interesting to see how all this works in 2014.
Cheers,
LT
Hey Dan,
Thanks for putting this wrap up together this weekend. As for feedback, I would say it would probably be good to clarify the differences between this strategy and others you have talked about on this blog before. For example, you had been tracking your trades just using the ATR trailing stop indicator for entries. Now it looks like you are using the DOnchian Channel. Also, you mentioned the PSAR indicator, which I dont think you ever mentioned before. Are you using the PSAR for entry decisions? I think a description of your current strategy would make it all clearer.
Good work man!
Cool, thanks LT. I briefly mentioned using the pSAR at the link below, but it is a newer system and also a preview of things to come.
http://www.thetatrend.com/why-getting-naked-with-russell/
I think a post to get really clear about the different systems is probably in order. Thanks.
For anyone who doesn’t know, LT has a great weekly commentary as well. Here’s a sample of his:
http://www.the-lazy-trader.com/2013/12/weekend-portfolio-analysis-december-14.html
First of all–great work and thank you for sharing! A couple questions.
1. You are using ATR trailing stop and PSAR as trend indicators. That’s pretty original. Have you found them to work better than a more traditional trend indicator like MACD or a 3-MA system?
2. In your Theta Trend system an entry signal is given by an ATR trailing stop violation. Have you tried filtering those signals based on a trend in a longer term timeframe? For example, only take the short side and ignore the long side signals if the weekly trend as shown by some indicator is down?
Thanks!
Hi Quantifiableq, thanks for for the questions and for reading the blog.
1. I haven’t spent a ton of time exploring alternative technical indicators like MACD or a 3 MA system, but the results should be fairly similar. While specific indicator settings can disprove me, most trend indicators should give the same signals in the presence of a strong trend. For example, when stocks were getting the smack down in 2008, most trend indicators said the trend was lower. I looked to pSAR and ATRts because the indicators were essentially always in the market (long or short) and that allowed the system to sell options every month. As you probably know, many people in the options world trade the same strategy every month and I wanted to create a system that could be traded every month.
2. My Theta Breakout system is intended to filter the ATRts signals. I haven’t specifically combined multiple time frames, but I’ve noticed that selling further from the money based on a longer term trend seems to work well. Intuitively, it seems like being closer to the money results in more trades and more stop hits. The pSAR system I’ve been trading is an example of selling further from the money and using a longer timeframe (weekly). My opinion, not that the market cares, is that managing the risk in open trades and keeping losses under control can improve a system significantly more than specific entry and exit signals.
Thanks for the great questions and it looks like you’re up to some cool stuff over at http://quantifiableq.wordpress.com.
Best,
Dan