$RUT November 2015 Butterfly (CIB) Trade Review
Overview:
The November RUT CIB is closed and it was a good month despite a rocky start. The trade was entered on September 24, 2015 with 56 DTE when RUT was around 1136. Shortly after entry, RUT traded lower to test the August lows and I rolled the position lower twice. After rolling the position lower, RUT reversed to the upside and raced higher. That move forced several upside adjustments to keep up with the market. I think we can all agree that I’m getting pretty good at timing the bottom in the wrong direction.
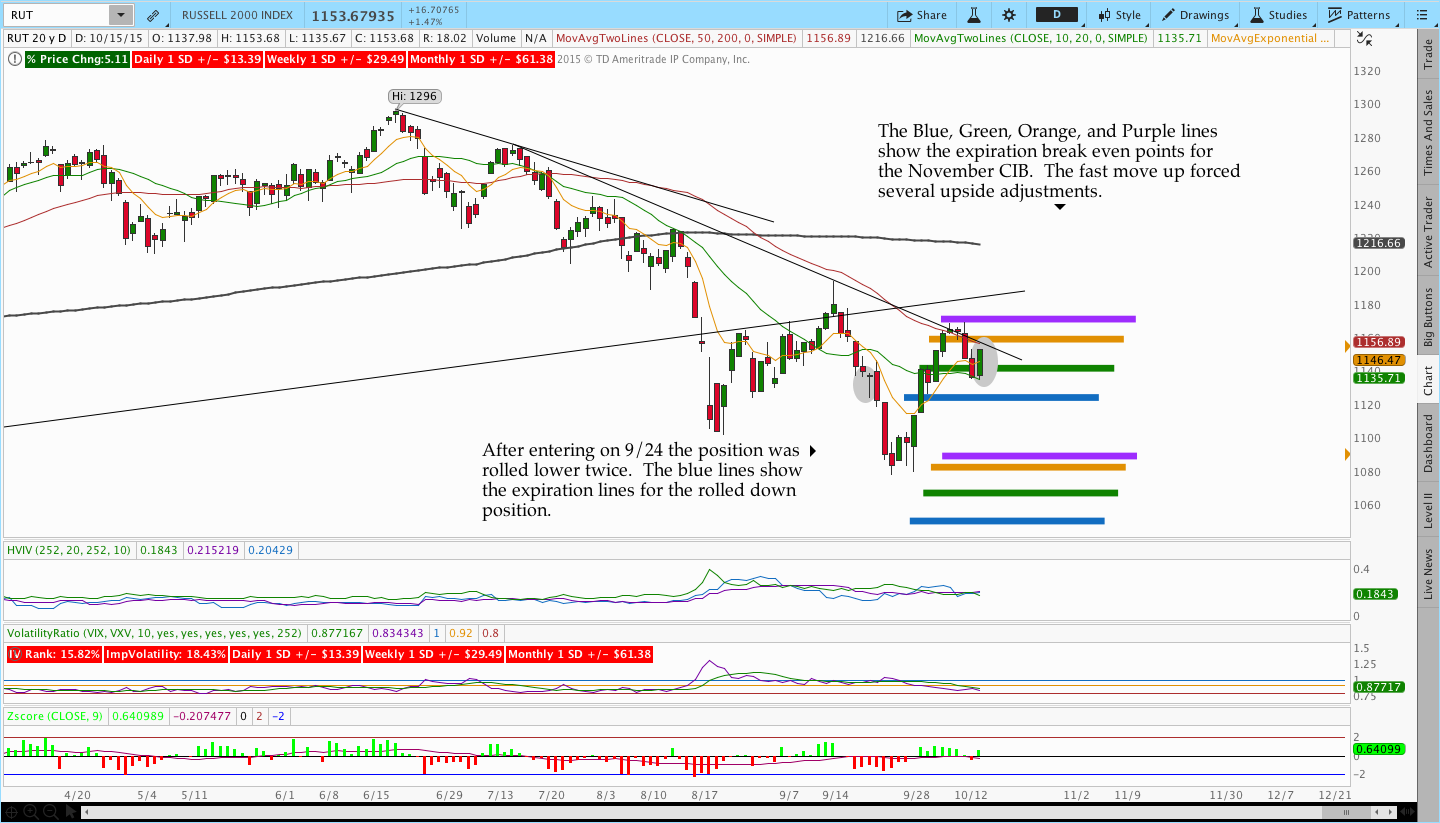
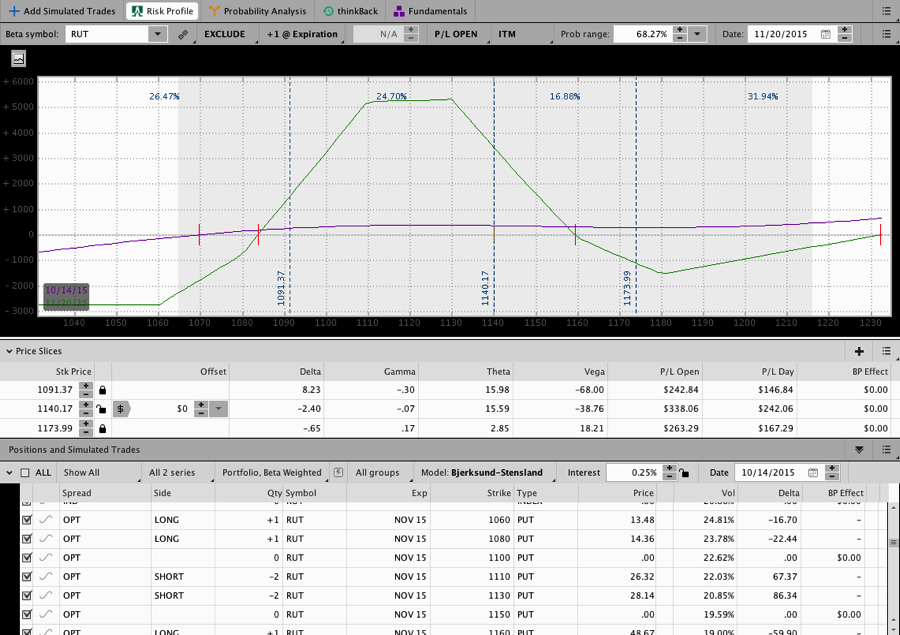
In general, the CIB has been holding up well even though the markets have been very volatile. The biggest challenge is keeping up with the moves and speed. The price chart below illustrates the market environment for the trade. The colored horizontal lines show the expiration break even points for the trade after adjustments. Note that the first set of blue lines is after the two initial rolls lower.
Initiation:
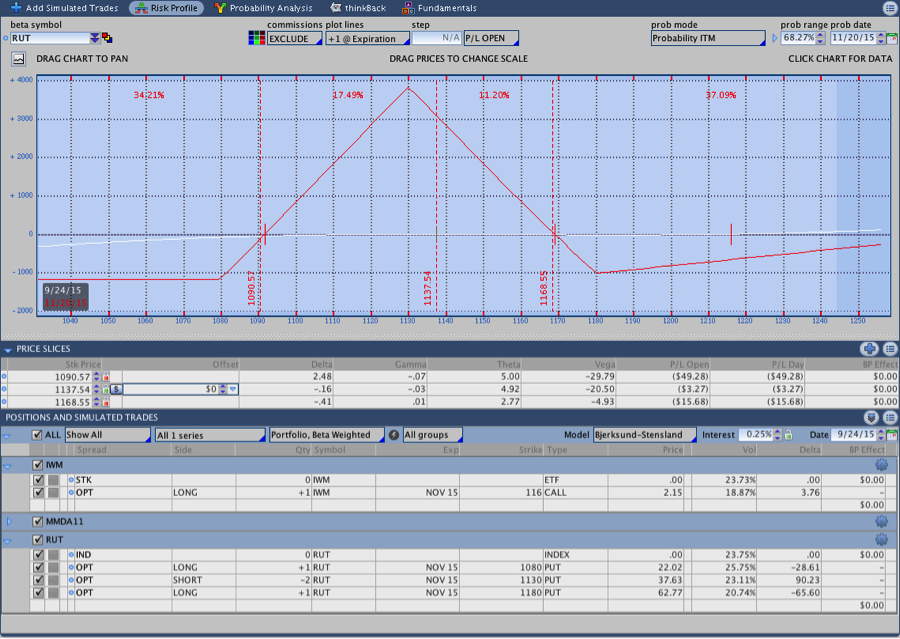
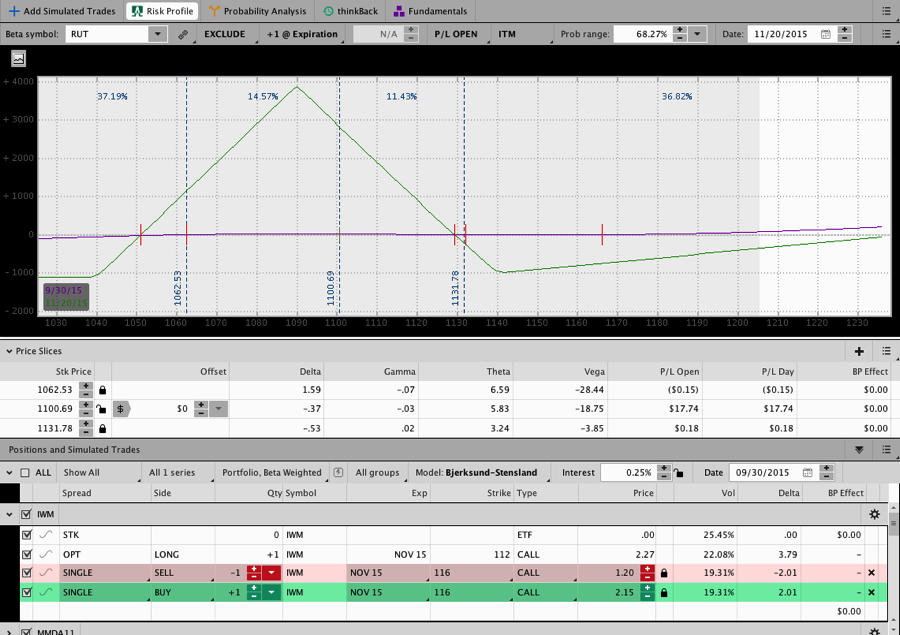
The image below shows the trade on the day of initiation. I bought the 1080/1130/1180 November RUT Put Butterfly for 9.53 and the 116 IWM Call for 2.15. I was in this position for about 4 days before the market hit the downside roll point.
As you can see, the image is in the old TOS software prior to the update. I miss the old color scheme.
Adjustment #1 – Roll Lower:
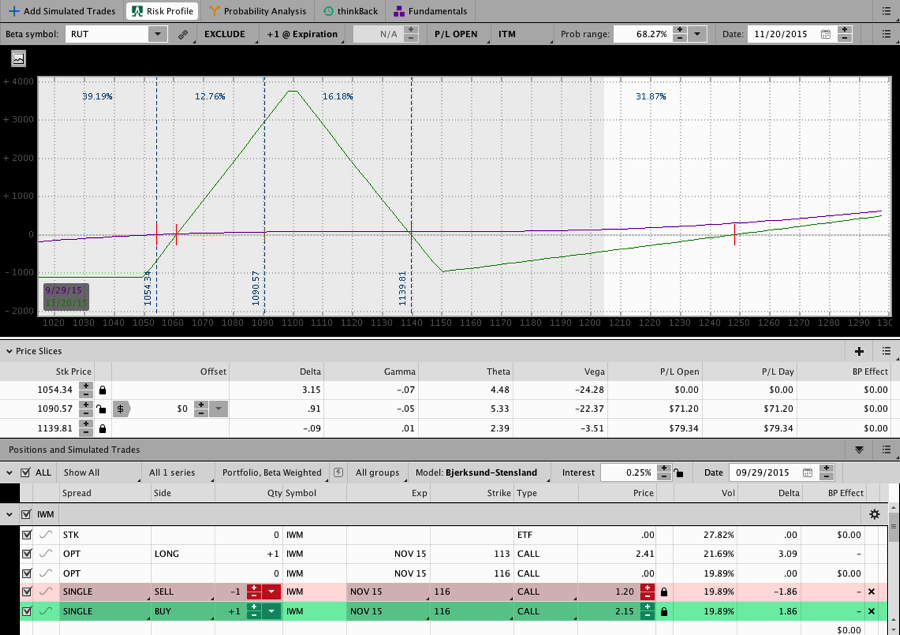
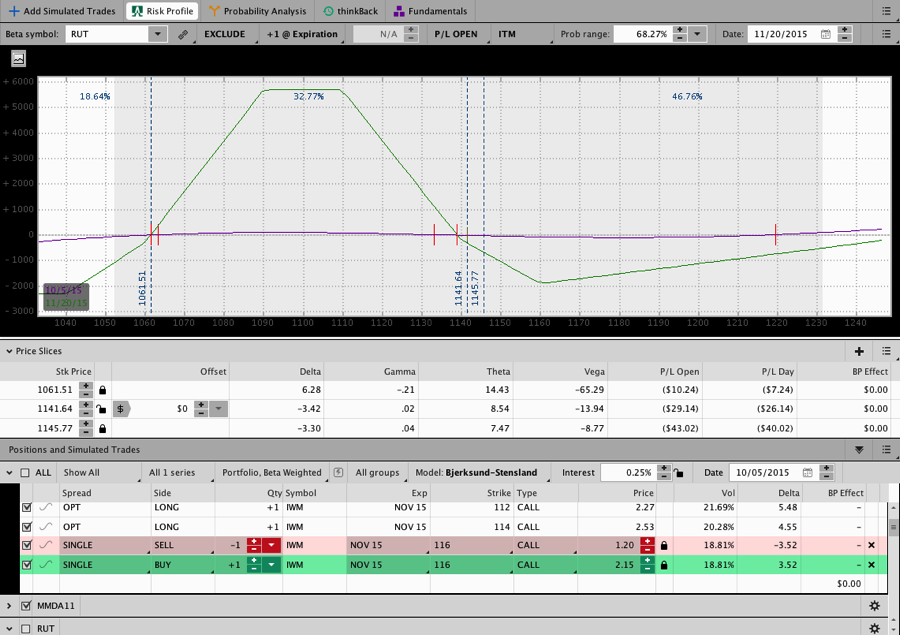
My initial position this month was entered closer to at the money because I was somewhat neutral on RUT. RUT traded lower a few days later and hit the downside adjustment point relatively quickly. I rolled the 1130 Butterfly down and bought the 1050/1100/1150 Put Butterfly. I also sold out the IWM Call and replaced it with the 113 Call.
The updated risk graph shows the position after the roll. My guidelines for the CIB recommend repositioning the trade at the money or 10 points below on moves lower. The trade was positioned roughly ATM.
Adjustment #2 – Roll Lower Again:
After moving the position lower, RUT decided to continue down and the next day the market hit the downside adjustment point again. At this point in the trade RUT was retesting the August lows and seemed like it had the potential to go further. I closed the 1100 Butterfly, sold the call, and waited overnight before opening the new position.
It’s important to not blindly follow trading rules. In this case, RUT was heading down and had the potential for a large gap lower. That didn’t take place overnight so I reopened the trade centered at 1090. The position is now centered 40 points below the initial center.
I entered the 1090 Butterfly shown below around 10 points below the money because I didn’t want to be forced to roll lower immediately if RUT went down again. I did an excellent job of making that choice right around the low in RUT before the market turned and headed higher.
Adjustment #3 – Heading Higher (Add):
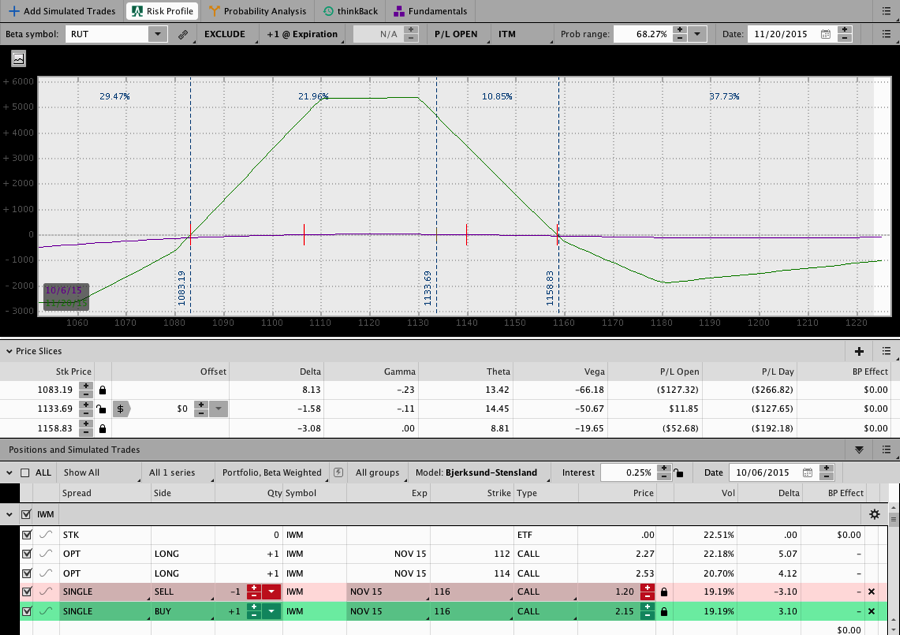
A few days after undercutting the August lows, RUT reversed, moved off the lows, and the CIB hit an upside adjustment point. I added the 1110 Butterfly with the 114 IWM Call. The updated risk graph shows the position after the adjustment and as RUT is moving higher yet again.
Adjustment #4 – Rolling Up:
Shortly after making the 1110 adjustment, RUT continued higher. In bearish market environments the market can rally hard and fast. Anyone who traded through last October 2014 will remember how the market can hit a point and reverse in a big way without taking a breath. I became much more concerned about the upside in this trade after RUT tested the lows and started to rally hard. The market seemed like it wanted to move irrationally higher after the lows held . . . and it did.
Rather than add a third Butterfly to the CIB, I rolled the 1090 Butterfly up to 1130 leaving me with the 1110 and 1130 Butterflies. Sometimes I prefer to keep the CIB at 2 Butterflies because it keeps the risk under control and makes the position easier to move when the market moves.
Adjustment #5 – Adding Again:
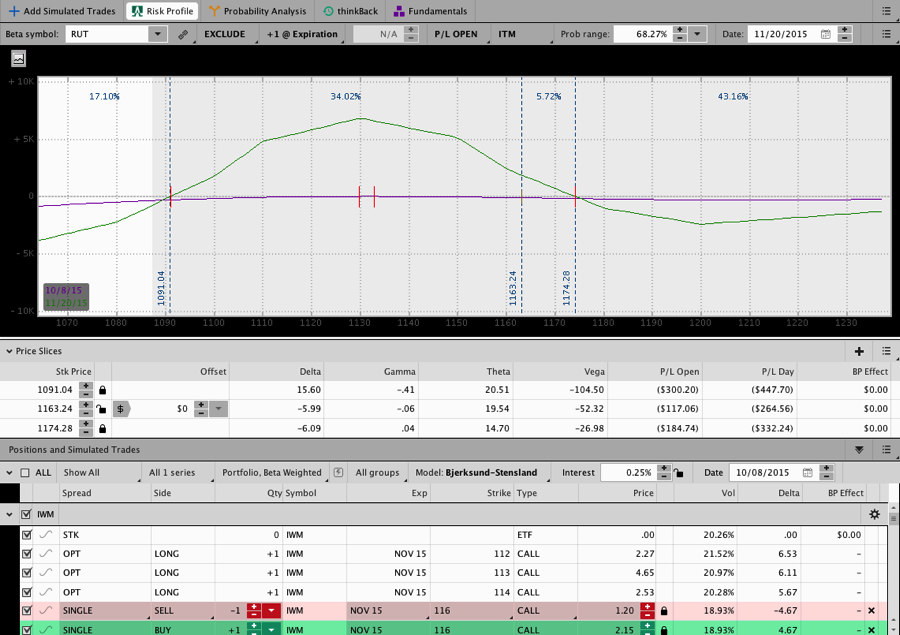
A day or two later my decision to roll rather than add was validated when RUT moved to the 1160’s. At this point, RUT has moved up around 70 points from the low point in the trade. The position is healthy even though it doesn’t have much in the way of open profit. The image below shows the position at full size after adding the 1150 Butterfly.
RUT continued to test higher levels after adding the 1150 Butterfly, but it never made it to the next upside adjustment point. The area in the low 1170’s was tested a couple of times and RUT couldn’t get the strength to push higher. Fortunately for the position, the market fell lower to the 1140’s a few days later.
Side Note: A few days after adding the 1150 Butterfly I also purchased a 5 Delta IWM Put. I’ve decided to begin hedging against disasters when the position reaches full size. I’m generally not concerned about moves lower, but I am concerned about catastrophic gaps lower on unexpected news. When the CIB is small a total loss would be around 10-15% of intended capital for risk management purposes. However as the position increases in size, a total loss represents up to 40-60% of intended capital. While the potential of taking that size loss is highly unlikely, it is an amount that would take a significant amount of time to overcome. Some smaller traders will take excessive risk because the dollar amount of risk is low. I believe in developing scalable strategies with a heavy focus on controlling both immediate and absolute risk.
Peeling Exit #1:
RUT tested the low 1170’s area and failed to make it higher. After giving up there, the market traded lower into the 1140 area. I used the pullback as an opportunity to peel off the highest 1150 Butterfly to cut risk and flatten out the T+Zero line. As you can see in the image below, the trade was getting close to the target profit and the position looked good.
Full Close:
The image above is the last picture I have of the trade prior to the full close on October 15th. The trade exceeded the target and was taken off fairly early with 36 or so days to expiration. The position could have been left open, but the trade guidelines called for an exit so I chose to close the trade and I’m waiting for the December options to get a little closer to expiration before taking the next trade.
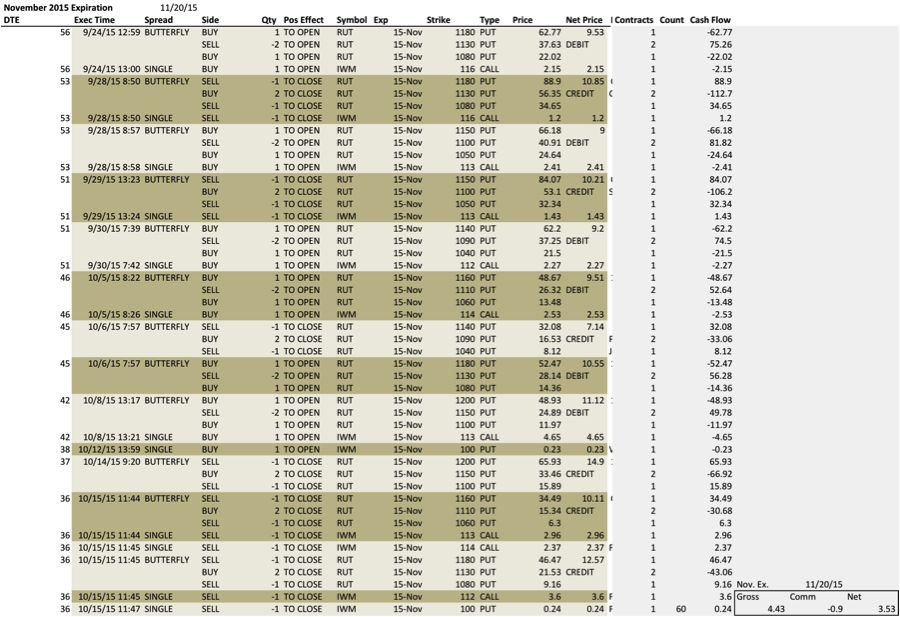
The November Butterfly grossed 4.43 and net 3.53 in around 3 weeks. That return represents around 3.5% on intended capital and the 2015 Results spreadsheet is updated.
Click here to learn about the Premium Course that covers the CIB Trade in Detail
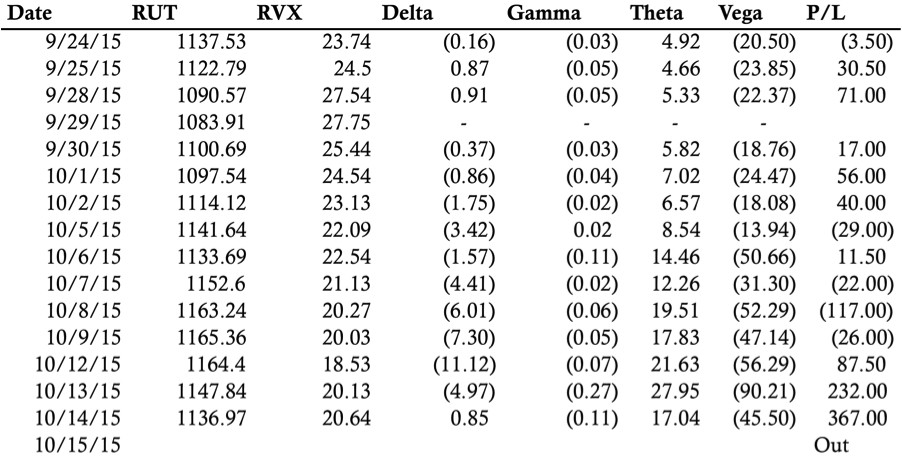
Daily Greeks:
Order History: