Weekend Market Commentary 10/9/15 – $RUT, $RVX, $SPX, $VIX, $VXV
Big Picture:
It’s hard to believe that a little over a week ago the markets looked like they could push lower and I was concerned about moving my November CIB down. Having an opinion about the market is fine, but it’s essential to trade what plays out rather than what we think will happen. This week the Russell 2000 had a 2.5 standard deviation up week, but that doesn’t mean the market is becoming bullish.
From a technical analysis standpoint, the RUT is still below declining 50 and 200 day moving averages and has not made a higher high on the daily timeframe. Fast and significant moves to the upside can take place even within a bear market. As anyone who traded through last October will remember, the market can move up faster when it’s under the 50 and 200 day moving averages than when it’s above them. That being said, I’m not ready to say we’ve seen a V-Bottom and that we’re heading higher. Unless, of course, the government continues some sort of money dump into the markets. Seriously, they can’t be trusted.
If you’re a non-directional options trader, this is not the time to be a hero. Implied volatility has come off quite a bit and realized volatility is on the rise. That type of environment is dangerous for premium sellers who get on the wrong side of the market.
In response to the 4.6% move higher in the RUT this week, I’ve been moving up the CIB. Earlier in the week I was at an add point, but I chose to roll the position higher rather than add. Part of the reason I chose to trade the position differently this month is the speed. I’ve been around long enough to know that when RUT starts moving higher fast, it is likely to continue. Additionally, the market always has the potential to go further than we expect it to go. Rolling up, rather than adding, proved to be the right move for now. We can only trade what has happened or is happening. Trading what we want to happen is a genuinely bad plan.
Market Stats:
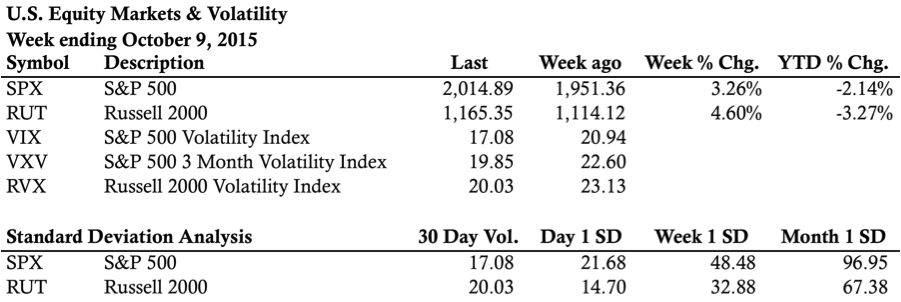
Levels of Interest:
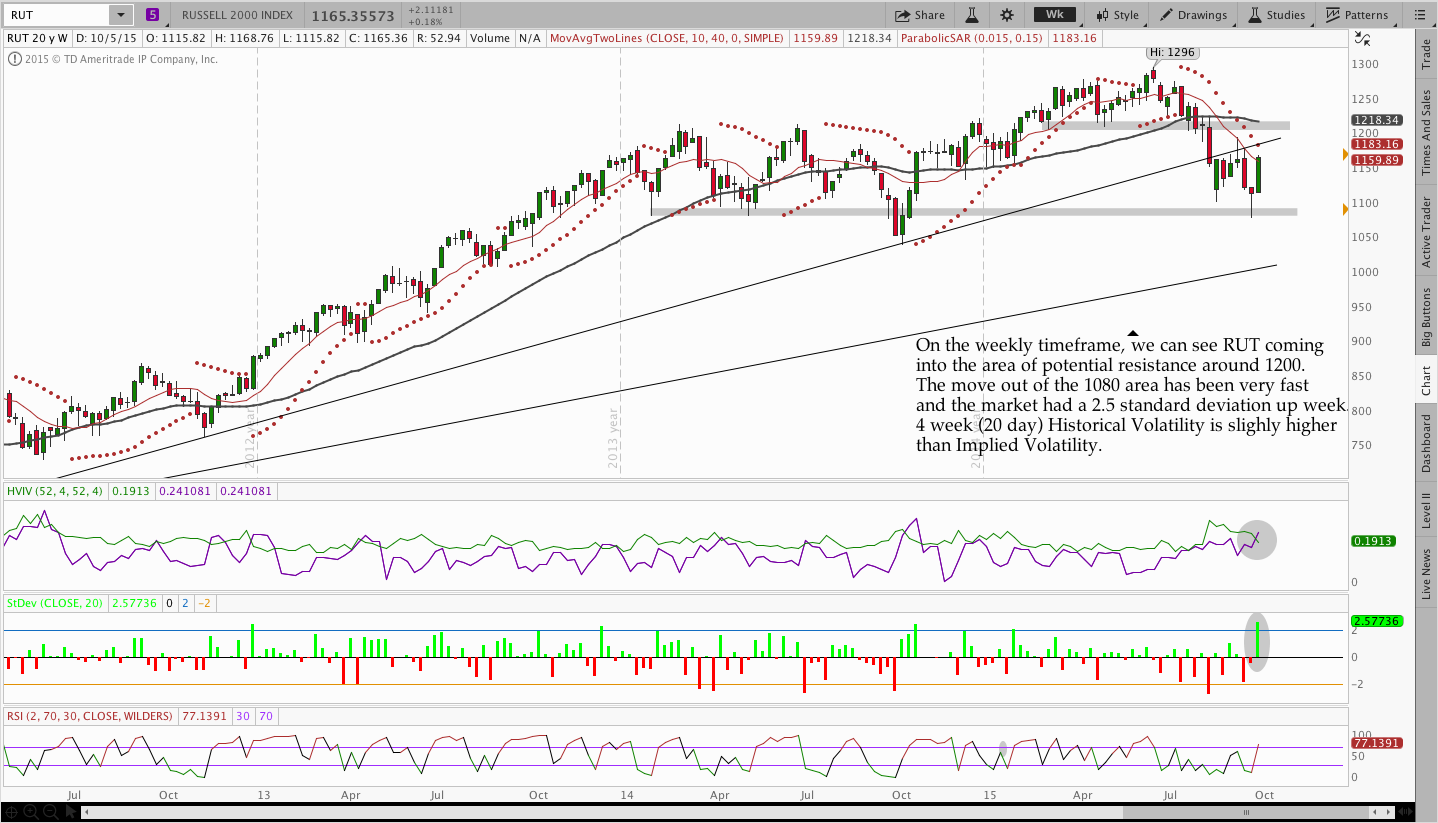
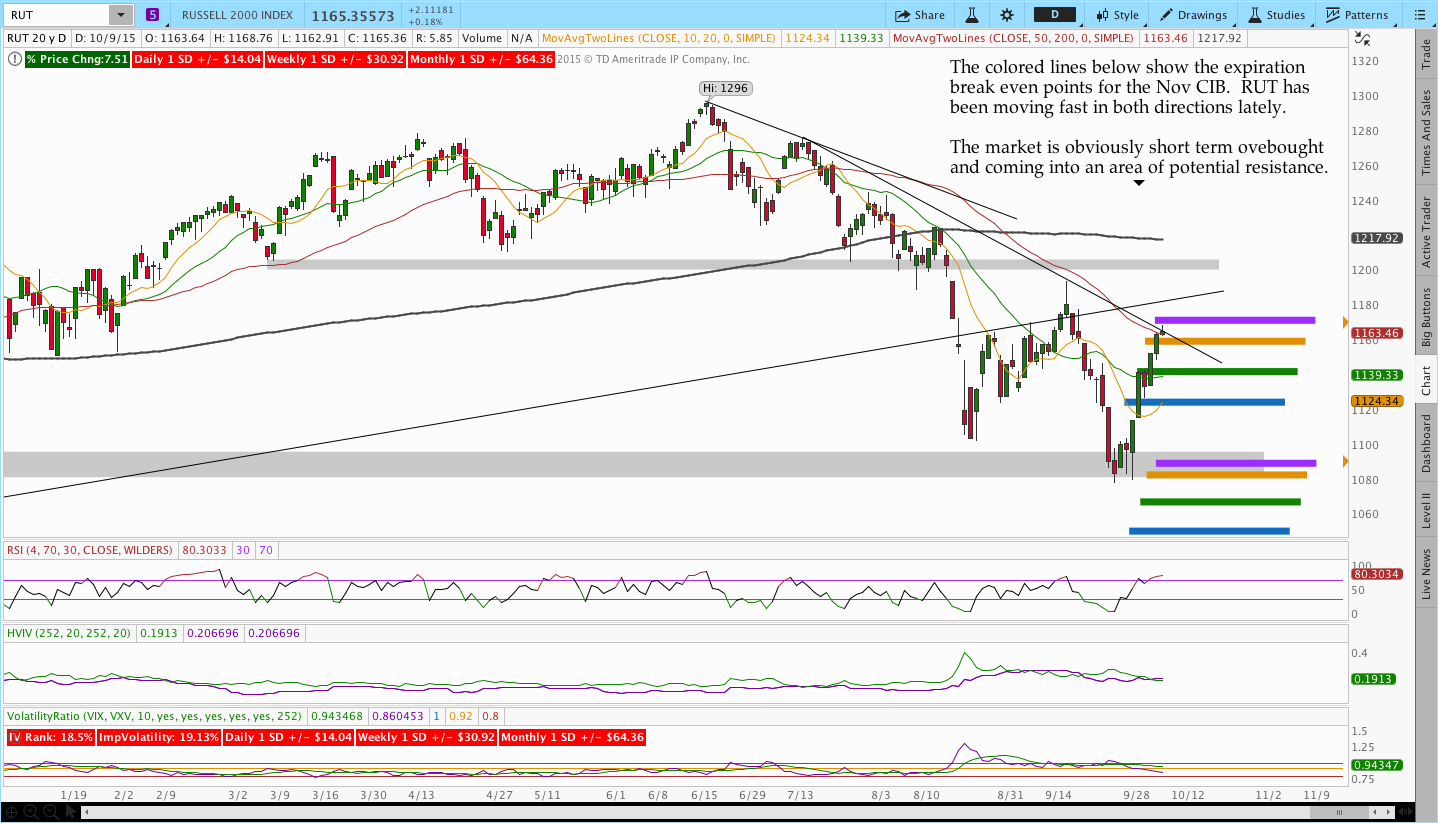
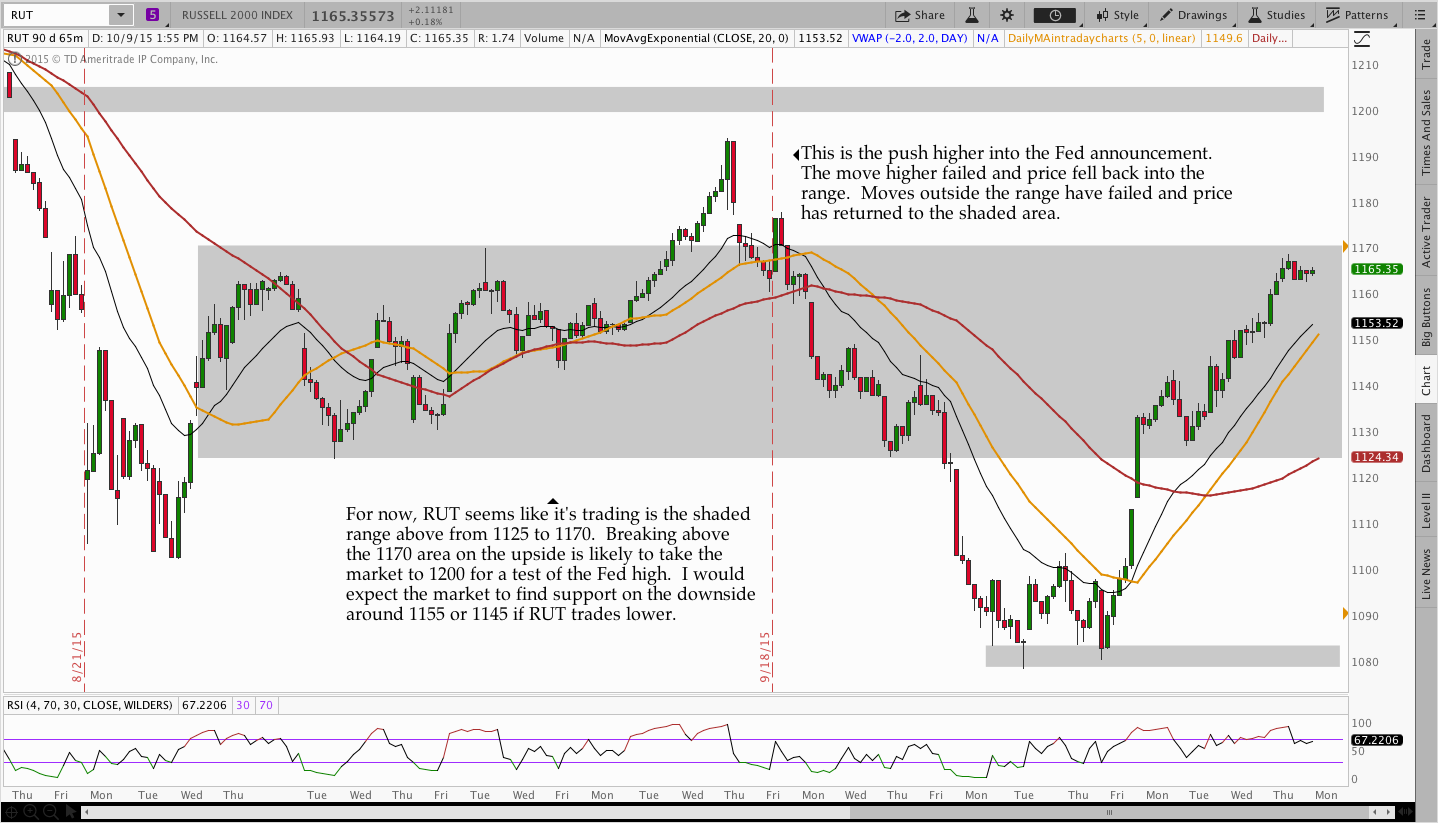
In the levels of interest section, we’re drilling down through some timeframes to see what’s happening in the markets. The analysis begins on a weekly chart, moves to a daily chart, and finishes with the intraday, 65 minute chart of the Russell 2000 ($RUT). Multiple timeframes from a high level create context for what’s happening in the market.
Live Trades . . .
The “Live Trades” section of the commentary focuses on actual trades that are in the Theta Trend account. The positions are provided for educational purposes only.
—————————–
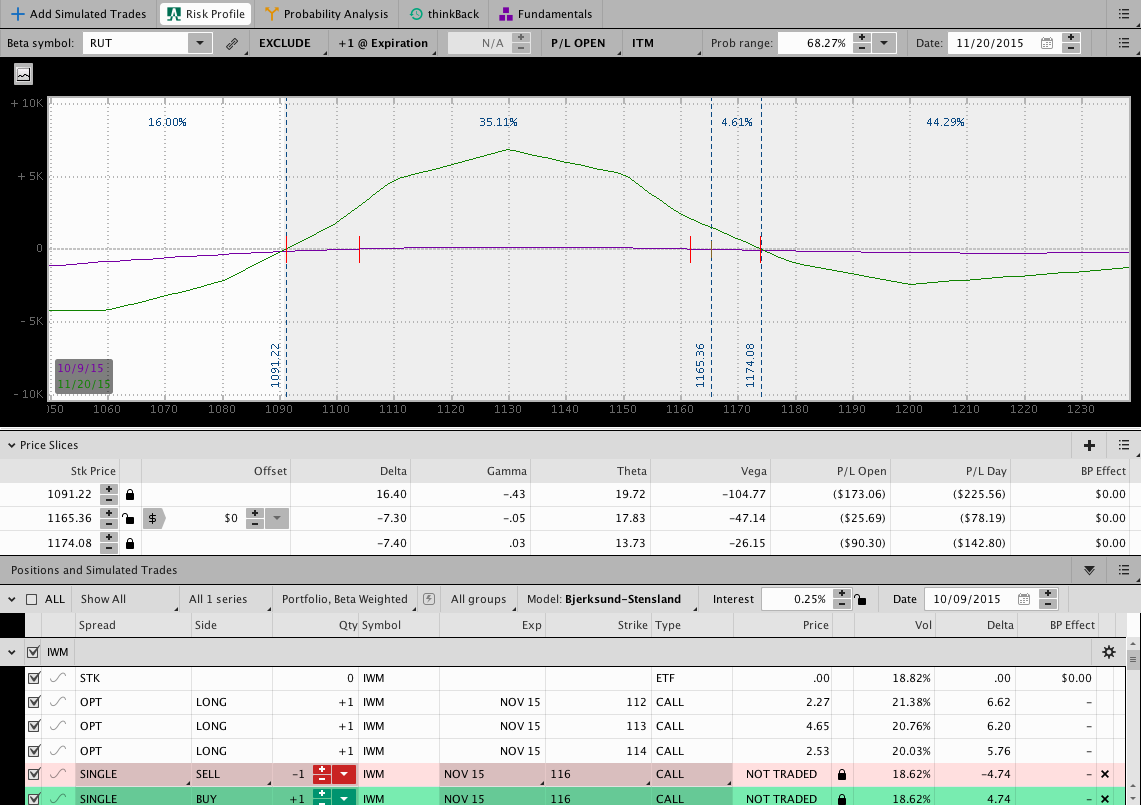
This was a fast and big week higher for the RUT and the November Butterfly (Core Income Butterfly – CIB) has moved up quite a bit. I’ve been doing my best to tweet the adjustments around the time they’re taking place so if you’re not already click here to follow me on Twitter.
I’m calling the trade the Core Income Butterfly because the trade is the foundation of my options income trading. Many people like to use Iron Condors and credit spreads, but I prefer the Butterfly. There’s nothing wrong with either approach, it’s just personal preference.
Last week the position was centered around 1090 and this week there are three Butterflies centered at 1110, 1130, and 1150. The next adjustment point is around 1175. It would be great if I didn’t need to adjust the trade next week so the position has some time to work. As you can see below, despite the big moves higher the trade is healthy and not in any sort of trouble. Maybe this week RUT will remember how to make a red candle on the daily timeframe.
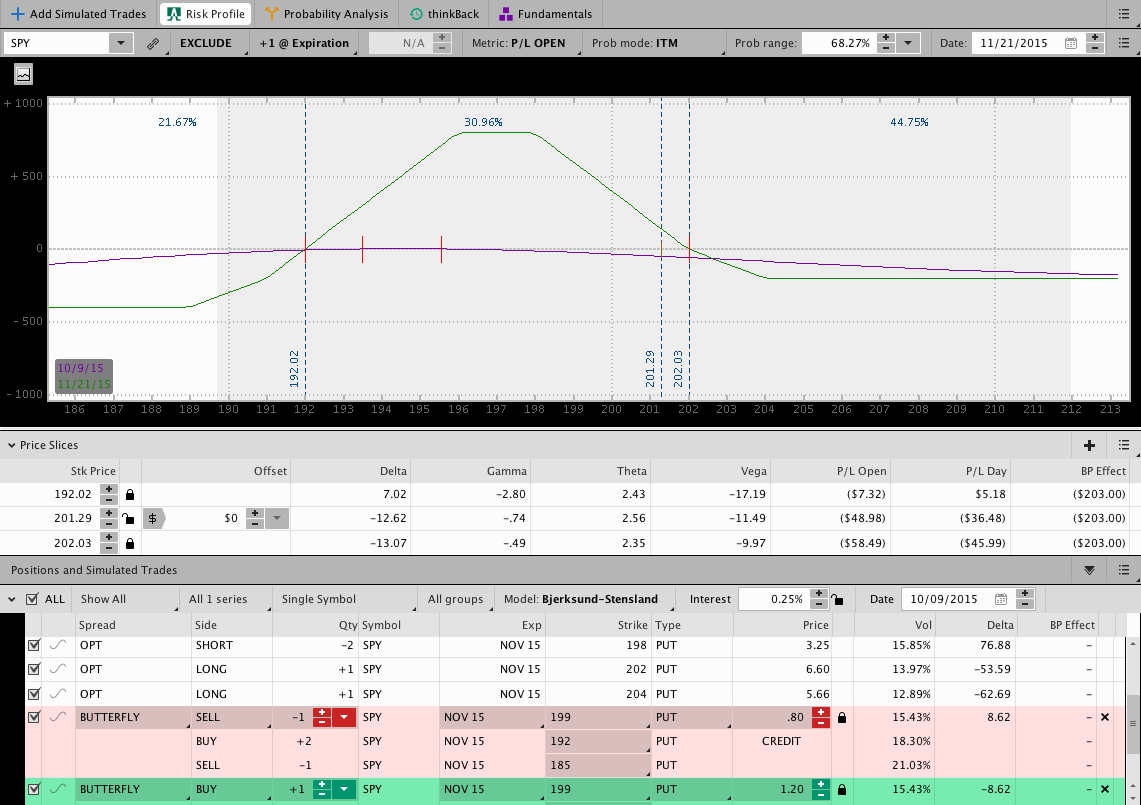
An updated image of the Migrating Butterfly is shown below. As a reminder, I’m trading this strategy in a very small IRA as a way of forward testing it. As you can see, the trade is under some pressure and will definitely benefit from a pull-back in SPY. The initial Butterfly was at 192 and that was added to and rolled higher this week.
Note that SPY has moved less than RUT and this position was also initiated later than the CIB. The CIB looks much healthier because that trade is long calls that protect the upside. In the Migrating Butterfly below, there are no long calls so the trade experiences greater equity fluctuations and drawdowns. I don’t particularly like that aspect of the trade, but the trade is too small to buy calls against the position. We’ll see how this one plays out.
Looking ahead, etc.:
It looks like the RUT is solidly back into the range that has developed since the move lower in late August. Price is near the top of that range and the market is extended so it “seems” like the market should take a break. We won’t know until after the fact. I do think a move beyond 1200 is unlikely at this point, but pushing above the Fed high and failing is definitely a possibility in the next couple/few weeks.
Don’t listen to the hype on the news or get too complacent either, the market is fickle and likes to change it’s mind quickly when nobody expects it.
Thanks for reading and have a great weekend.
Please share this post if you enjoyed it.
Click here to follow me on Twitter.
Want to receive an alert as soon as the next market commentary is posted?

Sign up for my email list and stay up to date with the latest information on options trading.
Click here to sign up for the list, get a copy of the Theta Trend Options Trading System, the Trade Tacker I use, and information about new systems.
Even better . . . it’s all totally free.