$RUT February 2016 Core Income Butterfly (CIB) Options Trade Review
Overview:
In early January 2016, the February 2016 Core Income Butterfly (the trade used February options) was closed and this post is a recap of the trade. The position was short lived and profitable, went through an up move early on, and a down move later in the trade. The market made it outside of the tent on both sides of the Butterfly at different points in the trade, but the position never took much heat.
Market Environment:
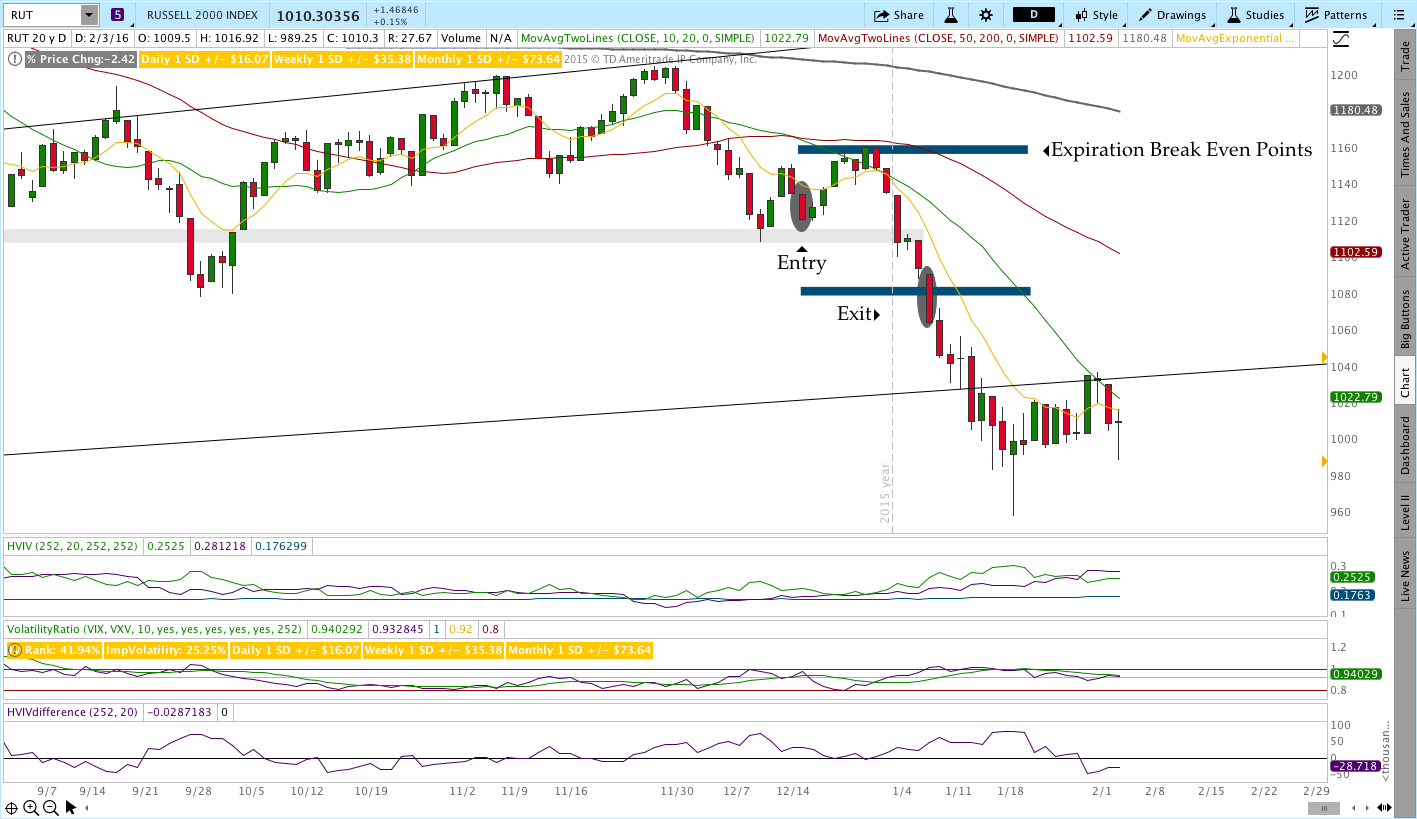
The trade was entered on December 18, 2015 when I bought the 1070/1120/1170 Feb 2016 Put Butterfly for 10.55 with the 115 Feb 2016 IWM Call for 2.07. At the time the market was trading around 1130 and getting ready to decline. The chart below shows the entry and exit days as well as the expiration break evens for the initial position.
Position on the day of entry:
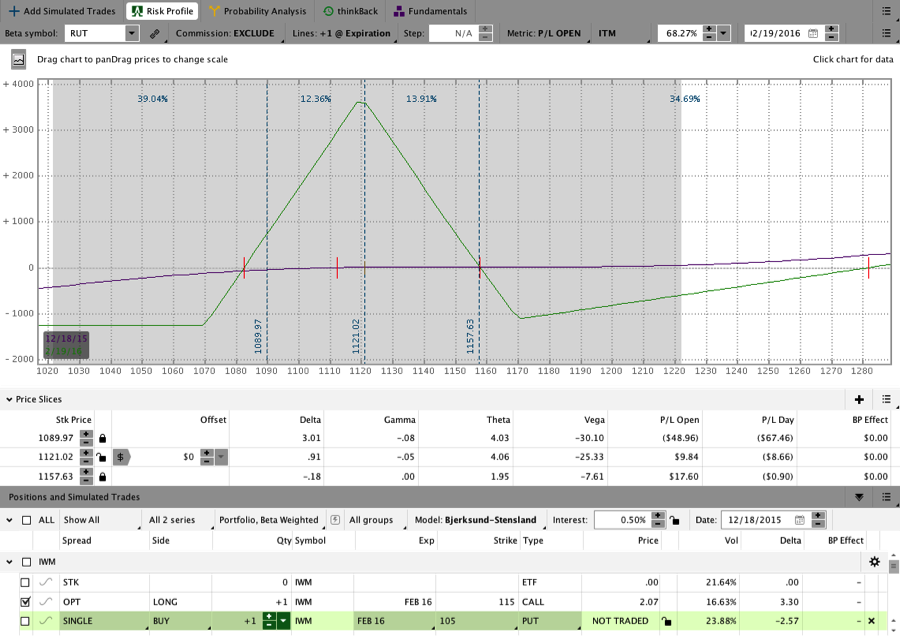
Nearing an upside adjustment:
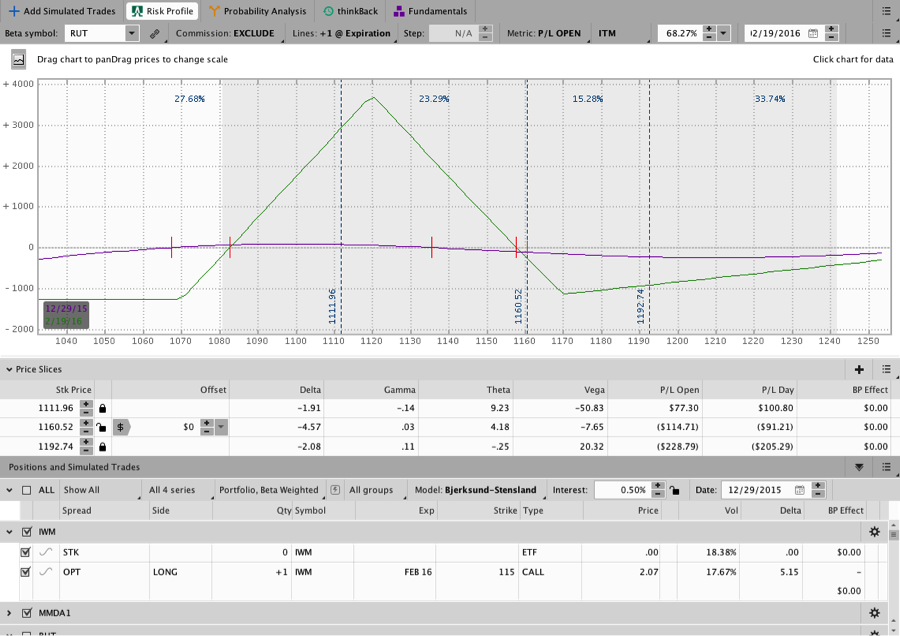
On December 29, 2015 the trade was sitting right around an upside adjustment point. The market closed outside the body of the Butterfly and I had plans to adjust the trade the following day if necessary. Following that close, the market traded lower and the upside adjustment was never made.
The image below shows the position with the market outside the body of the Butterfly. On that day, the trade was down a little over $100, but the bigger concern is that the T+Zero line was diving. The reason I wasn’t racing to make an adjustment is that the T+Zero line was flatter during the trading day and the closing value made the position look worse than it had all day. I’m comfortable letting the market getting outside of the tent on the upside, but I wish I had added the second upside Butterfly so I could have peeled it off a few days later for a profit.
The wrong adjustment:
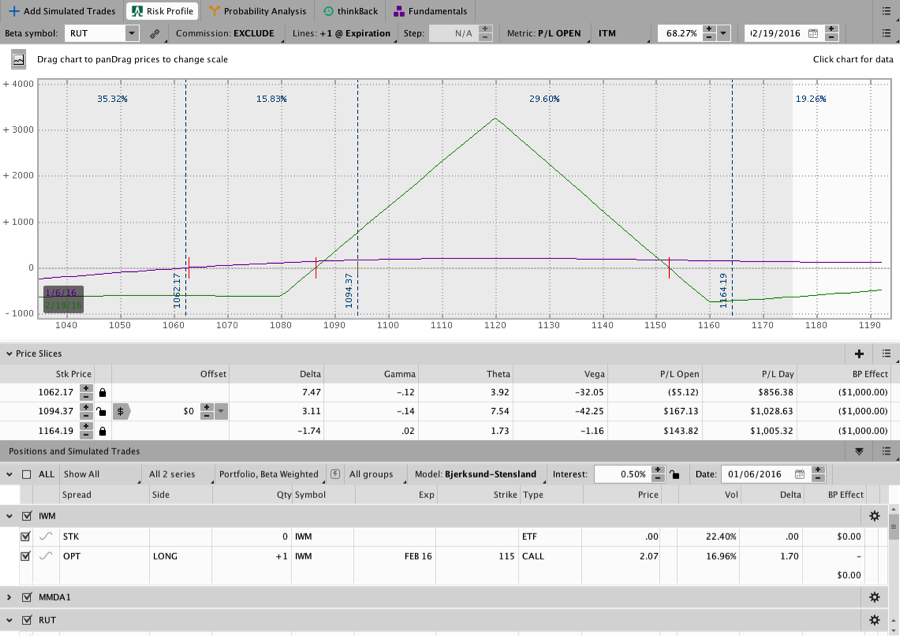
A few days after the market was at an upside adjustment point, RUT reversed and was trading in the lower part of the Butterfly. At the time I was concerned about the market reversing and heading higher so I decided to “Reverse Harvey” the position. The adjustment flatted out the T+Zero line considerably and gave some additional protection on the upside.
An image of the position following the adjustment is shown below. At the time, the market was trading around 1094 and my upside directional risk was minimal with the T+Zero line floating above zero. The Reverse Harvey was accomplished by selling the 1070 and 1170 Puts and buying new longs closer to the money at 1080 and 1160. A video discussing the adjustment can be found here.
Closing the trade:
A couple of days later, RUT opened outside the body of the Butterfly on the downside and I simply closed the position. Had I not made the Reverse Harvey adjustment, the trade would have made more money. Nevertheless, the position was closed for a gross profit of $120 ($99 net) or a 0.82% return for the sample account. I chose not to roll the position lower because the market was in a steady state of decline.
Had I chosen to rolled lower instead of simply closing, I would have been rolling lower again a few days later. Doing that would have been fine for the trade because the CIB tends to benefit from down moves and we never had an unexpected gap. I had other trades on at the time and taking a smaller gain and waiting until the next month seemed reasonable.
The trade never tied up much capital, took a limited amount of heat, and went through a down move that gapped outside the body of the tent without losing money. I certainly could have pushed for more with the February CIB, but I’m a cautious guy and with other trades still open I decided to reduce risk and step aside.
The sample account ended the month of January with a 1.48% gain while the markets were broadly lower and many options traders struggled. I will also point out that the sample account never experienced an unrealized loss (on open positions) in excess of 1%. While other traders took larger directional risks, we controlled our exposure, heat, and never took excessive risks. The Results Spreadsheet shows the closed January trades including this position.