Weekend Market Recap 12/27/13 – Stocks, Gold, Bonds ($SPY, $IWM, $GLD, $TLT)
Big Picture:
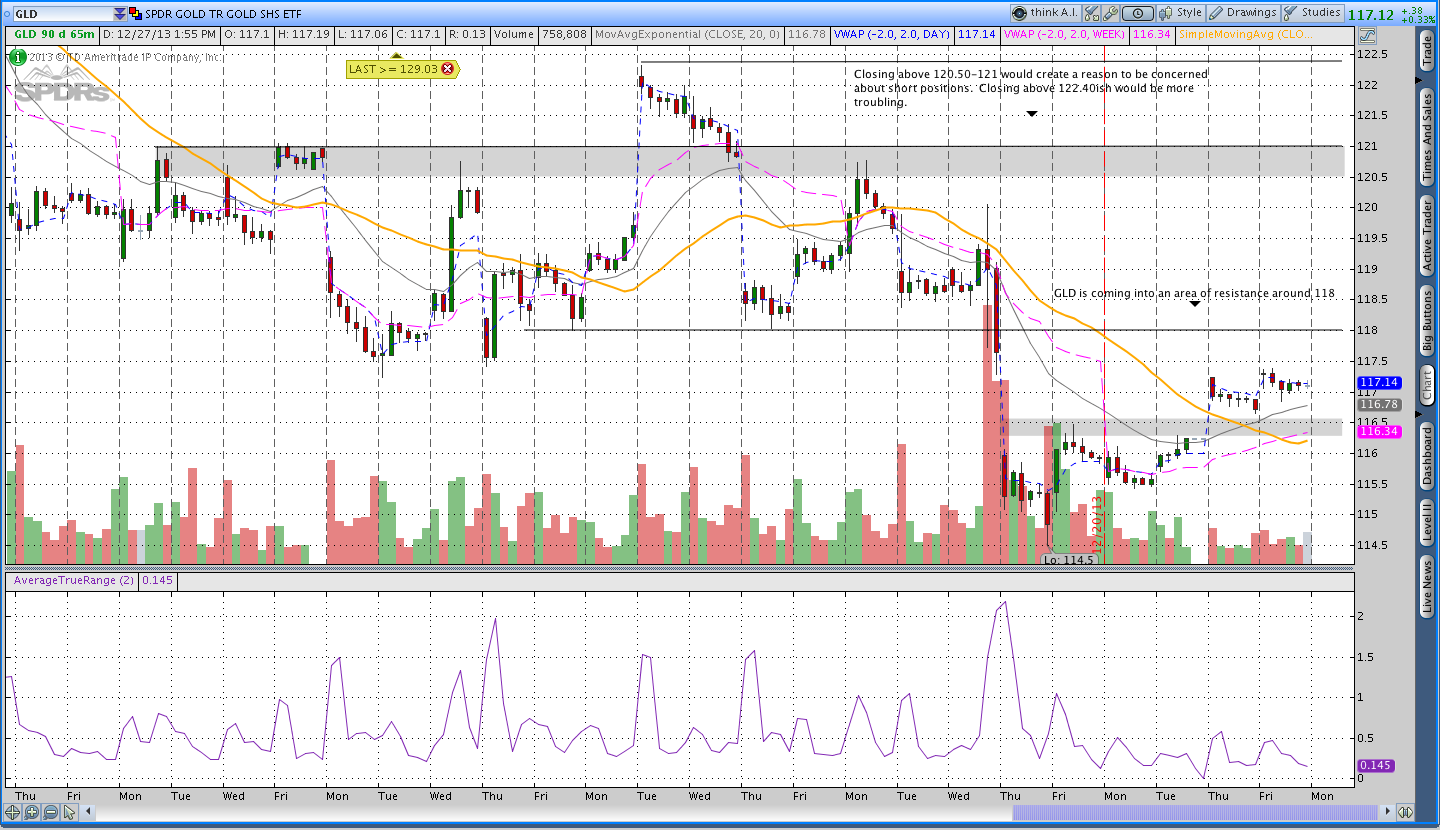
 Happy Holidays and thanks for reading the weekly recap. As expected, we had a fairly quiet week with the Christmas holiday. Stocks generally pushed higher while Gold and Bonds moved lower. I’m including some commentary on a shorter timeframe for the Russell 2000 and Gold below (65 minute bars). Let me know if you like the discussion in the comments below and I’ll begin including shorter term timeframes in the weekly discussion. Note that I look to lower timeframes to anticipate trouble and time entry when I’m trading options, but my trades always follow the systems.
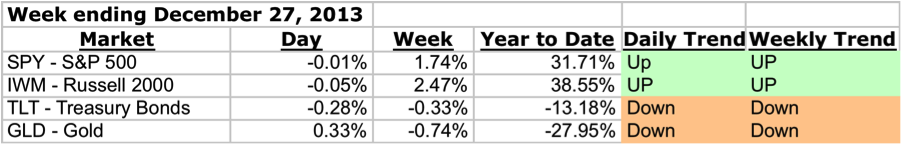
The Weekly Stats:
A note about trend . . . Trend on the daily timeframe is defined using Donchian channels and an Average True Range Trailing Stop. There are three trend states on the Daily timeframe: up, neutral, and down. On the weekly timeframe, I’m looking at Parabolic SAR to define trend and there are two trend states, up and down. In reality, there are always periods of chop and I’m using the indicator to capture the general bias of both the trend and those periods of chop.
Stocks ($SPY – SPDR S&P 500 ETF and $IWM – iShares Russell 2000 Index ETF):
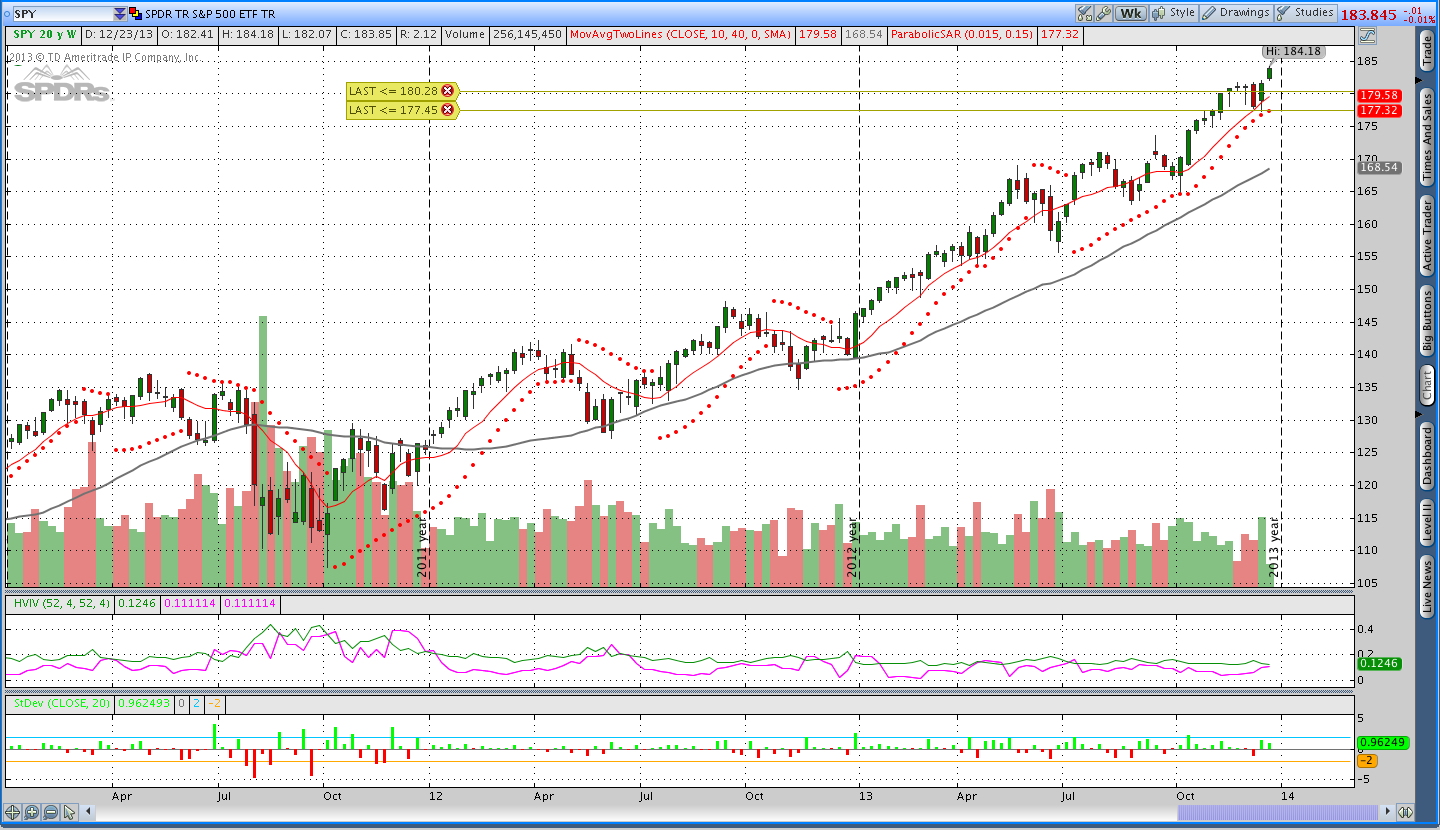
Stocks ended the week with a gain even though the Russell 2000 began to show signs of weakness on Thursday. Monday put stocks up above their highs for last week, Tuesday pushed higher, and the end of the week looked soft on low volume. It’s hard to put much credit into the moves we see during the Holiday weeks because there are so many participants out of the market, but price is price and stocks closed at new all time highs.
Early in the week I was looking for an opportunity to sell a SPY put, but prices pushed higher and I decided to wait. On the weekly chart the Parabolic SAR is getting very close to the $SPY price, which makes the risk/reward attractive albeit with an increased chance of a stop hit.
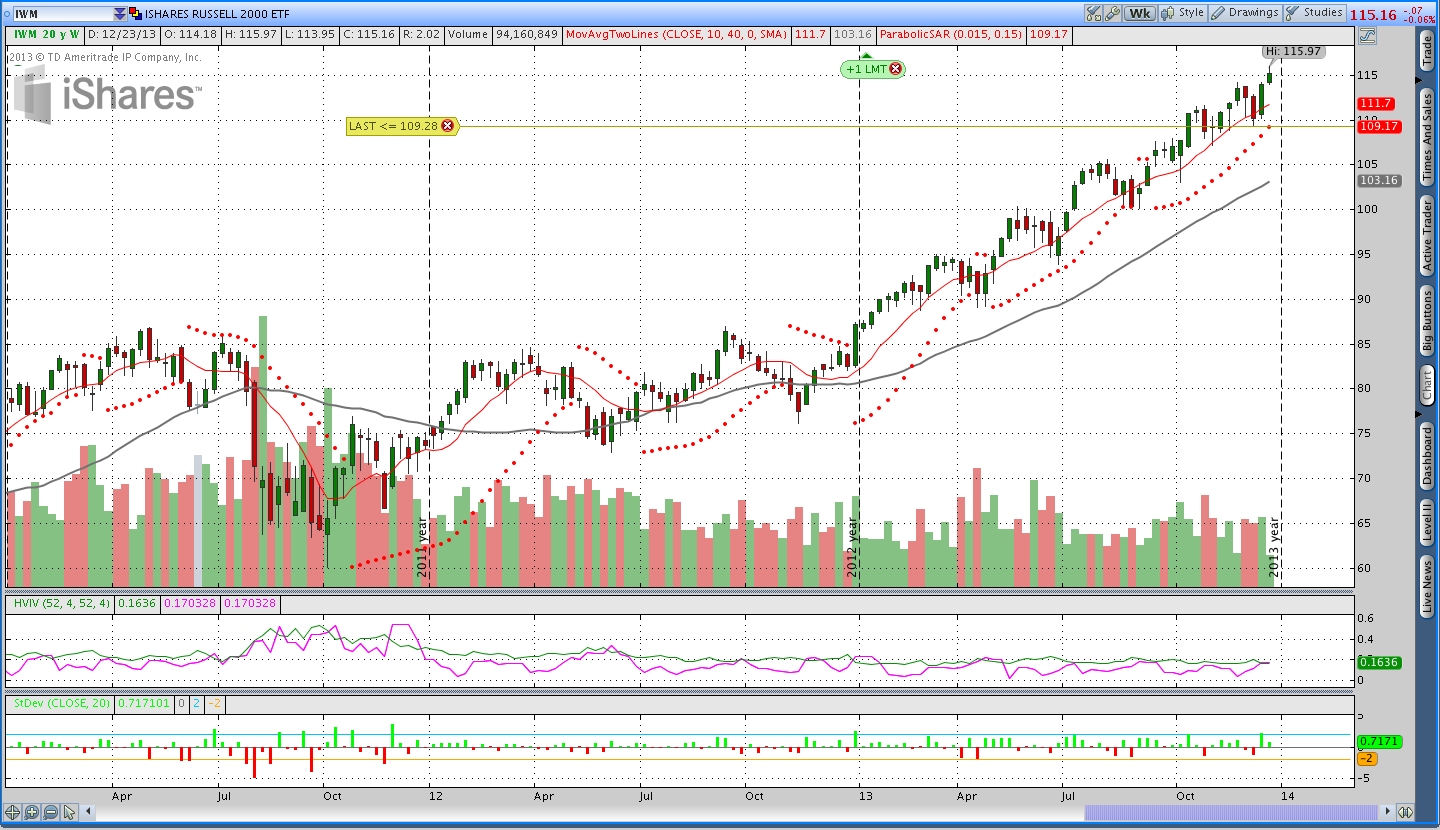
Stocks have been up in a big way all year and the Russell 2000 has led the charge, but it seems like there is still a good amount of skepticism surrounding the rally. That public skepticism makes me wonder if we’ll see higher stock prices in 2014 despite all of the fundamental reasons for a correction. Markets can continue trends long beyond what anyone believes possible and right now we’re not seeing anything in price that indicates the rally is weakening. Until price weakens, I’ll continue to be long stocks.
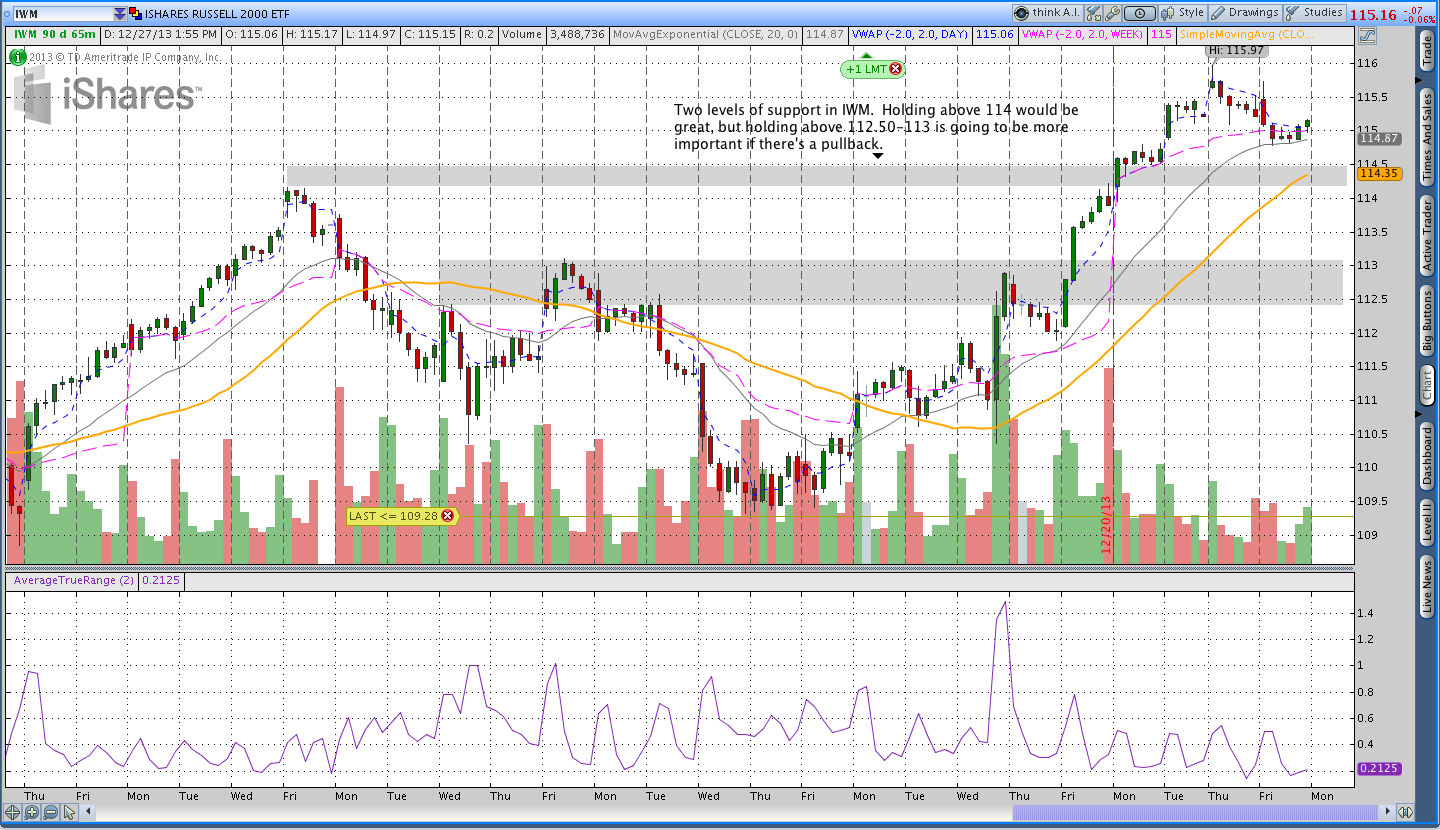
I was able to close the short $IWM Jan 14 96 Put for a nickel and that leaves me with a naked $IWM Mar 14 94 Put. I’ve outlined a couple of levels that I’m watching in $IWM below. If prices break down, I’d like to see the first level of support at 114.20-114.50 hold. However, if we get a more panicked or slightly deeper pullback, 112.50-113 is going to be the next big area.
Gold ($GLD – SPDR Gold Shares ETF):
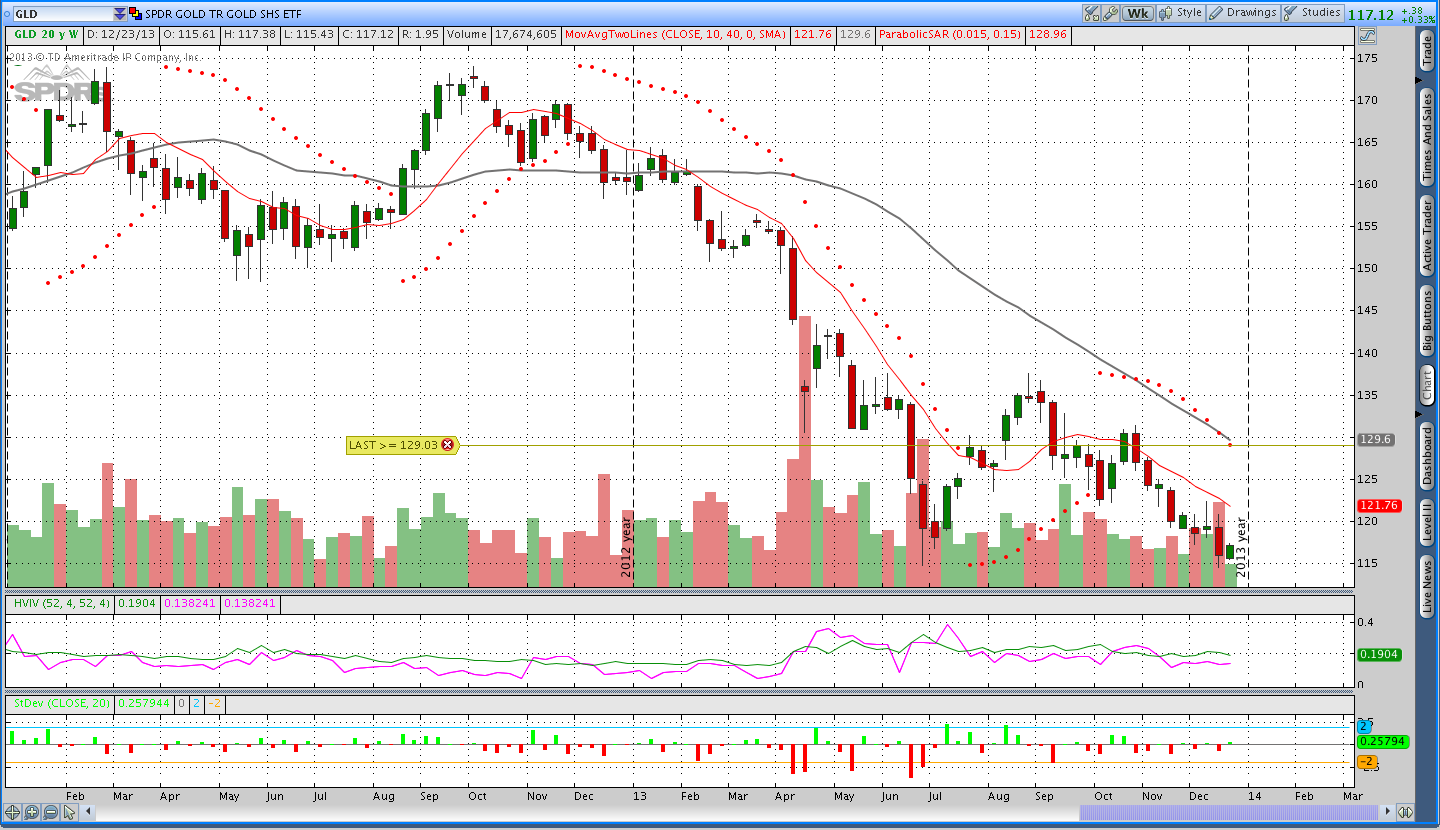
Gold broke lower last week and drifted higher this week. The move lower we saw last week slightly undercut the previous multi-year low in June. My sense is that Gold could be setting up for a fast move in one direction or another. I don’t expect the trend to completely reverse and head higher, but I wouldn’t be surprised by move lower that clears out stops and then sharply reverses. That being said, Gold continues to be in a primary down trend on the daily and weekly chart and I’ll be short until that changes.
Bonds ($TLT – iShares Barclays 20+ Year Treasury Bond ETF):
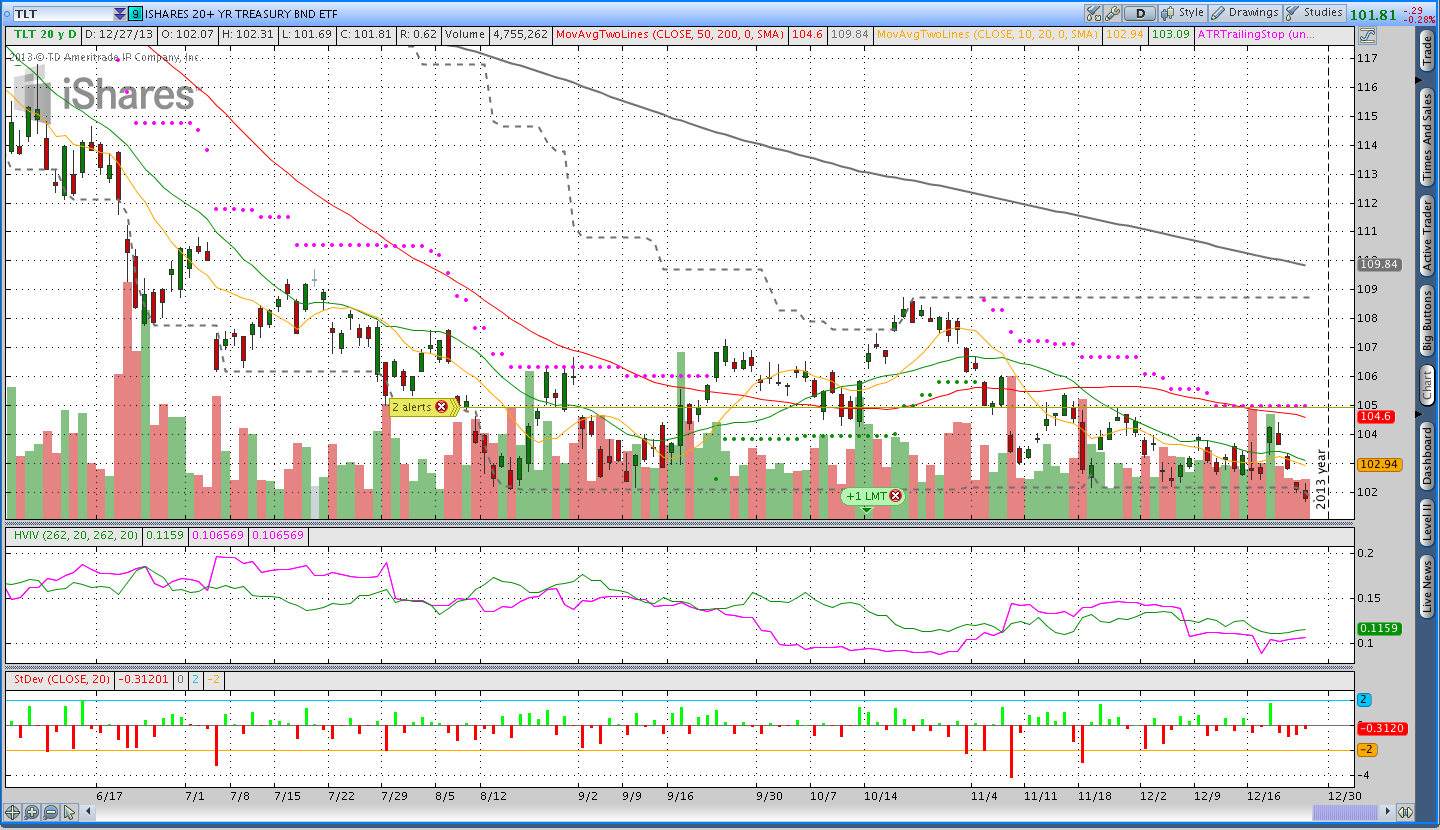
Last week I mentioned that Bonds looked like they had formed a higher low and a higher high on the daily chart. This week that higher low was violated and the trend continued lower. In the 106/110 TLT vertical I have open, I saw my position delta fall off significantly this week from around 20+ to 12. I was and continue to be short bonds.
Trades This Week:
IWM – Covered Short Jan 2014 96 Put for .05 = Net .425 gain after commissions
DBE – Bought 109 Shares at 29.30 on a new 50 day high
EUR/USD – Bought 4,000 notional units at 1.38321 (looks like I got drawn in on a stop run, little bastard)
Option Inventory:
IWM – Short Mar 2014 94 Put (sold for .70)
GLD – Short March 2014 139 Call (sold for .53)
TLT – Feb. 2014 106/106 Call Credit Spread (sold for .70)
ETF & Forex Inventory:
DBE – Long 109 shares at 29.30
NZD/JPY – Long 3,000 notional units at 80.56
USD/JPY – Long 4,000 notional units at 100.61 and long another 4,000 at 101.64
USD/CHF – Short 4,000 notional units from .8874
EUR/USD – Long 4,000 notional units from 1.38321
Looking ahead:
I’m expecting another quiet week next week, but I’m looking for some volatility to come back into the market soon. I feel like there is a move waiting to take place in Gold and it will be interesting to see how it plays out. Next week I’ll be taking new Donchian channel signals and monitoring open positions.
Thanks for reading and if you enjoyed the recap, please share it using your favorite social media link above. Additionally, if you’d like me to spend more time covering short timeframes (like the 65 minute charts), let me know that in the comments below. Have a good rest of the weekend.