Weekend Market Commentary 2/7/14 – Stocks, Bonds, Gold, Commodities, Real Estate
Big Picture:
 This week equities finished on an up note and several trade signals were triggered. I opened positions in USD/JPY, NZD/JPY, $IWM, $TLT, and $IYR. Additionally, my open trade in Coffee ($JO) was up in a big way and I took a few shares off the table because the open risk had jumped to 6% of account equity . . . . we’ll talk about that below.
Side-note: For those of you who don’t already know, I’m a CPA and work as a tax accountant by day. What that means is that from now through April 15th my life becomes something of challenge. I’ll do my best to tweet out new trades, etc, but my work has really picked up and at times that might not be possible. For some reason, tax clients don’t appreciate you pausing your time with them to tweet trades. Oh well.
Implied Volatility:
Implied volatility for the Russell 2000 and the S&P 500 via the $RVX and $VIX might be giving us some clues as to the near term market direction. In the recent down move in stocks, we saw a new one year high in the $RVX that was not confirmed by the $VIX. That means that there was a greater demand for ATM premium in the Russell 2000 than in the S&P and that people were more concerned about a decline in $RUT.
The rally in stocks at the end of the week caused an implied volatility collapse and ATM IV is now trading right in the middle of the three month range. While I’m won’t trade on it just yet, a move to new highs in stocks is possible, however, stocks haven’t visited the 200 day moving average in quite a while either. For now, the signals are a little mixed, but I don’t think the market is concerned about a big crash any time soon.
The Weekly Stats:
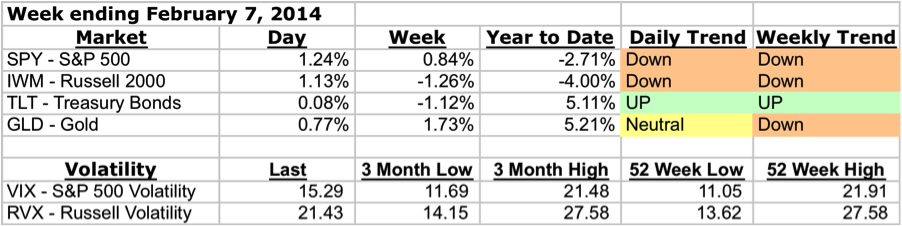
A note about trend . . . Trend on the daily timeframe is defined using Donchian channels and an Average True Range Trailing Stop. There are three trend states on the Daily timeframe: up, neutral, and down. On the weekly timeframe, I’m looking at Parabolic SAR to define trend and there are two trend states, up and down. In reality, there are always periods of chop and I’m using the indicator to capture the general bias of both the trend and those periods of chop.
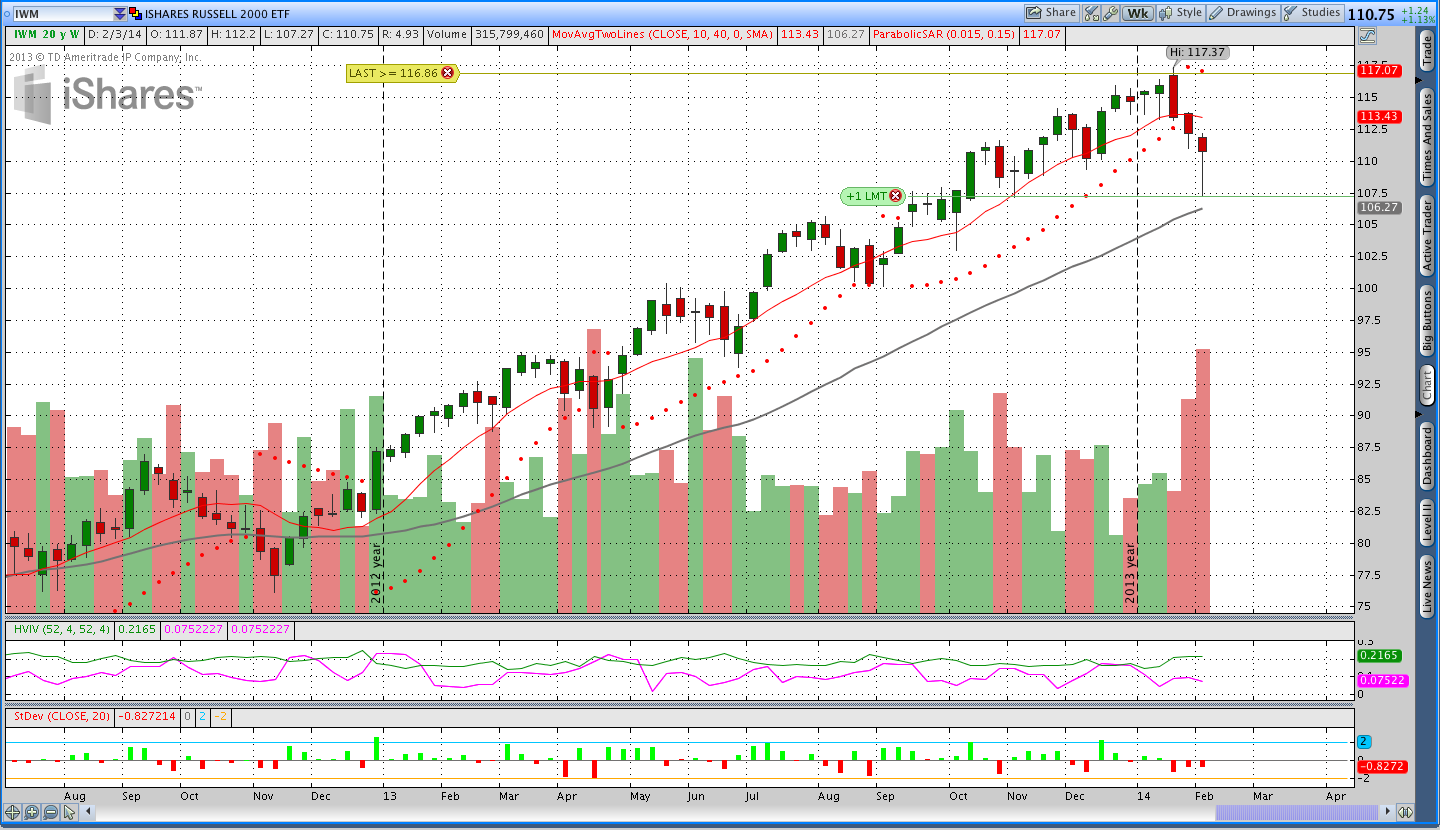
Stocks ($IWM – iShares Russell 2000):
The Russell 2000 was slightly weaker than the S&P 500 this week and I used the rally on Thursday to sell a naked April call. Despite the continued rally on Friday, implied volatility came down significantly and the call ended the week slightly green. Right now the Russell 2000 is below a declining 10 week (50 day) moving average, which does not suggest the higher prices are an immediate concern. pSAR is pointing lower on a weekly timeframe and for now I’m short.
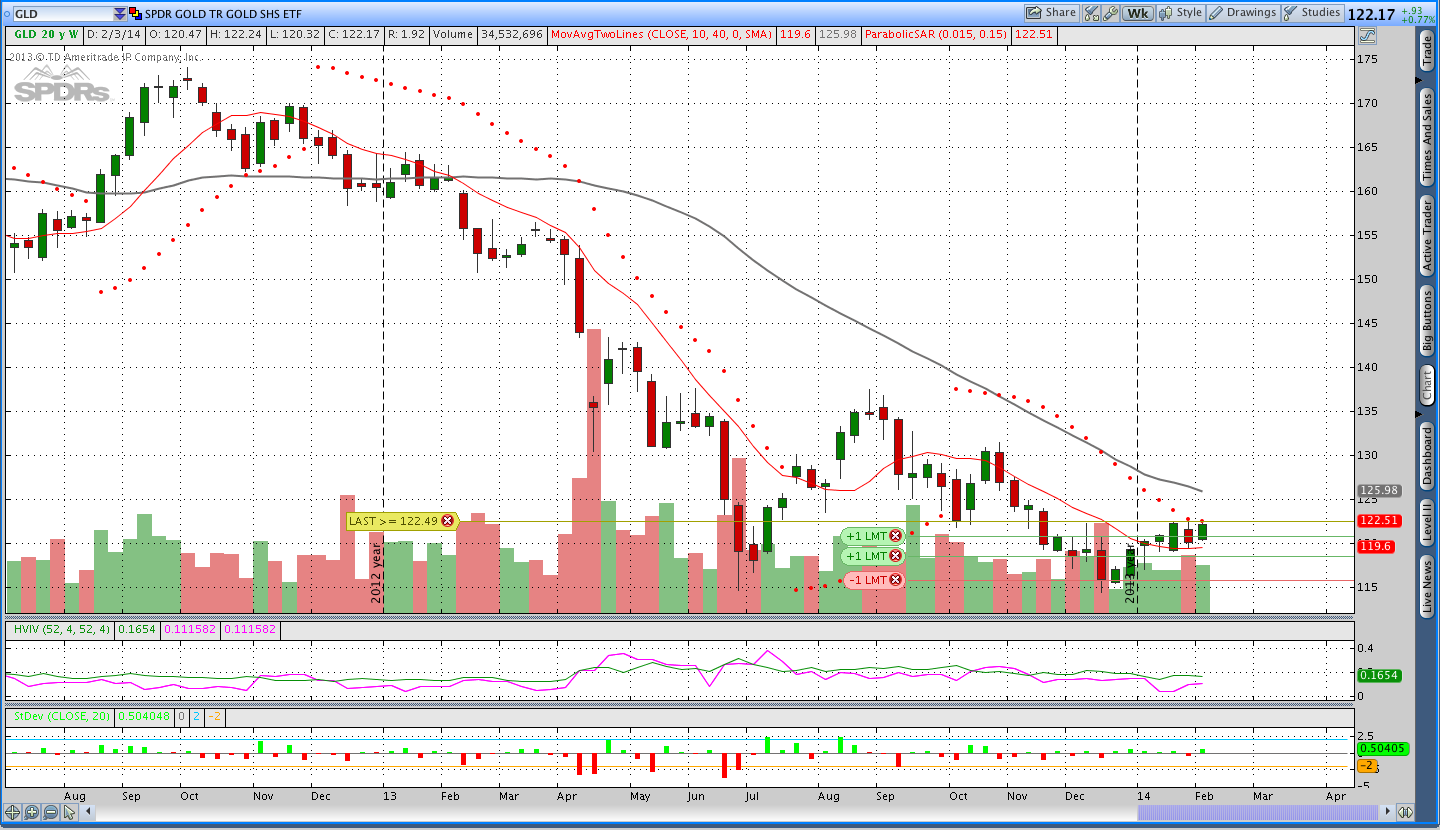
Gold ($GLD – SPDR Gold Shares ETF):
Gold was up this week and I’m amazed that the pSAR wasn’t hit to flip the weekly trend to a long state. Price is right below pSAR and I would not be surprised to see the weekly trend change this week. If that happens, I’ll be closing the short calls and looking for May puts to sell.
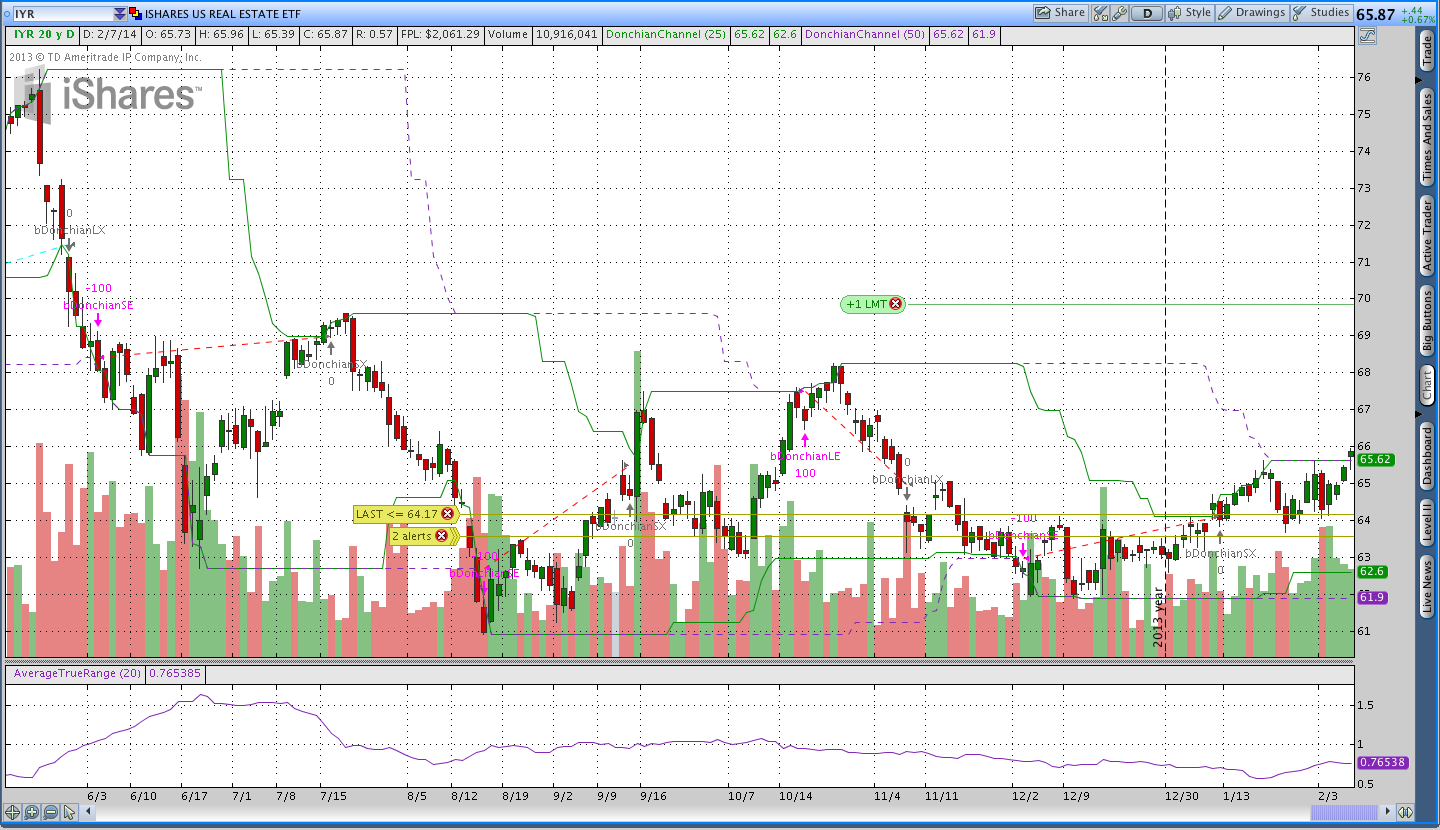
Donchian Channel Breakout Trades:
Last week I mentioned that a new trade in Real Estate ($IYR) might be triggered and on Friday there was a new 50 day high in $IYR. I took both an outright position in $IYR and sold a 13 Delta June put based on the 50 day signal. The idea behind selling the put is that if the trend fails to materialize and price chops around, I’ll still benefit from the decay in the put. The Donchian Channel system buys new 50 day highs and sells on 25 day or 3 x average true range breakdowns.
The June put I sold in $IYR is further out in time than I normal sell, but anything shorter dated and closer to the money wasn’t as favorable from a risk/reward standpoint.
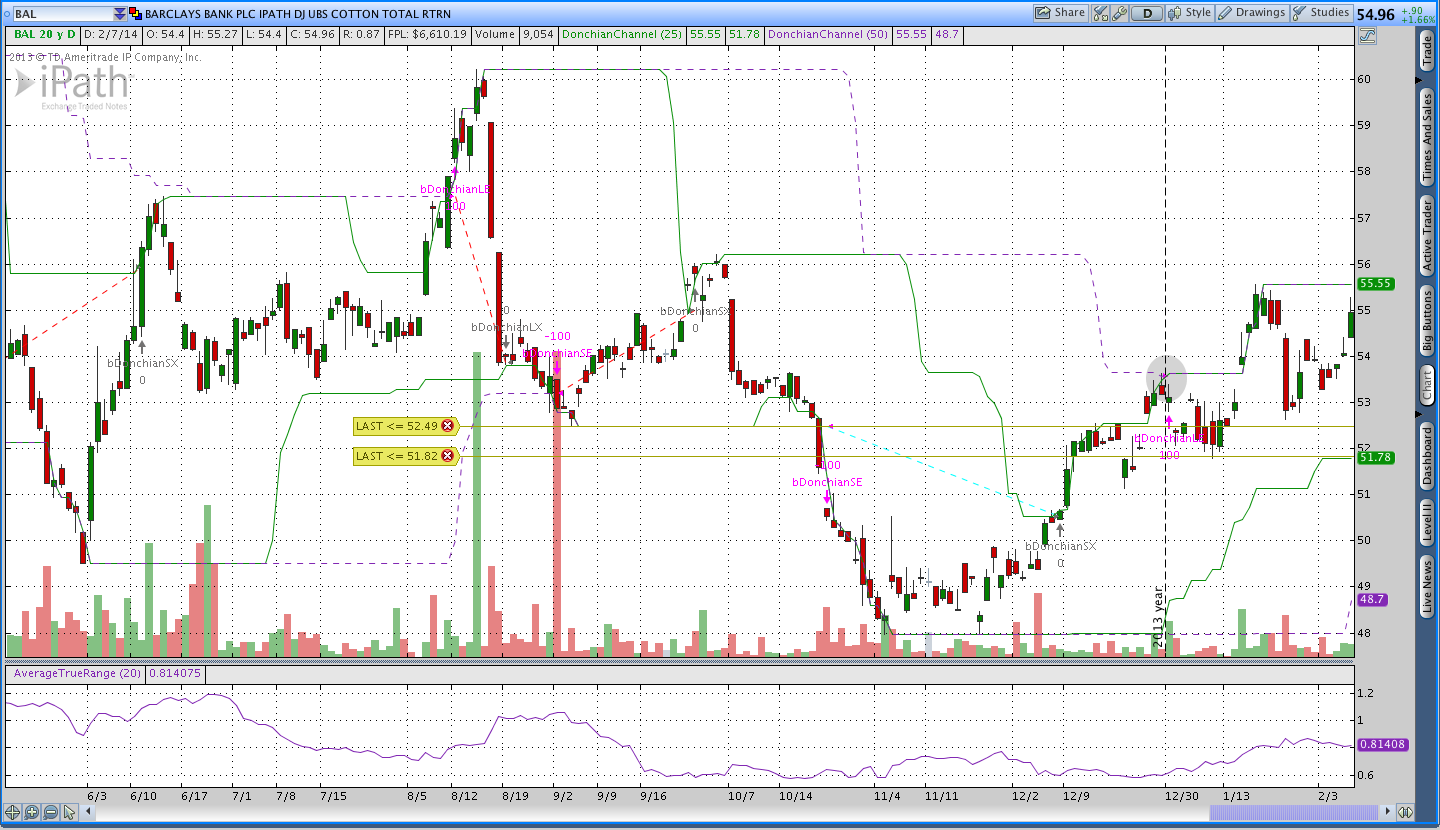
The Cotton ($BAL) trade is still open and up a little bit, but price hasn’t moved significantly. There isn’t much to say about it other than that at this point.
Coffee ($JO) Donchian Channel Breakout Trade:
The Coffee ($JO) trade had a big move higher this week leaving the position with a large unrealized gain. As a result of the large unrealized gain and distance to the stop, I sold part of the $JO position to bring the risk more in line with my intended risk.
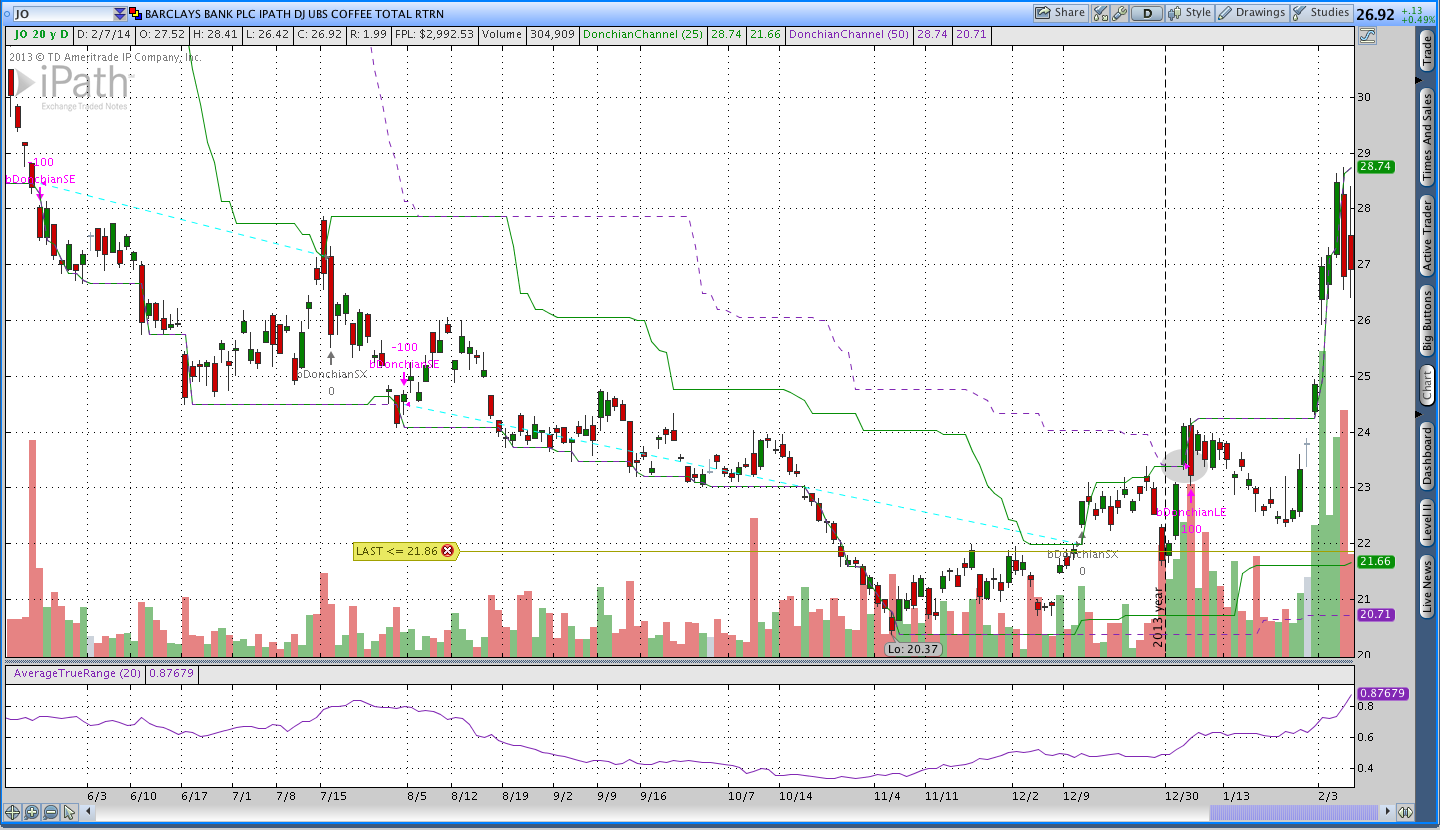
When I initiate a new Donchian channel breakout trade, I’m risking 1% of the account. Assuming the trade immediately moves in my favor 1% and the stop doesn’t move, the open risk becomes roughly 2% (price minus distance to the stop). I like to leave profitable trades more room to work and as a trade goes in my favor it’s not uncommon to see the open risk rise to 3-4% of equity. This week the Coffee trade jumped to an open risk of over 6% of equity and I decided to take a little bit of risk off the table. While I’m comfortable with trailing stops well below the market price, I’m not comfortable risking 6% on the way down to the stop.
Trades This Week:
IWM – Sold an April Call
TLT – Sold a May Put
IYR – Bought to open – 39 shares
IYR – Sold a June Put
JO – Sold 10 shares to reduce open risk
USD/JPY – Sold Short 3,000 Notional Units
NZD/JPY – Sold Short 3,000 Notional Units
Option Inventory:
GLD – Short March 2014 139 Call (sold for .53)
GLD – Short April 2014 133 Call (sold for .50)
IWM – Short April 2014 119 Call (sold for .56)
TLT – Short May 2014 99 Put (sold for .55)
IYR – Short June 2014 57 Put (sold for .58)
ETF & Forex Inventory:
BAL (Cotton) – Long 50 shares from 53.19
JO (Coffee) – Long 58 shares from 23.38
IYR (Real Estate) – Long 39 shares from 65.63
USD/JPY – Short 3,000 Notional Units from 100.765
NZD/JPY – Short 3,000 Notional Units from 82.144
Looking ahead:
I was pretty active this week with three new options trades and a couple of Donchian Breakout trades getting triggered. I think the main change this week will probably be in Gold. If we see any sort of move higher, the pTheta trailing stop will be hit and the weekly trend will shift to a long state. If that happens, I’ll be looking for some May puts to sell.