Weekend Market Commentary and $IWM Butterfly – 11/14/2014
Big Picture:
Well, winter finally showed up in Sun Valley this week. I was away from home all week for work and was greeted with new snow when I got in late Friday night. I guess these things happen. As far as markets go, most of my focus in the past week was on the $IWM Butterfly. Early in the week I adjusted the position to give myself more room on the upside and within a day or two the upside was being threatened again. At the end of the week $IWM broke down below 117 to end the week essentially unchanged and the position is looking good for now.
Gold made a big move higher on Friday that brought it right up to the declining 20 day moving average. That being said, the market is very clearly in a down trend and not something I would buy.
Implied Volatility:
Implied volatility was essentially unchanged this week along with the equity markets.
The Weekly Stats:
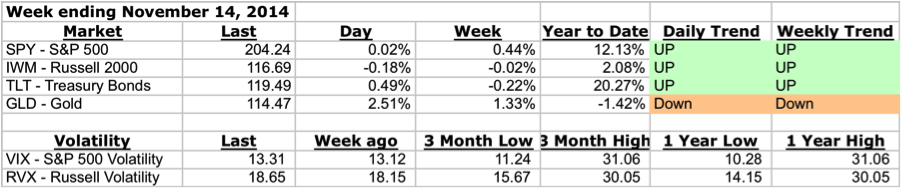
A note about trend . . . Trend on the daily timeframe is defined using Donchian channels and an Average True Range Trailing Stop. There are three trend states on the Daily timeframe: up, neutral, and down. On the weekly timeframe, I’m looking at Parabolic SAR to define trend and there are two trend states, up and down. In reality, there are always periods of chop and I’m using the indicator to capture the general bias of both the trend and those periods of chop.
$IWM December 2014 Put Butterfly Update:
The $IWM December Butterfly is still open and starting to look a little better after the sell-off on Thursday. Earlier in the week I made an upside adjustment to the Butterfly because $IWM was hovering around my adjustment point. That adjustment is explained in a video that you can watch here. After making that adjustment, $IWM pushed higher and was briefly hanging out around my next adjustment point (around 118.30). Fortunately, that level didn’t hold and $IWM fell back below 117 on Thursday. The speed of the moves has made this a challenging expiration cycle.
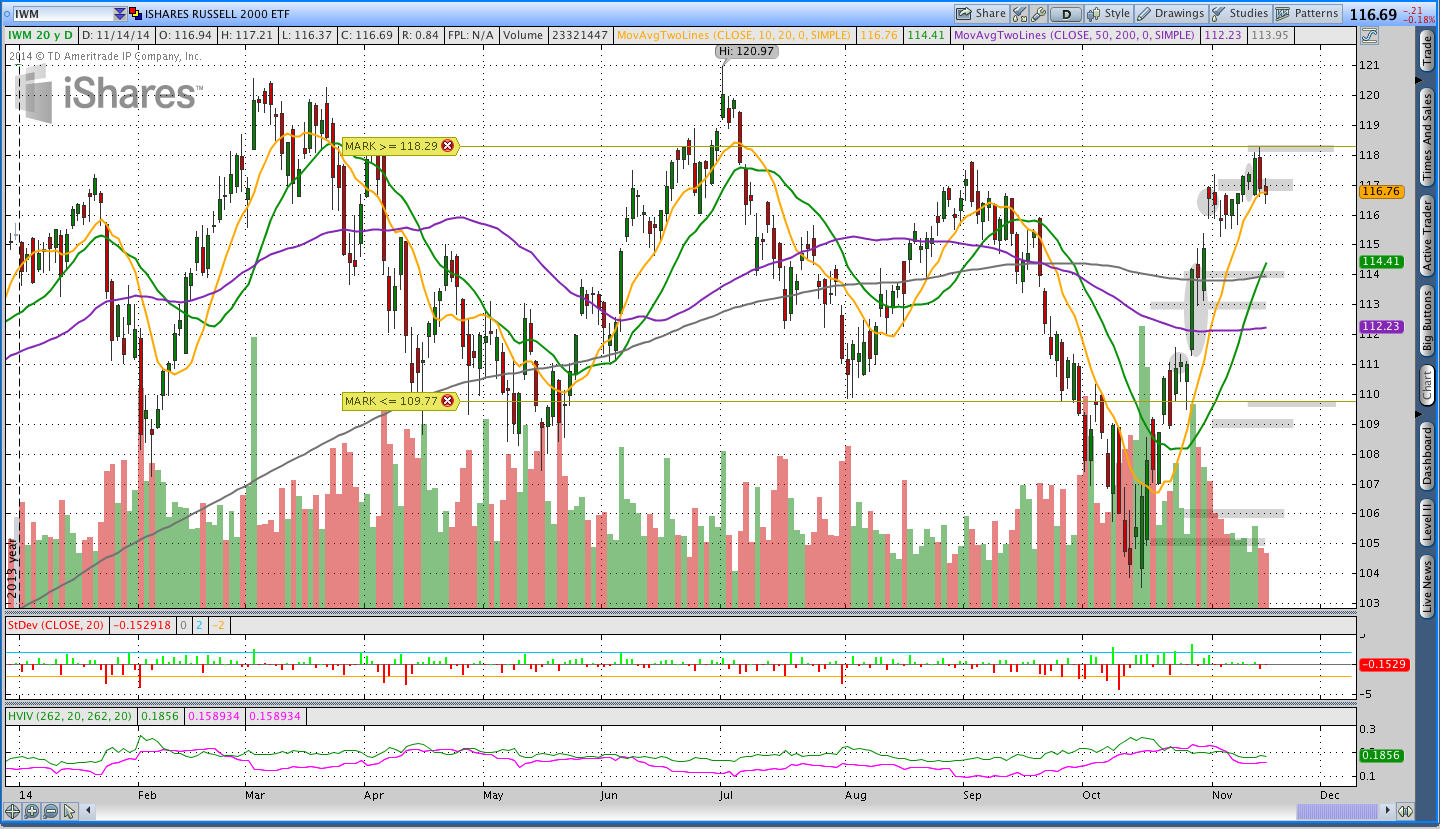
The price chart below shows the progression of the trade. The shaded ovals represent days where I made an adjustment and the shaded rectangles are the expiration break even points. The trade started with expiration break evens around 105 and 113. Those have been moved, moved, and moved some more to the current expiration break evens around 109.75 and 118.30.
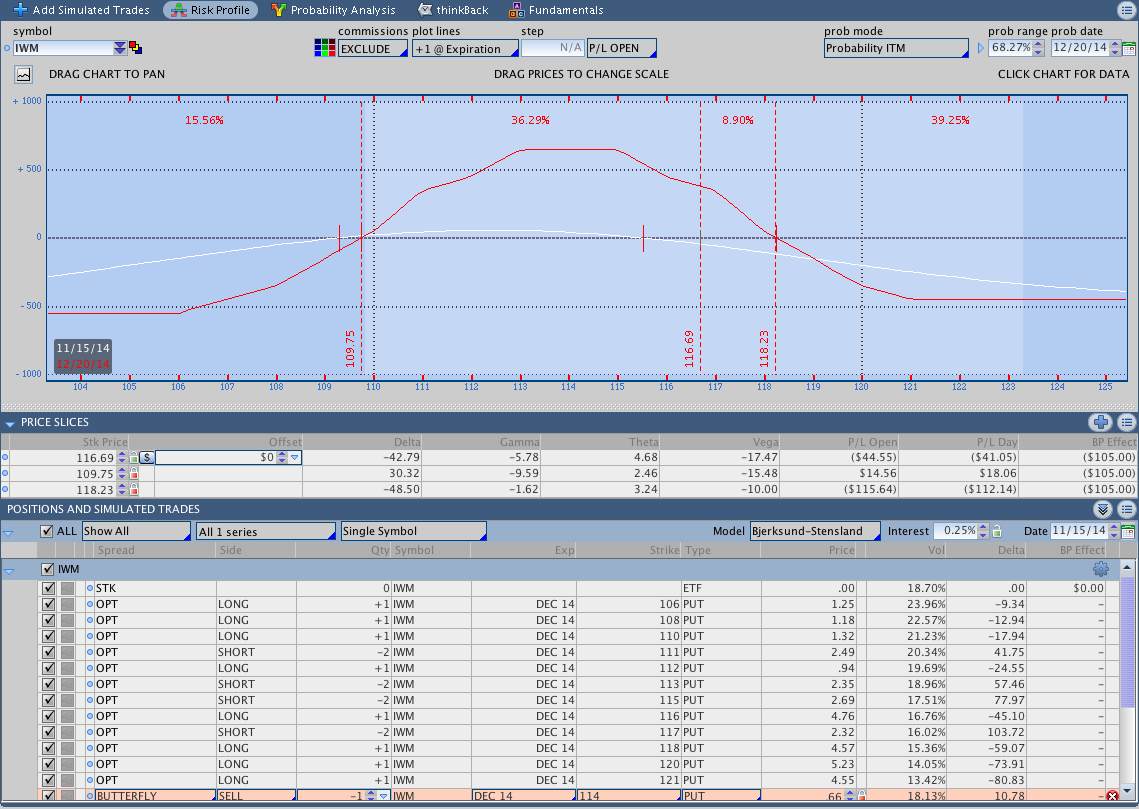
Here’s an image of the current position (including all adjustments):
The image below shows the current position. Earlier this week I added to the position yet again to adjust the upside. I added an unbalanced 112/117/121 Put Butterfly. The purpose of the adjustment was to push out the upside expiration break even. I used an unbalanced butterfly because it allowed me to do that while taking less risk on the upside. I considered selling out the lowest butterfly in the position, the 106/111/116 and decided against it. Selling out that Butterfly would have moved the expiration break even points up even more, but I would have lost a good amount of room on the downside.
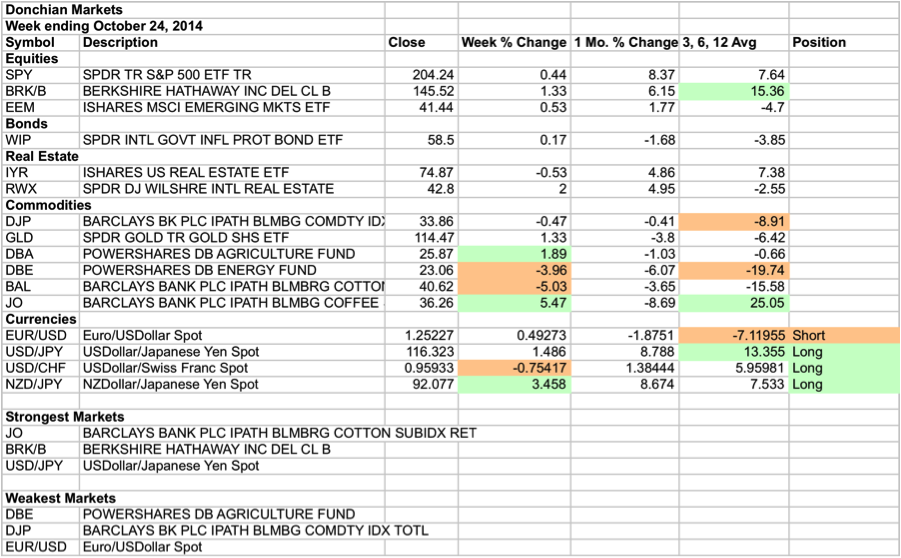
Breakout System Market Stats:
The stats for the breakout system are below. The new job is making it challenging to initiate new positions in anything other than Forex and I’ve missed a couple of trades recently. My guess is that I’m going to be making some changes to the Trend Following part of my trading. More details to come in the next month or so.
Trades This Week:
IWM – Dec 2014 112/117/121 Put Butterfly (bought for .85)
NZD/JPY – Bought to open 2,000 notional units at 89.036
Option Inventory:
IWM – Dec 2014 106/111/116 Put Butterfly (bought for 1.03)
IWM – Dec 2014 104/113/114 Put Butterfly (bought for 1.05)
IWM – Dec 2014 109/115/119 Put Butterfly (bought for 1.17)
IWM – Dec 2014 112/117/121 Put Butterfly (bought for .85)
ETF & Forex Inventory:
EUR/USD – Short 5,000 notional units from 1.35028
USD/CHF – Long 6,000 notional units from .9037
USD/JPY – Long 2,000 notional units from 110.084
NZD/JPY – Long 2,000 notional units from 89.036
Looking ahead:
I’m hoping that the IWM Butterfly is finally under control, meaning I hope IWM is going to stop pushing higher. I’m going to be looking for another Put Butterfly for the January expiration cycle. I’ve found that I like to enter new butterfly positions with 50-55 days to expiration, however, that would be during the Thanksgiving holiday week and I’d rather have something established in before that. As a result, I might take a new position a few days early, which would be around mid week.
I still need to get a information out about the rotation system. I’m currently backtesting a simple version of the system in excel and hope to have something soon. If you have any questions, feel free to post them in the comments below. Thanks for reading and have a good weekend.
If you enjoyed this post, please click above to like it on Facebook or Tweet it out. As always, thanks for reading and enjoy the rest of your weekend.
Want to receive an alert as soon as the next market commentary is posted?

Sign up for my email list and stay up to date with the latest information on options trading and trend following.
Click here to sign up for the list, get a copy of the Theta Trend Options Trading System, the Trade Tacker I use, and information about new systems.
Even better . . . it’s all totally free.