Weekend Market Commentary 9/4/15 – $RUT, $RVX, $SPX, $VIX, $VXV
Big Picture:
Context is everything. This week the markets fell a few percent, but it didn’t seem like that big of a deal. Following the big tumble lower two weeks ago, being off a measly 2-3% isn’t that significant. The Russell 2000 ($RUT) continues to hold up better than the S&P 500 ($SPX), but there’s nothing bullish about equities right now. Let that sink in . . . there is nothing bullish about equities right now.
I’m not a fundamental, follow the news type of trader, but the media is definitely painting a bleak picture. I guess that’s their job. To create, package, and sell fear to the unsuspecting people who believe that someone with a Journalism degree from an Ivy League school actually knows something about “why” the markets are moving. Garbage.
Normally I glance at the news for a little entertainment and go about my dark, cynical ways, but the market is broken right now and I have concerns about a bigger move lower. That being said, don’t get carried away thinking I believe their story about the market decline.
In trading, why matters much, much less than what is happening, what will happen, and most importantly, WHEN. From a technical perspective, the markets are below all of the major moving averages, interest rates are essentially zero, markets around the world are falling, and volatility is confirming the moves.
I have absolutely no idea why things are bad right now, but the markets aren’t happy. Globally, we’ve grown accustomed to government stepping in when things aren’t going well. That doesn’t mean that it will always happen or, even worse, that it will always be effective.
Market Stats:
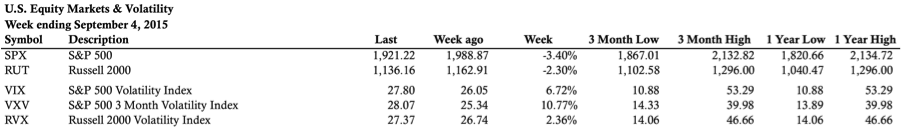
Levels of Interest:
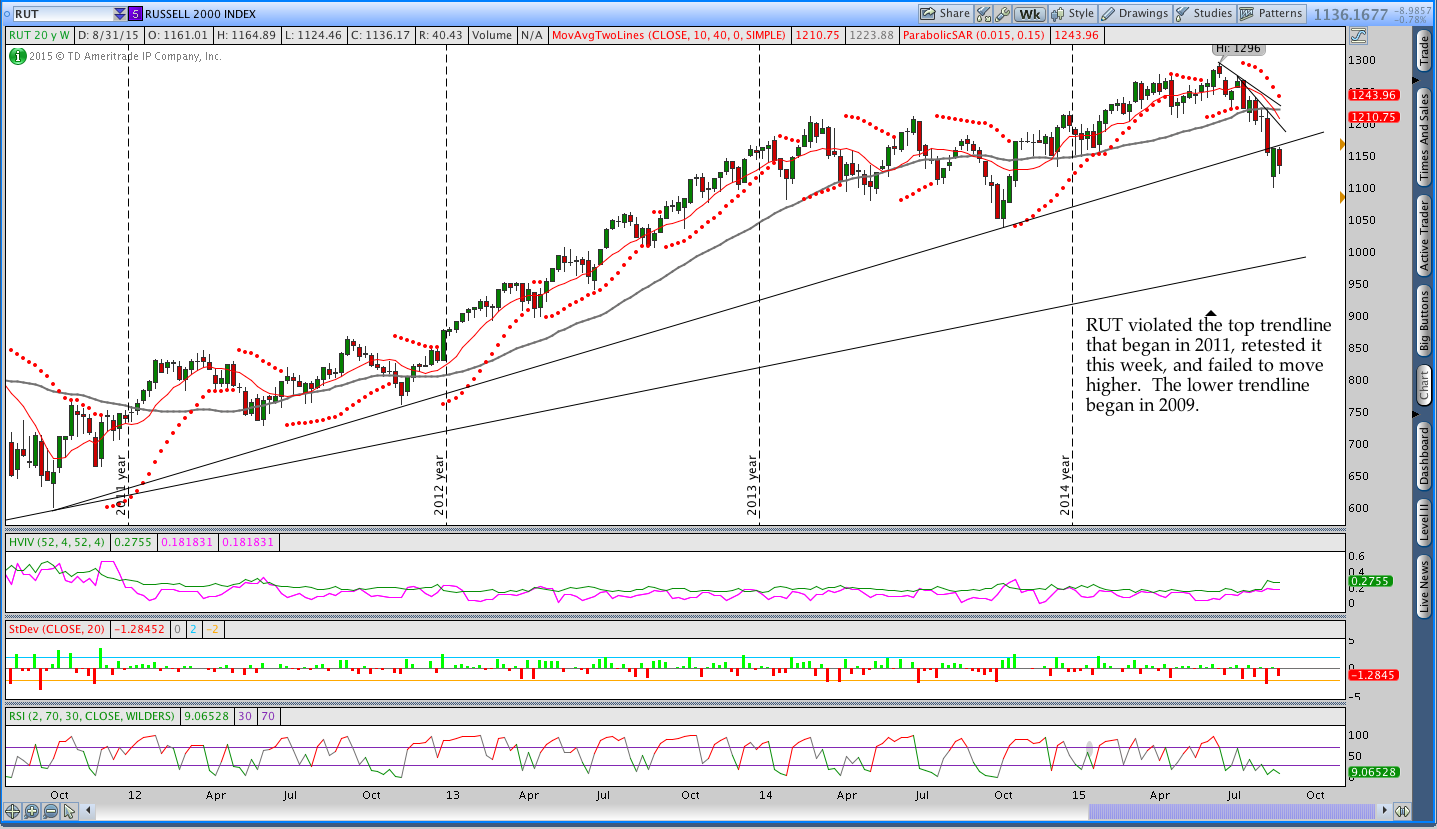
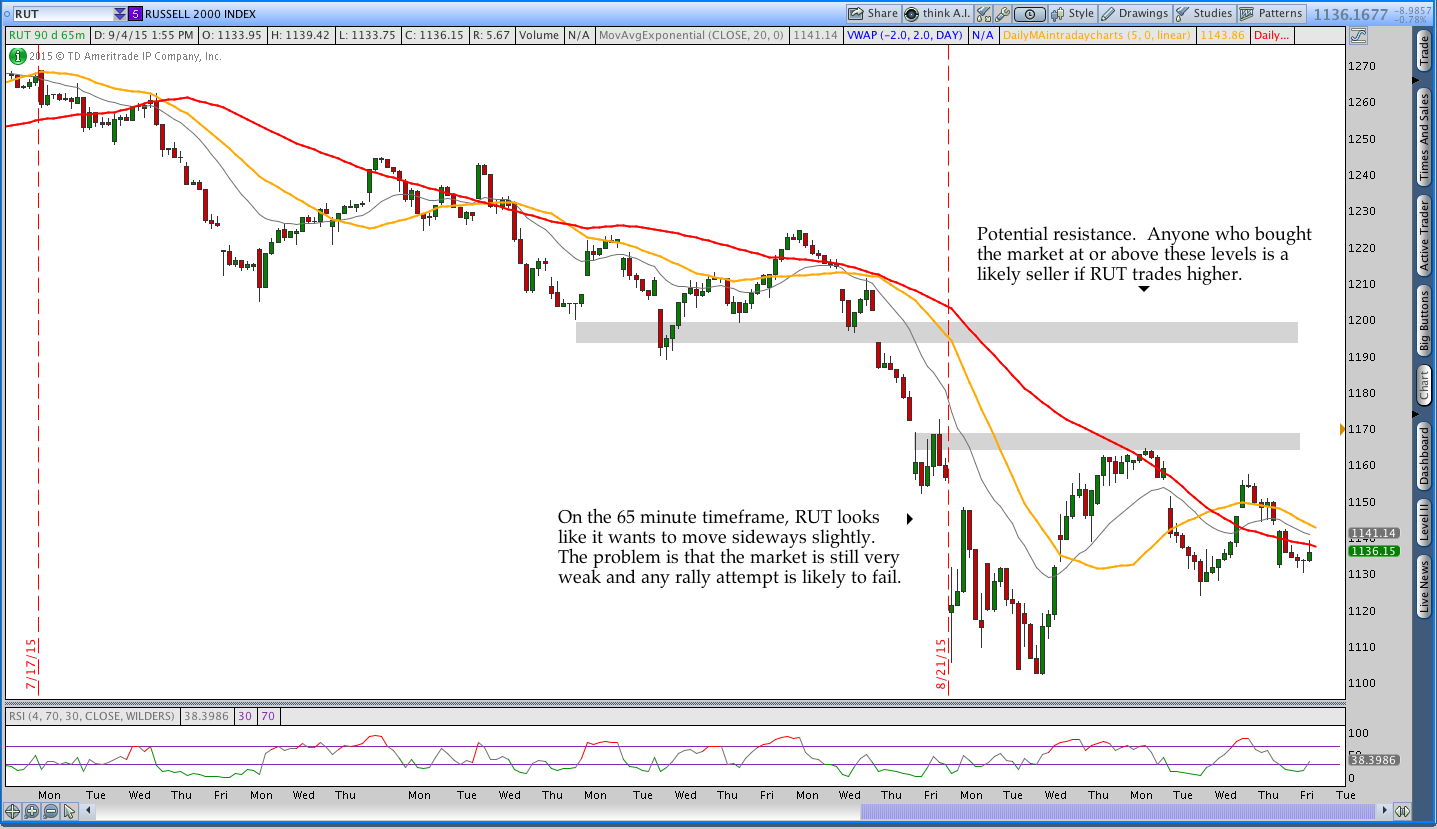
In the levels of interest section, we’re drilling down through some timeframes to see what’s happening in the markets. The analysis begins on a weekly chart, moves to a daily chart, and finishes with the intraday, 65 minute chart of the Russell 2000 ($RUT). Multiple timeframes from a high level create context for what’s happening in the market.
Volatility:
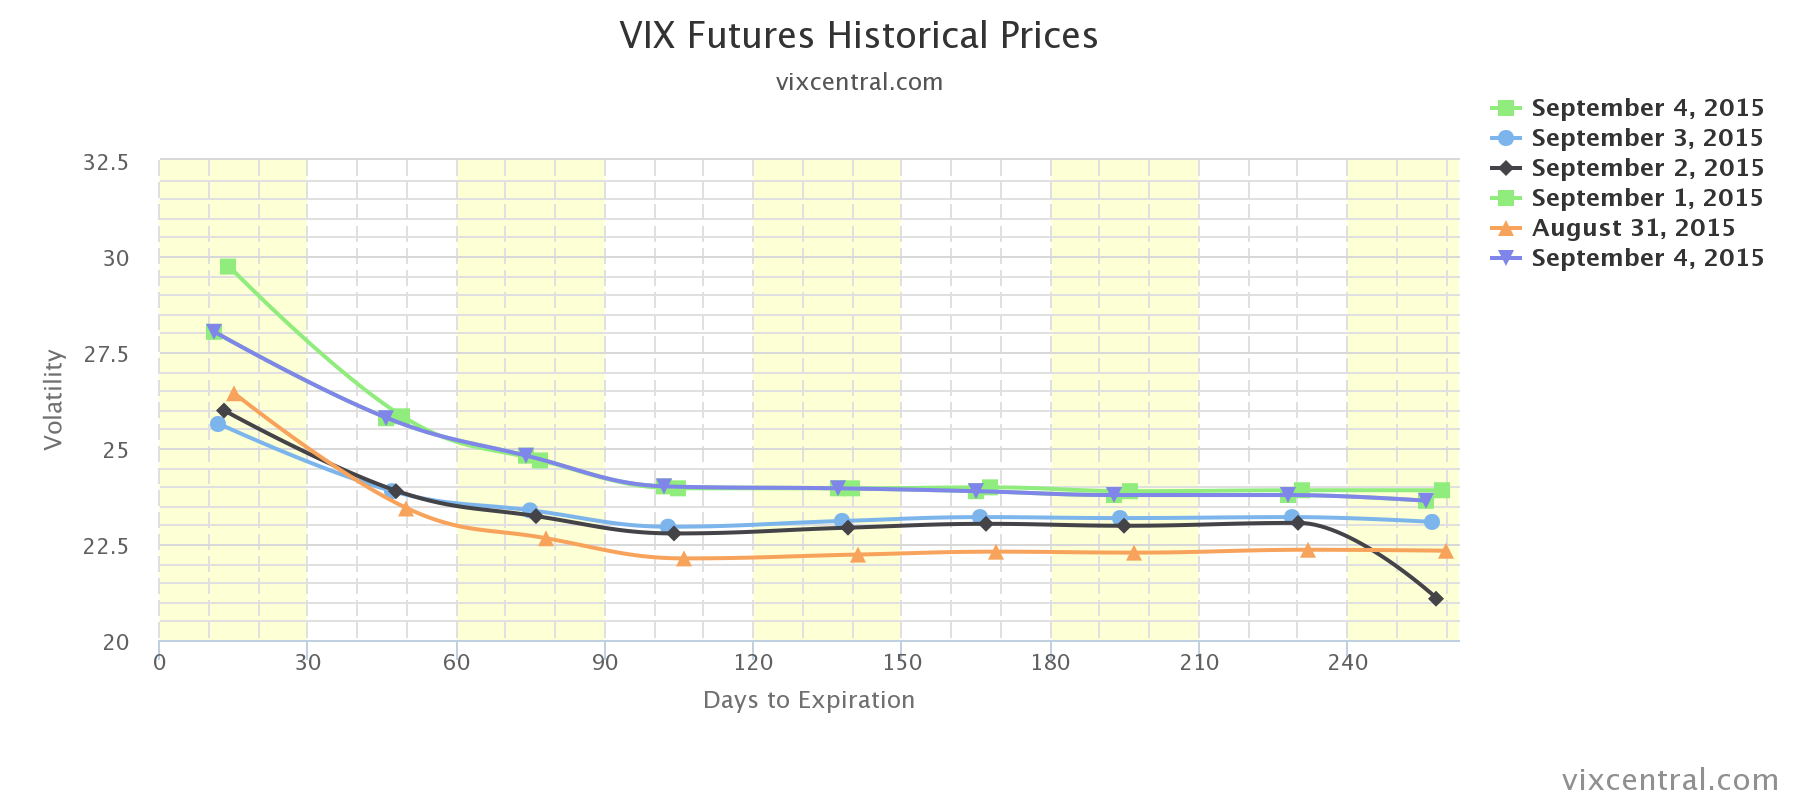
There is a data issue in TOS with the September futures contract so the term structure image today is from VIX Central. For some reason, the TOS data misnamed the September contract date as Sep 2025 rather than 2015, but it’s only happening on a couple of days.
In a calm market, the front month VIX Futures contract generally trades at a lower price than the subsequent months (Contango). Nothing changed significantly this week and the term structure is still in Backwardation. In order for me to feel remotely bullish, the curve needs to flatten, shift down, and return to Contango.
I saw someone post on a forum about purchasing XIV because they think volatility will go down. That’s a bad idea. If you’re sitting around thinking about how cheap XIV has gotten, please don’t buy it. It can get cheaper.
XIV benefits both from a decrease in volatility and Contango. Since the product is short volatility, it naturally benefits when the front month trades at a discount to the back month. Intuitively, it’s shorting a higher priced contract further out in time that slides down the curve as it approaches expiration. That doesn’t happen when the term structure is in Backwardation. It’s entirely possible that we’re entering a period where the term structure will remain in Backwardation with heightened volatility.
Live Trades . . .
The “Live Trades” section of the commentary focuses on actual trades that are in the Theta Trend account. The positions are provided for educational purposes only.
This was a relatively quiet trading week. I opened an Iron Condor in SPX early in the week, but the October 2015 Butterfly went untouched all week (finally). I also have a short put spread in RUT and another short call spread in SPX. The RUT position is from a roll lower two weeks ago and the call spread is left over from a broken Iron Condor position.
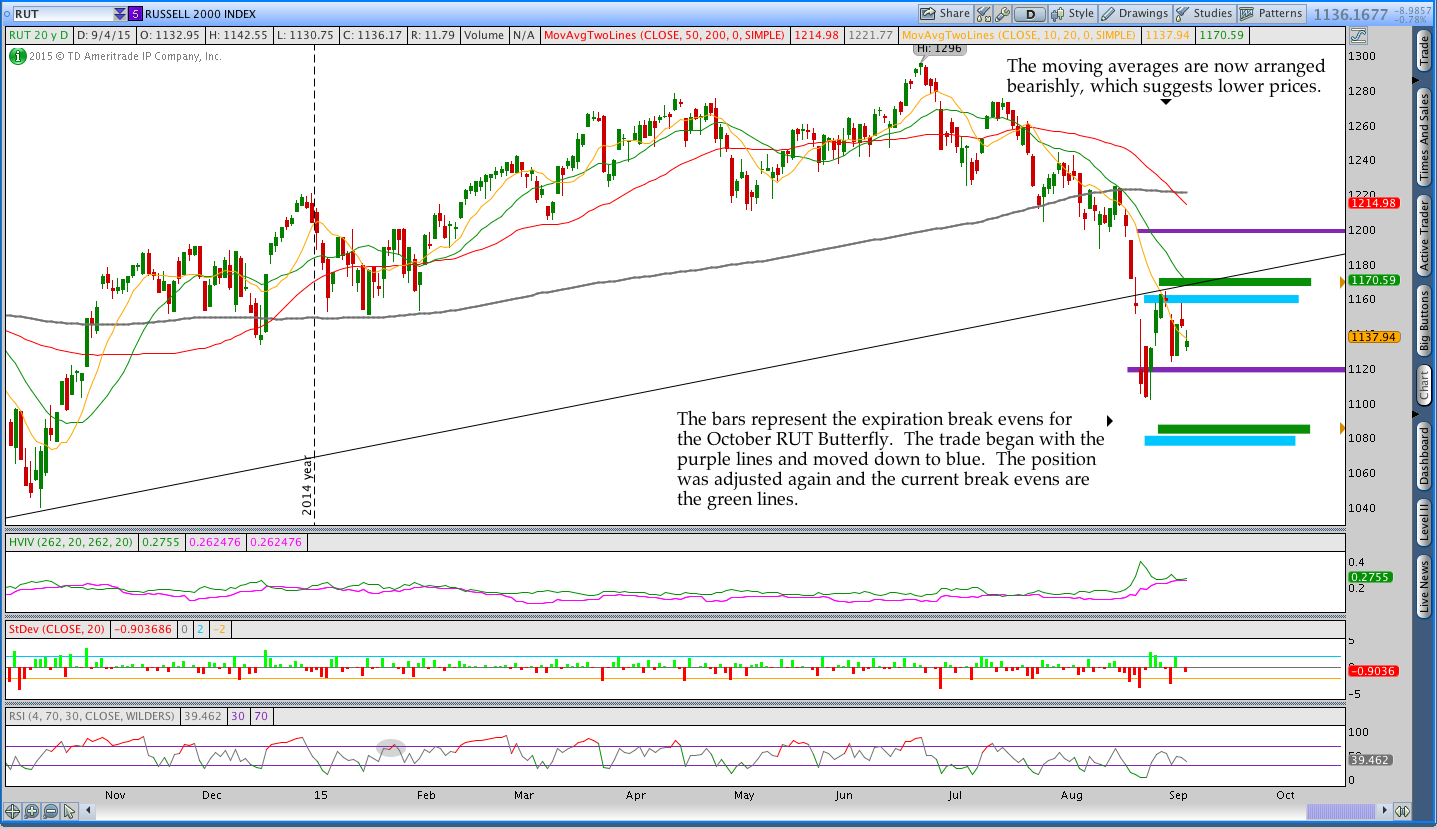
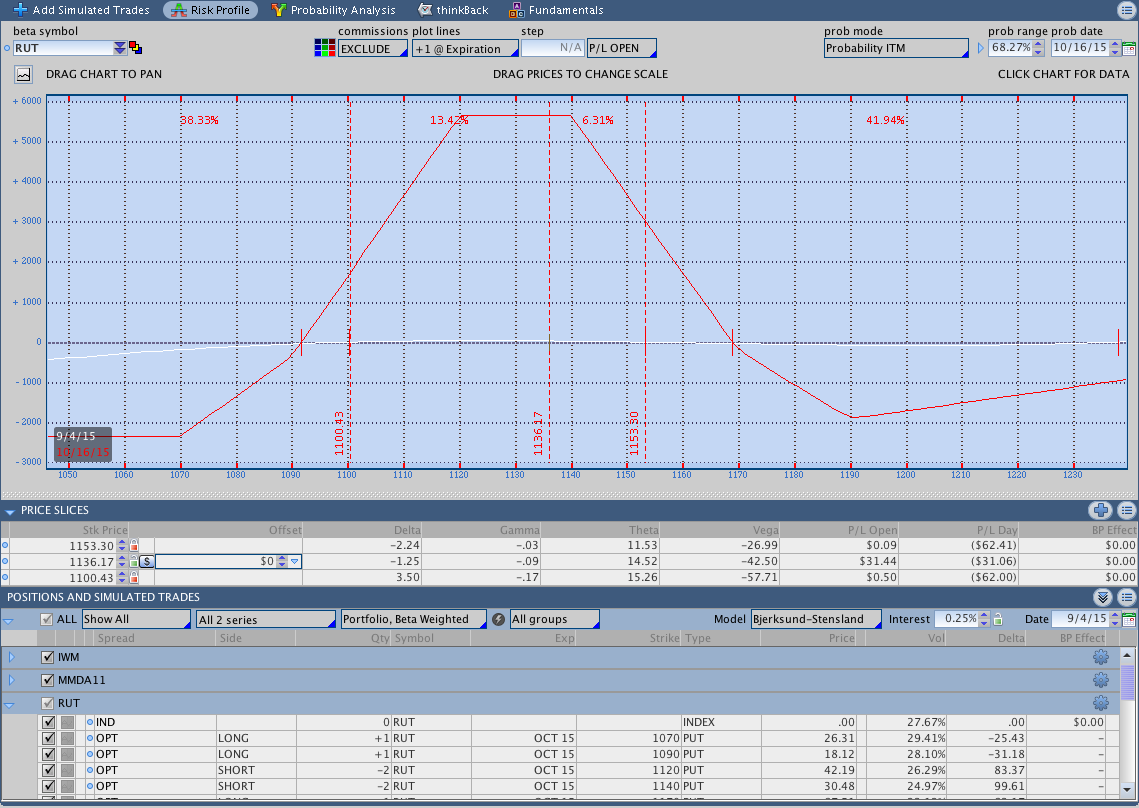
$RUT October 2015 Butterfly:
The Butterfly is still open and coming into the money a little bit. We’re inside of 40 days to expiration now and the position should start to get interesting. RUT was kind this week and backed off into the body of the Butterfly. The T+Zero line looks great so there isn’t anything to do other than wait.
Note that the image below includes all adjustments for the October cycle. Despite some crazy moves in the market, the trade is totally healthy right now. Trading Butterflies requires more management than an Iron Condor, but the trades are much more resilient when things get ugly.
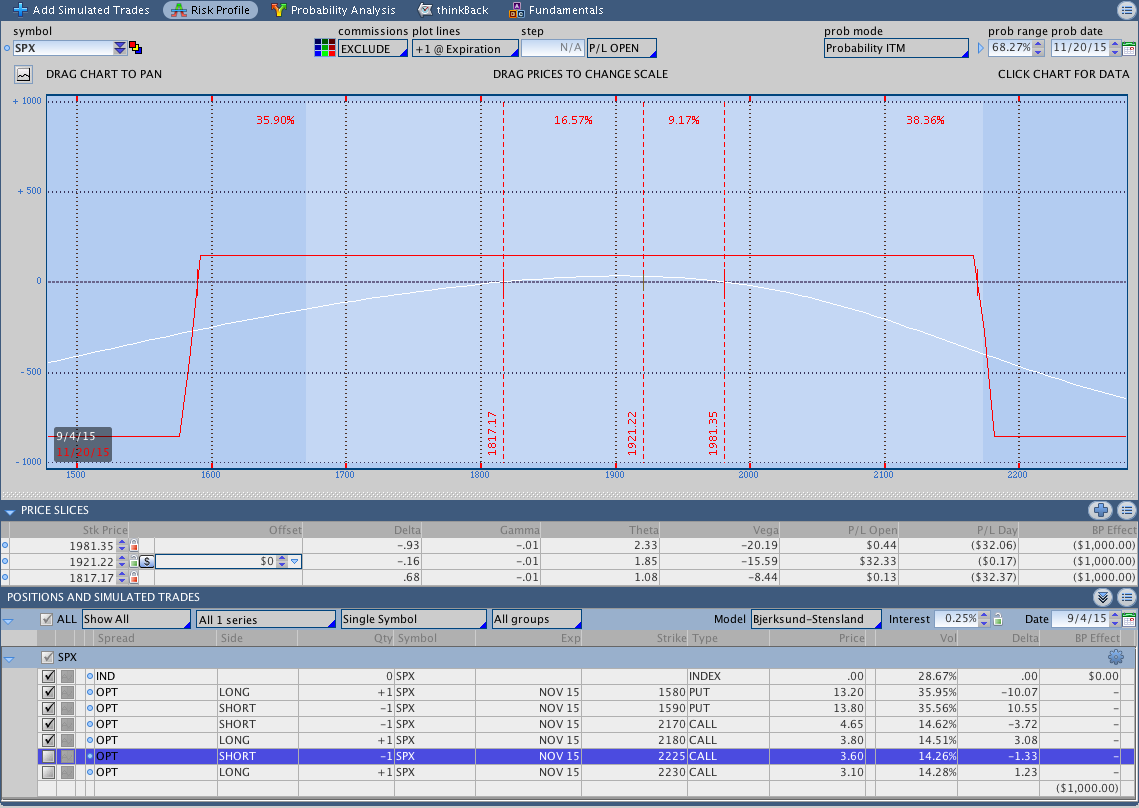
$SPX November 2015 Iron Condor:
Earlier this week I sold another November Iron Condor. Volatility has come in slightly since the position was opened and the trade is in good shape. Even if I expire this trade, I’ll still be down money on Iron Condors this month. Such is the way it goes when the market moves fast and you’re short out of the money vertical spreads.
Looking ahead, etc.:
As traders, we need to be aware of the potential risk in the market and remain cautious. This was an easy week from a trading standpoint, but that can certainly change quickly. Despite good sized moves in both directions, there wasn’t much follow through and that’s great for premium sellers.
I normally don’t issue directional opinions on the market, but I’m bearish right now and think we’re going lower. Will that happen next week, the week after that, or in the next month? I have no idea. What I do believe is that, until we see some structural changes in the market, most rallies will resolve themselves to the downside.
Please share this post if you enjoyed it.
Click here to follow me on Twitter.
Want to receive an alert as soon as the next market commentary is posted?

Sign up for my email list and stay up to date with the latest information on options trading.
Click here to sign up for the list, get a copy of the Theta Trend Options Trading System, the Trade Tacker I use, and information about new systems.
Even better . . . it’s all totally free.