Weekend Trend Following Market Commentary 7/11/2014
Big Picture:
Where are the daytime sellers? This week we saw some downside movement in the S&P 500, an uptick in implied volatility, and the Russell 2000 was hit hard to close down almost 4% on the week. All that being said, it’s interesting that a good portion of the selling took place overnight. The S&P 500 gapped lower Thursday morning, but found new buyers and drifted higher throughout the day. It seems like the market is sending us a message to be aware of the downside and, at the same time, we need to remember that the longer term trend is still bullish.
Implied Volatility:
Implied volatility had a nice pop this week to bring the VIX back above 12. As you might expect, the real mover was the RVX, which closed well above 18.
The Weekly Stats:
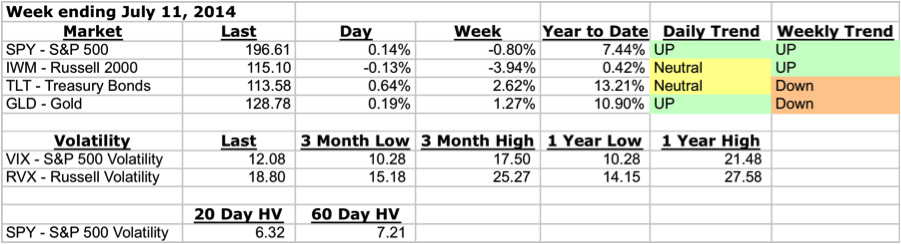 A note about trend . . . Trend on the daily timeframe is defined using Donchian channels and an Average True Range Trailing Stop. There are three trend states on the Daily timeframe: up, neutral, and down. On the weekly timeframe, I’m looking at Parabolic SAR to define trend and there are two trend states, up and down. In reality, there are always periods of chop and I’m using the indicator to capture the general bias of both the trend and those periods of chop.
Stocks ($SPY and $SPX – S&P 500):
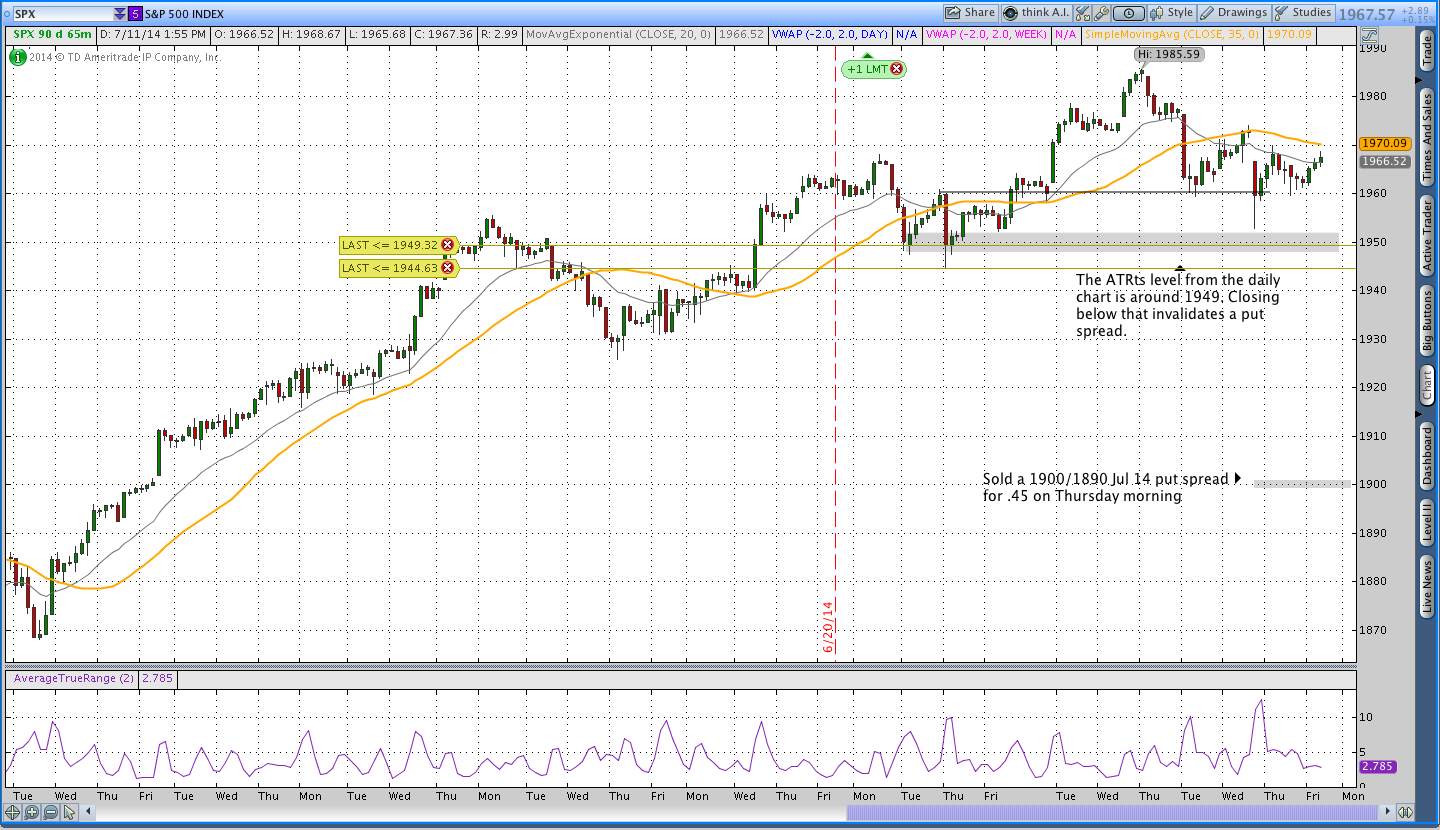
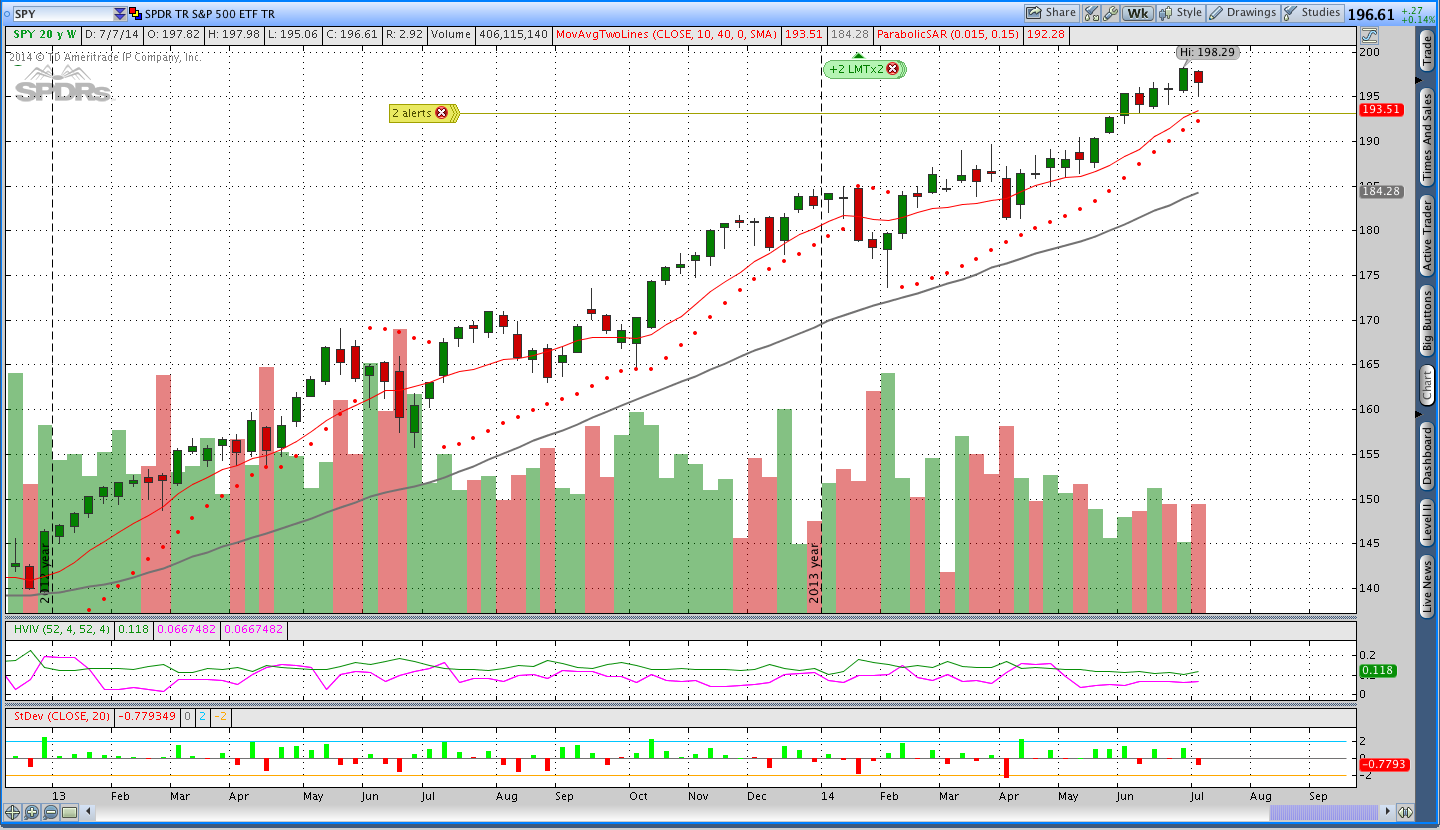
As noted above, the S&P 500 finished down on the week, but was much lower on Thursday morning. At this point, the buyers seem to have pushed the market back into more neutral territory and we’ll need to see who takes control next week. In the intraday chart below, I’m keeping an eye on the 1960 level. A break below 1960 (and definitely below 1950) will be short term bearish for the market.
I’m still sitting in the Weekly Theta trade I took Thursday morning with a short strike down at 1900. As long as we don’t have a significant gap on Monday, I should be able to close the trade for my target profit. On an end of day basis the Weekly Theta system has been easy to trade, but on an intraday basis there are some swings in the open profit/loss.
For anyone who doesn’t know, I started a regular weekly video post to cover the Weekly Theta options trades. Once I get filled on a weekly options trade, I’m both Tweeting it out and updating the post.
Donchian Channel System Market Stats:
Ok, we’re going to start looking at the Donchian channel markets on a more regular basis. The Breakout System has always been the foundation of my trading and it’s time to pay a little more attention to the system.
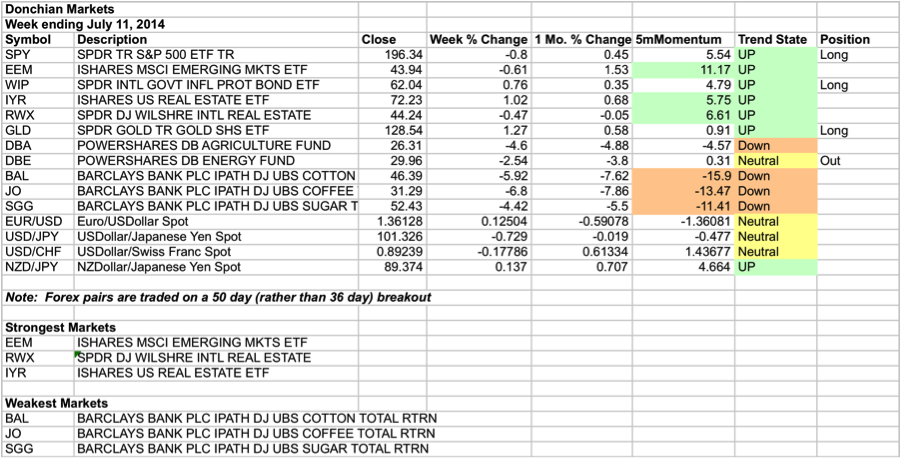
In the stats above, we’re looking at the markets I trade. I like to look at the percentage change over various periods of time to get a sense for how markets are performing, but at this time the momentum and percentage change amounts are not being used for trading purposes.
What we saw in the past week is a continued weakening in commodity markets, a neutral dollar, and continued strength in real estate. Earlier this year I did not take the long trades in IYR and RWX because the model account was fully margined. The necessity of missing those trades has been a painful and somewhat expensive lesson as those markets have had great trends that continue to roll.
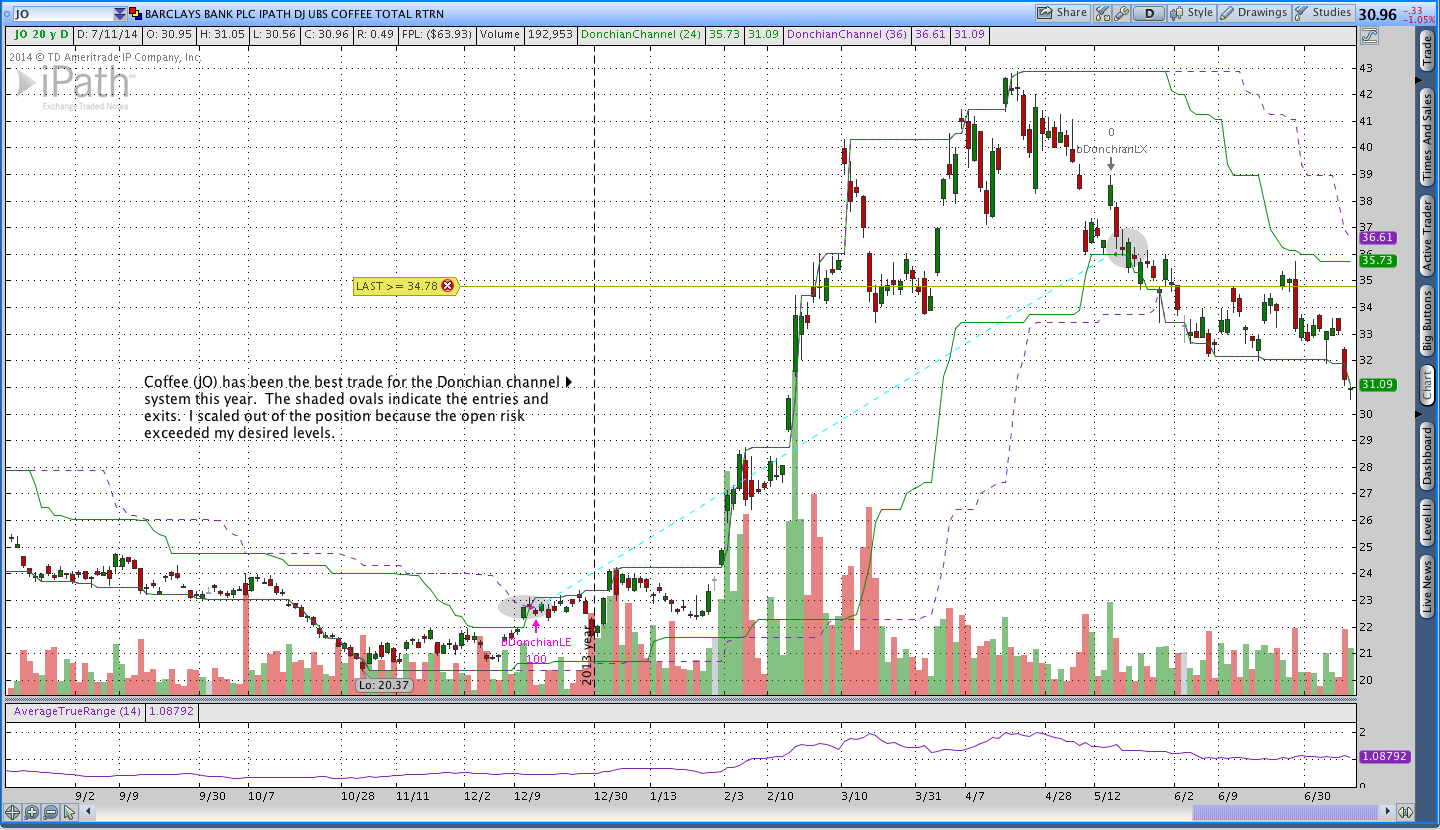
Interestingly, the biggest winning trade for the Donchian Channel system this year is in Coffee. Following the big up move, coffee broke and has been heading lower. The system took me out of the trade at a great time and I’ve just been watching the market head lower.
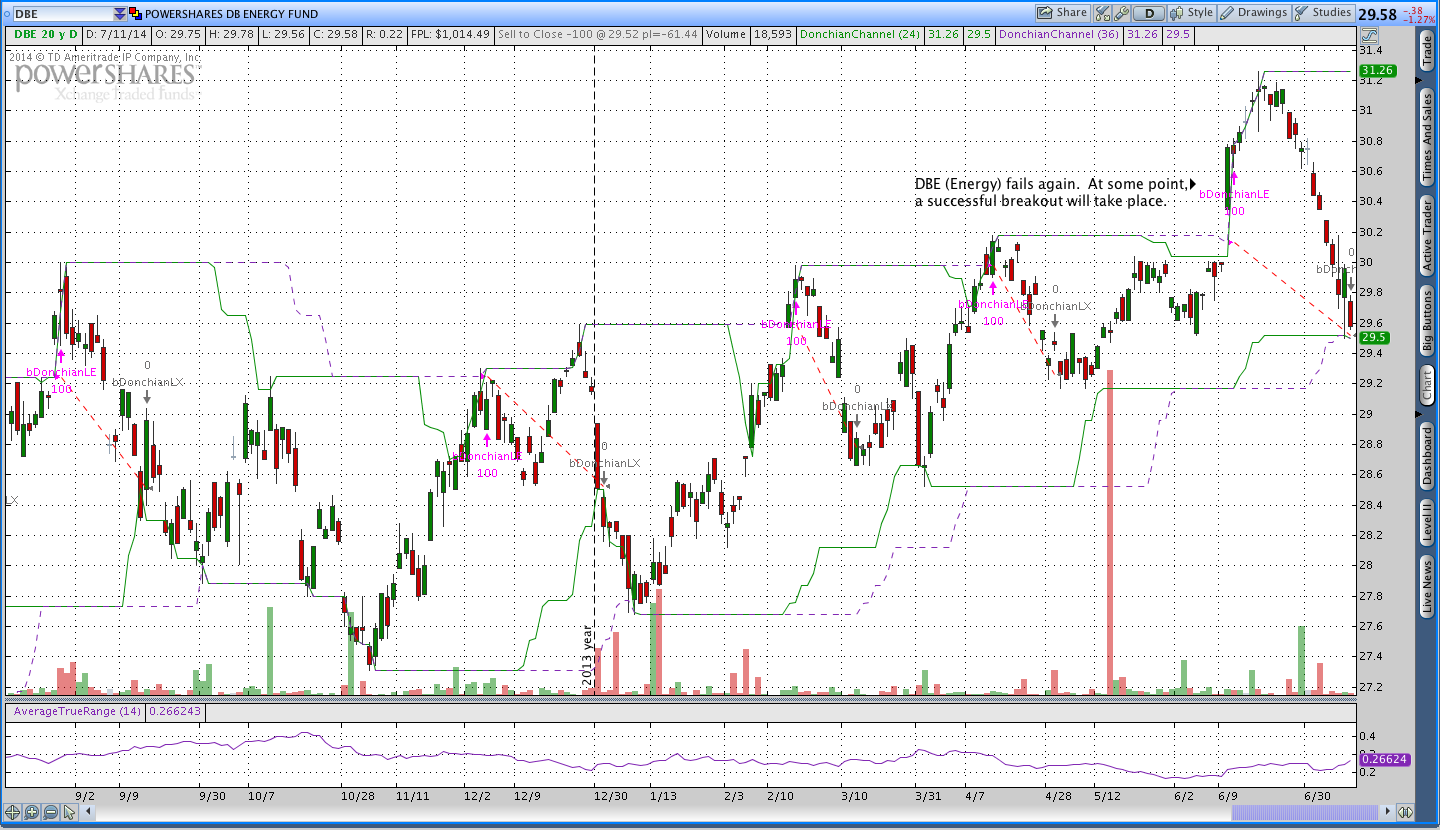
I was taken out of my long DBE (Energy) trade this week as Oil broke down and the recent breakout failed. These things happen. I also used some of my free margin to take an outright position in Gold (GLD).
Trades This Week:
SPX – Sold to open 1900/1890 Jul 14 Put Vertical at .45
SPX – Bought to close 1930/1920 Jul2 14 Put Vertical for .15
SPY – Sold to open 178 Sep 14 Put for .65
GLD – Bought to open 33 shares at 126.48
DBE – Sold to close 111 shares at 29.66
Option Inventory:
SPY – Short Aug 2014 173 Put (sold for .60)
SPY – Short Sep 2014 178 Put (sold for .65)
SPX – 1900/1890 Jul 2014 Put Vertical (sold for .45)
ETF & Forex Inventory:
SPY – Long 12 shares from 188.58
WIP – Long 100 shares from 61.66
GLD – Long 33 shares from 126.48
NZD/JPY – Long 5,000 notional units from 89.289
Looking ahead:
This week I’ll be keeping a close eye on the 1960 level in the S&P and getting ready for another Weekly Theta trade. It doesn’t seem likely that there will be any new Donchian channel trades, but it’s always possible. As a reminder, I’m posting a video every Wednesday night or Thursday morning to go over the levels for the Weekly Theta trades.
If you enjoyed this post, please click above to like it on Facebook or Tweet it out. As always, thanks for reading and enjoy the rest of your weekend.
Want to receive an alert as soon as the next market commentary is posted?

Sign up for my email list and stay up to date with the latest information on options trading and trend following.
Click here to sign up for the list, get a copy of the Theta Trend Options Trading System, the Trade Tacker I use, and information about new systems.
Even better . . . it’s all totally free.