Weekend Market Commentary 3/7/14 – Stocks, Bonds, Gold ($SPY, $IWM, $TLT, $GLD)
Big Picture:
 It appears as though people still want to buy stocks. Early this week it was starting to look like we might get a little correction in the equity markets, but on Tuesday that changed as stock surged higher. On Monday I sold an April $IWM put in what turned out to be a total freak accident of good timing.
All of the options trend following positions are up money and the only position that struggled a little this week was the naked put in $TLT. Bonds saw a little bit of a pullback this week and flipped the daily trend to neutral, but the longer term trend remains up.
I’m starting to get very busy at work and it’s going to remain that way for another 5 weeks or so. As a result, I don’t have as much time to devote to the blog as I’d like. Thanks for continuing to read the blog until we get through April 15th and I have some new material that I’m looking forward to rolling out in a month or so. Until then, I’ll continue to post the weekly recaps and will try to get in an occasional post or video during the week.
Side-note: For those of you who don’t already know, I’m a CPA and work as a tax accountant by day. What that means is that from now through April 15th my life becomes something of challenge. I’ll do my best to tweet out new trades, etc, but my work has really picked up and at times that might not be possible. For some reason, tax clients don’t appreciate you pausing your time with them to tweet trades. Oh well.
Implied Volatility:
Implied volatility basically yawned again this week. The $VIX is in the lower end of both it’s 3 month and 1 year range.
The Weekly Stats:
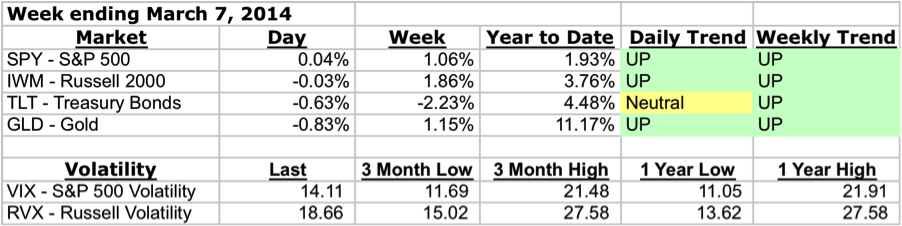
A note about trend . . . Trend on the daily timeframe is defined using Donchian channels and an Average True Range Trailing Stop. There are three trend states on the Daily timeframe: up, neutral, and down. On the weekly timeframe, I’m looking at Parabolic SAR to define trend and there are two trend states, up and down. In reality, there are always periods of chop and I’m using the indicator to capture the general bias of both the trend and those periods of chop.
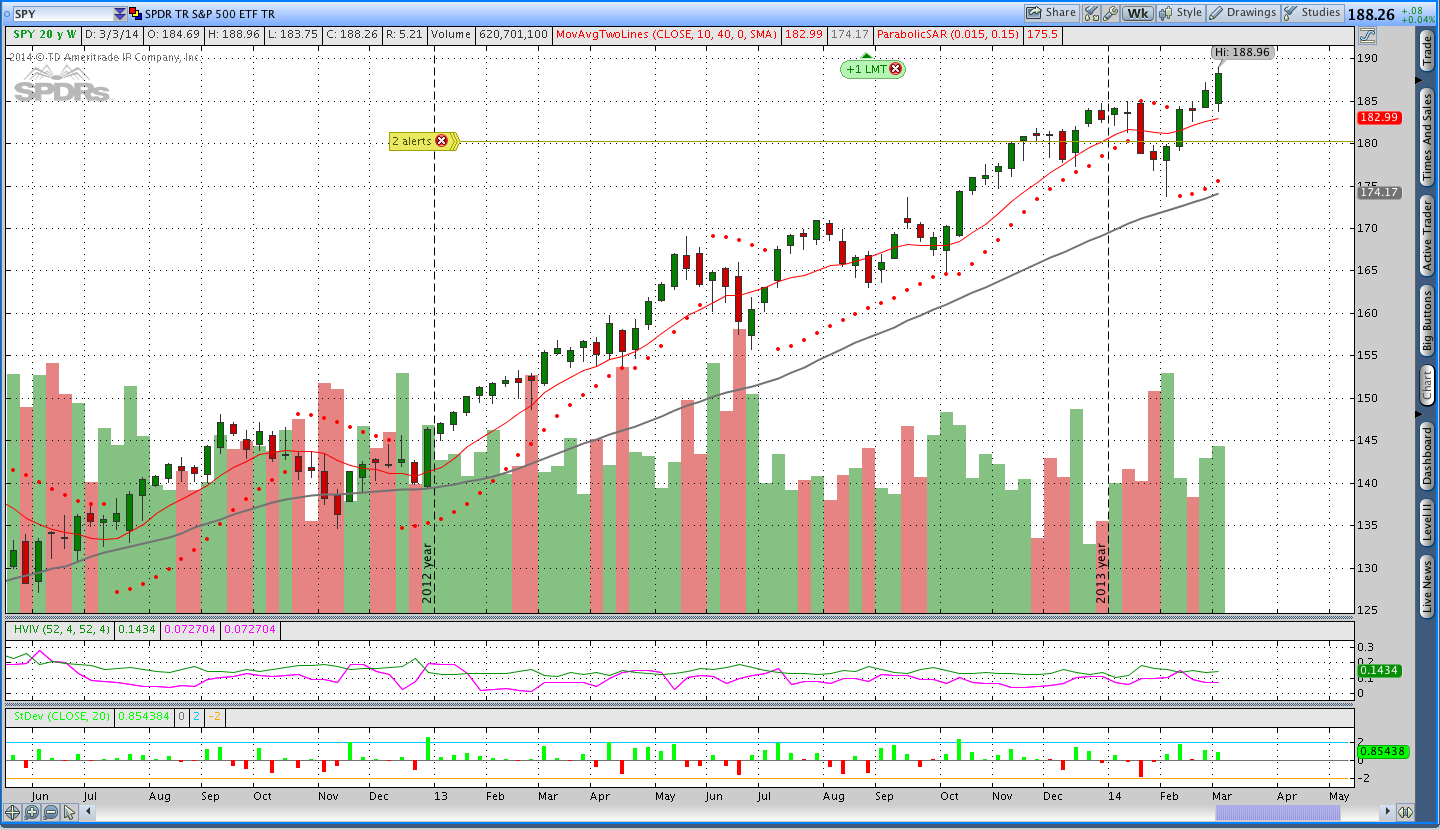
Stocks ($SPY – SPDR S&P 500):
Last week the S&P 500 turned positive on the year and this week price made a solid push higher into new highs. Right now the S&P is sitting slightly below the 2,000 level and I wouldn’t be surprised to see that price sometime soon. As prices approach even numbers and large levels it seems like there is a tendency for markets to reach those levels. The 2,000 level in the S&P is one of those levels. The real question becomes how low it will take to get there (if it gets there) and what path will it take to get there.
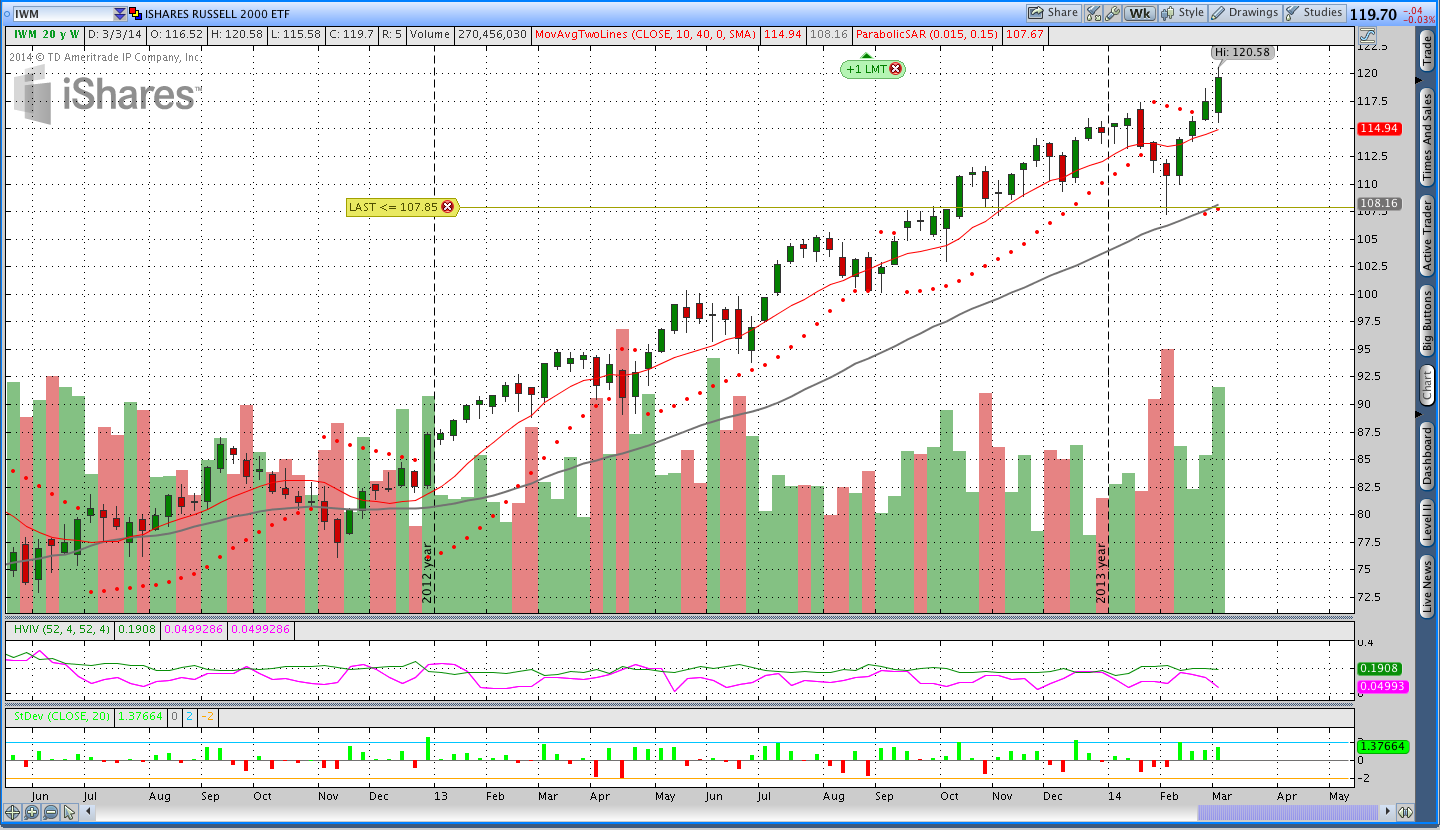
The Russell 2000 has been stronger than the S&P this year and on Monday I sold an April put. While that put sale seems like great timing, the timing was more luck than anything. I sold it because $IWM is in an uptrend and Monday was a down day. Fortunately, it’s working out better than the calls I was short last month.
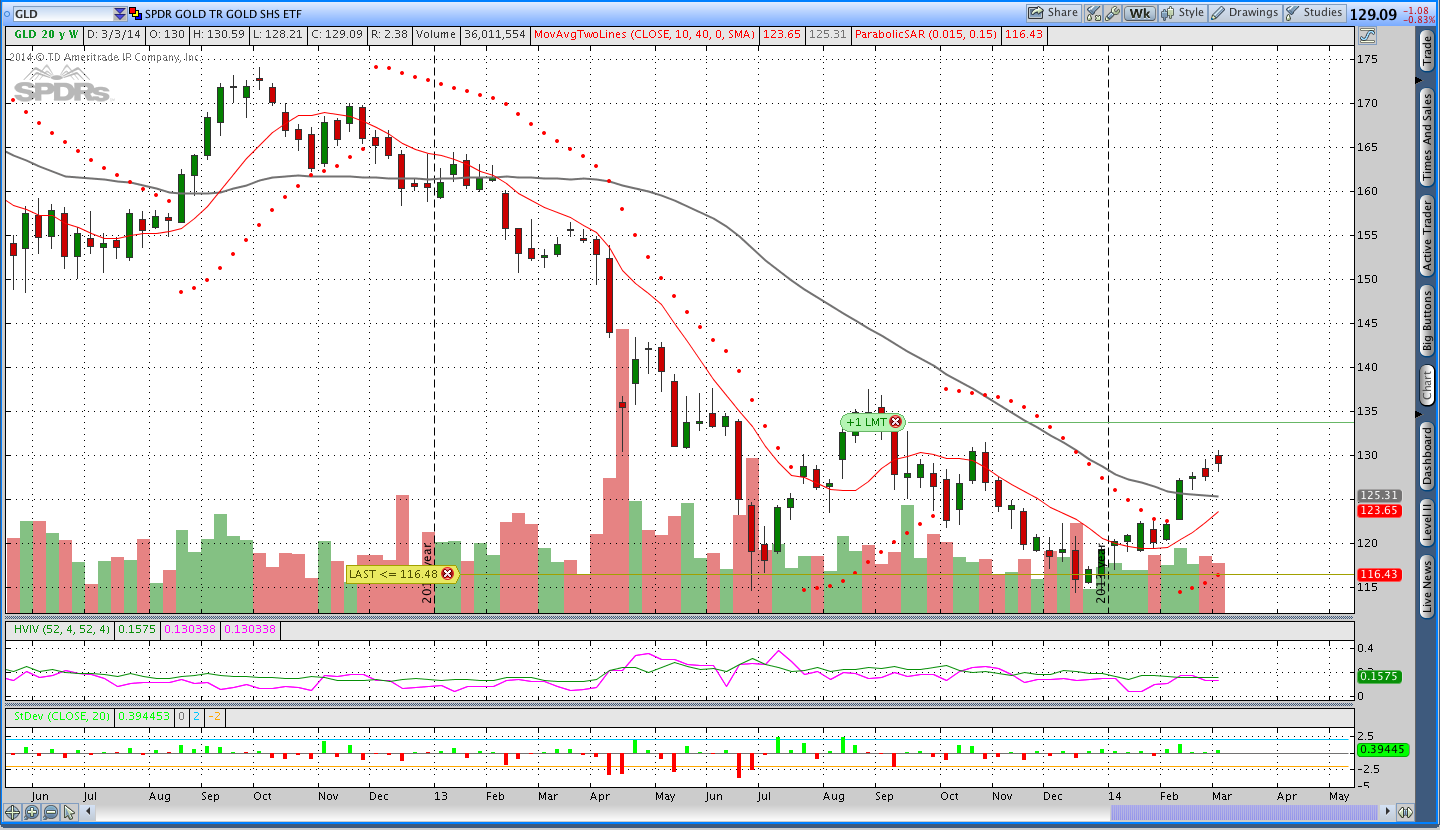
Gold ($GLD – SPDR Gold Shares ETF):
Gold continued a strange pattern of popping higher and fading over the week while still ending higher. Price is now quite a ways from the Parabolic SAR and the naked put is doing well. Gold is up over 11% on the year and the commodity and currency markets are telling us that the dollar is weakening.
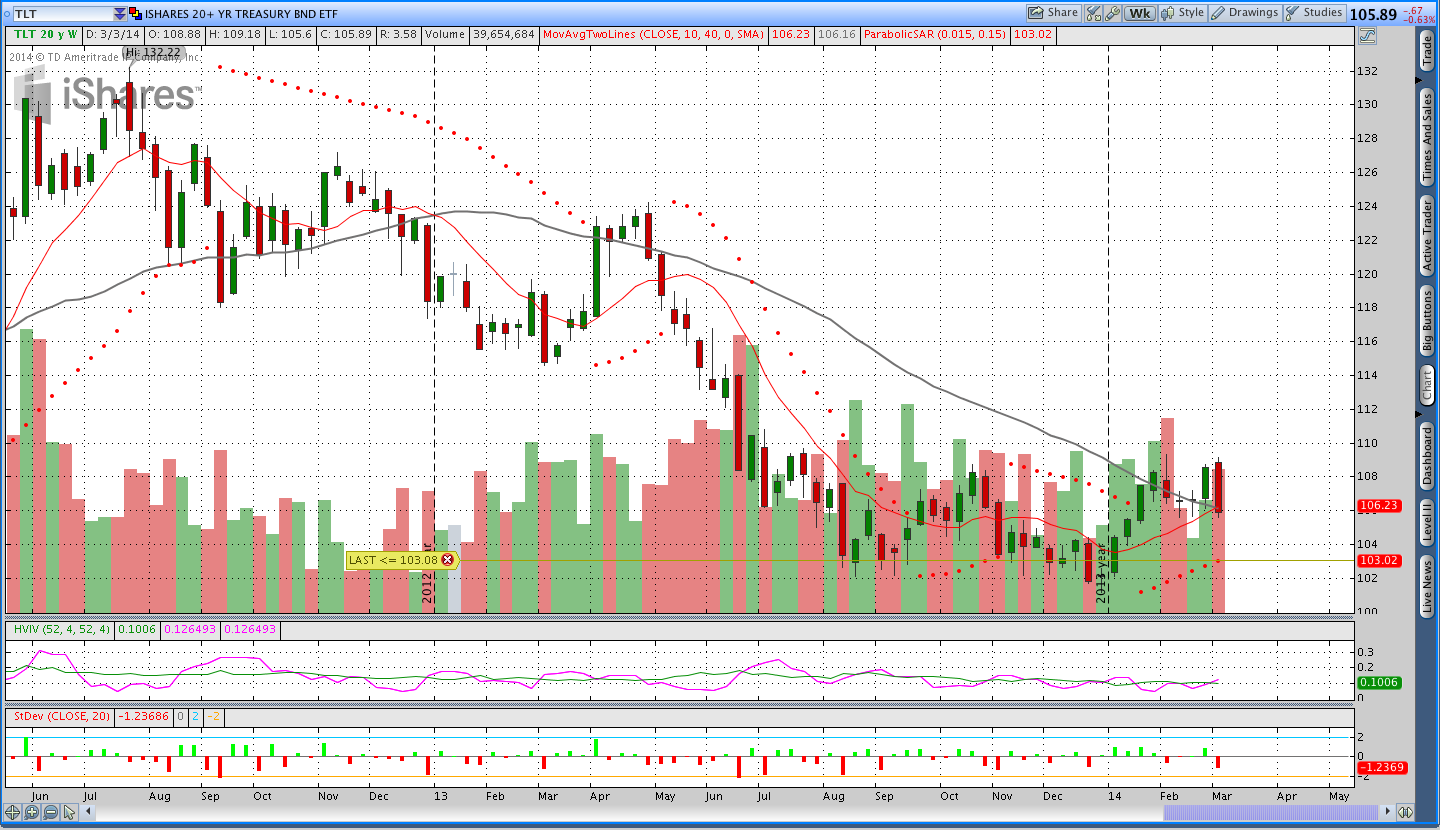
Bonds ($TLT):
After the nice run higher in bonds last week, the market turned around and took back those gains. Oh well. The short $TLT put is still doing well despite the reversal because time has begun to take it’s toll on the option. I tried to roll the position to June this week, but I wasn’t able to get filled at a price I liked.
Trades This Week:
NZD/JPY – Bought to open 3,000 notional units at 87.44
USD/JPY – Covered short 4,000 notional units at 103.09
EUR/USD – Bought to open 4,000 notional units at 1.3894
JO – Sold another 15 shares at 38.30 (16 shares remaining – yawn)
IWM – Sold an April 2014 103 Put for .55
Option Inventory:
IWM – Short April 2014 103 Put (sold for .55)
GLD – Short May 2014 108 Put (sold for .60)
SPY – Short April 168 Put (sold for .72)
TLT – Short May 2014 99 Put (sold for .55)
IYR – Short June 2014 57 Put (sold for .58)
ETF & Forex Inventory:
BAL (Cotton) – Long 50 shares from 53.19
JO (Coffee) – Long 16 shares from 23.38 (started with 58 shares)
IYR (Real Estate) – Long 39 shares from 65.63
SGG (Sugar) – Long 25 shares from 56.555
NZD/JPY – Long 3,000 notional units from 87.44
EUR/USD – Long 4,000 notional units from 1.3894
USD/CHF – Short 4,000 notional units from .87997
SPY – Long 15 shares from 185.05
RWX – Long 63 shares from 41.50
Looking ahead:
My sample account for the combined system is now up a good amount on the year and it’s interesting to note that the majority of the gains come from a few trades. That outcome is exactly what you’d expect to see from a trend following system. The small losers and winners seem to cancel each other out and there are a few large trades that make up the bulk of the returns. Right now the account doesn’t have much buying power available and I haven’t been able to add to the options positions in the way I’d like.
Next week I’ll continue to look for an opportunity to roll the $TLT naked put out to June and monitor what’s going on in the other markets. I may also roll the $IWM put I just sold from April to May to pick up a little extra premium.
Have a great weekend and please share this post with anyone you think would enjoy it. You can also share it using the social button toolbar above if that’s easier. Thanks for reading.
Want to receive an alert as soon as the next market commentary is posted?

Sign up for my email list and stay up to date with the latest information on options trading and trend following.
Click here to sign up for the list, get a copy of the Theta Trend Options Trading System, the Trade Tacker I use, and information about new systems.
Even better . . . it’s all totally free.