Weekend Market Commentary 2/14/14 – Stocks, Bonds, Gold ($SPY, $IWM, $GLD, $TLT)
Big Picture:
 Good morning. Gold finished this week with a solid gain after triggered a long signal early in the week. My only regret is that I was only able to get one short put sold, but that’s ok. The precious metals complex was very strong this week with Silver ($SLV) and the Gold Miners ($GDX and $GDXJ) moving higher. Gold is currently up 9.5% on the year following the 4% move higher this week. Do you know why? Because there are more buyers than sellers.
Stocks also marched higher this week and late Friday afternoon the S&P 500 ($SPY) hit the pSAR indicator to flip the trend from short to long. The Russell 2000, however, was weaker and the pSAR is still short. Despite being weaker, I rolled up and out my short call in the Russell 2000 and I’ll be closing the short $SPY call on Tuesday.
Side-note: For those of you who don’t already know, I’m a CPA and work as a tax accountant by day. What that means is that from now through April 15th my life becomes something of challenge. I’ll do my best to tweet out new trades, etc, but my work has really picked up and at times that might not be possible. For some reason, tax clients don’t appreciate you pausing your time with them to tweet trades. Oh well.
Implied Volatility:
Last week I mentioned that Implied Volatility was suggesting stocks might make a move higher. That happened this week. Implied Volatility is back in the middle of the 3 month range and, for now, it seems like any concern about a sharp decline has subsided.
The Weekly Stats:
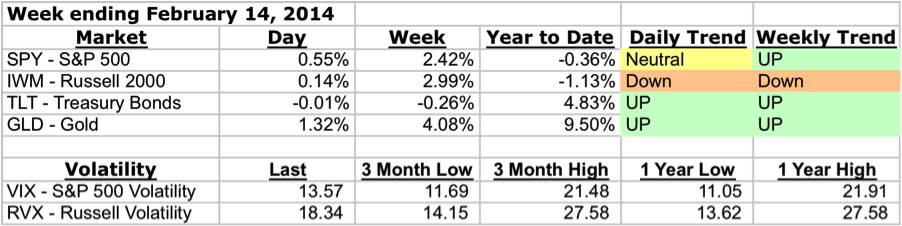
A note about trend . . . Trend on the daily timeframe is defined using Donchian channels and an Average True Range Trailing Stop. There are three trend states on the Daily timeframe: up, neutral, and down. On the weekly timeframe, I’m looking at Parabolic SAR to define trend and there are two trend states, up and down. In reality, there are always periods of chop and I’m using the indicator to capture the general bias of both the trend and those periods of chop.
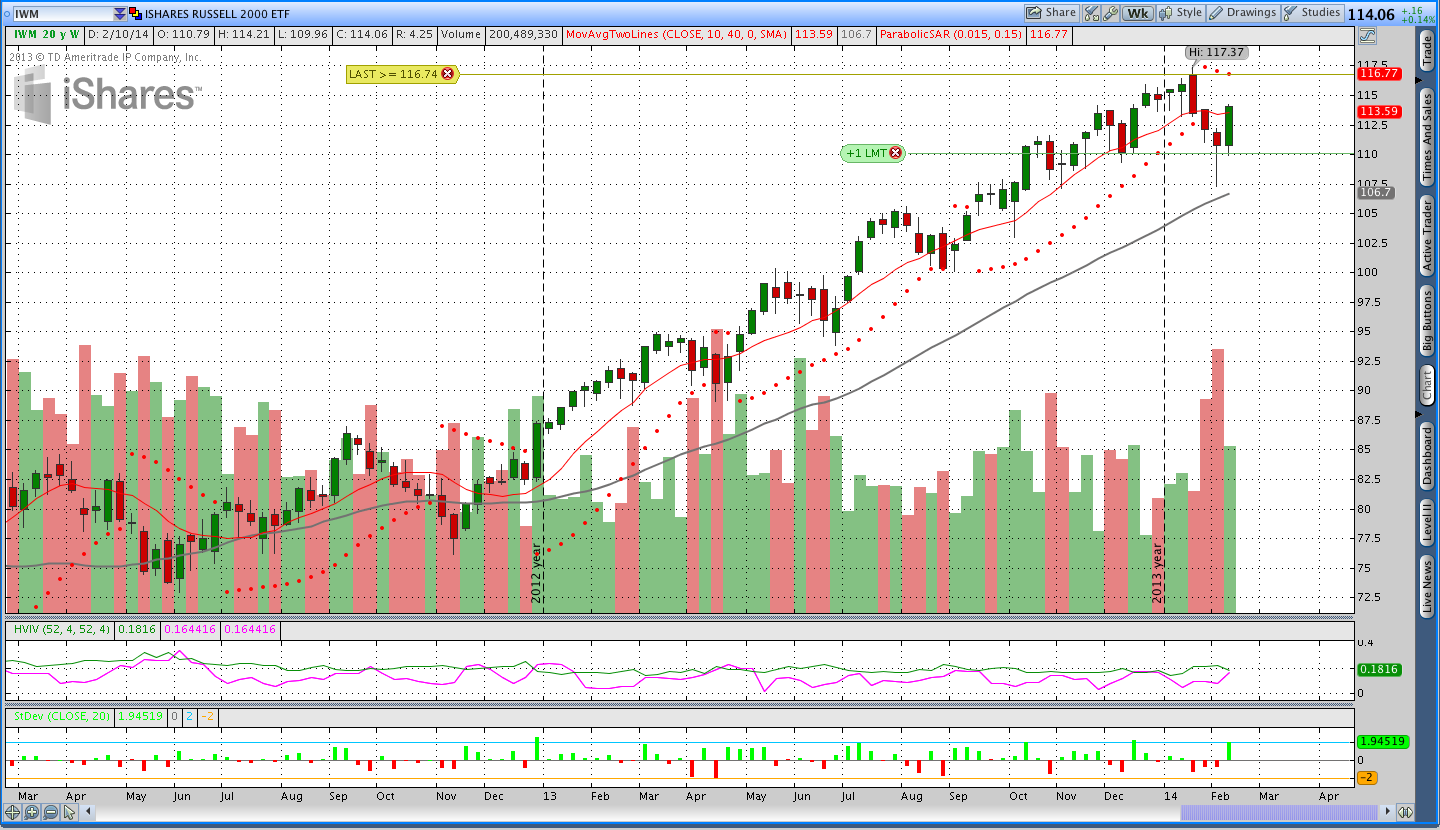
Stocks ($IWM – iShares Russell 2000):
The Russell 2000 finished the week with a solid gain, but the pSAR is still short. The Russell had a deeper percentage decline in January and it hasn’t recovered as strongly as the S&P 500. I rolled the short April call up and out to May on Thursday, which was a big up day.
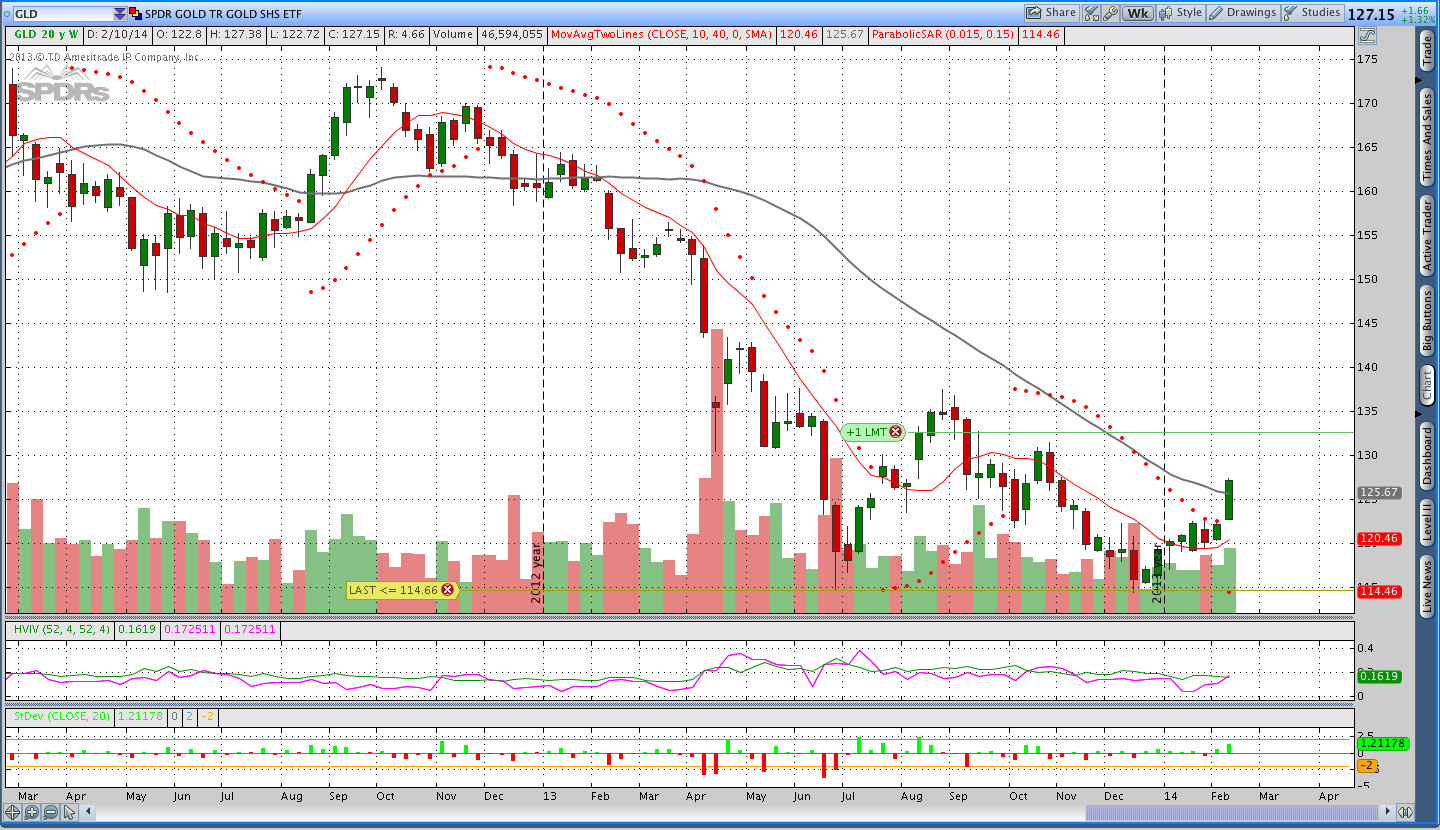
Gold ($GLD – SPDR Gold Shares ETF):
On Monday morning Gold gapped higher to take out the pSAR short signal and flip the trend long. I immediately sold a May put and tried to get an April put filled, but never got the price I wanted. From that point, Gold moved higher all week. On Friday Gold closed above the 40 week (200 day) moving average for the first time since January 2012.
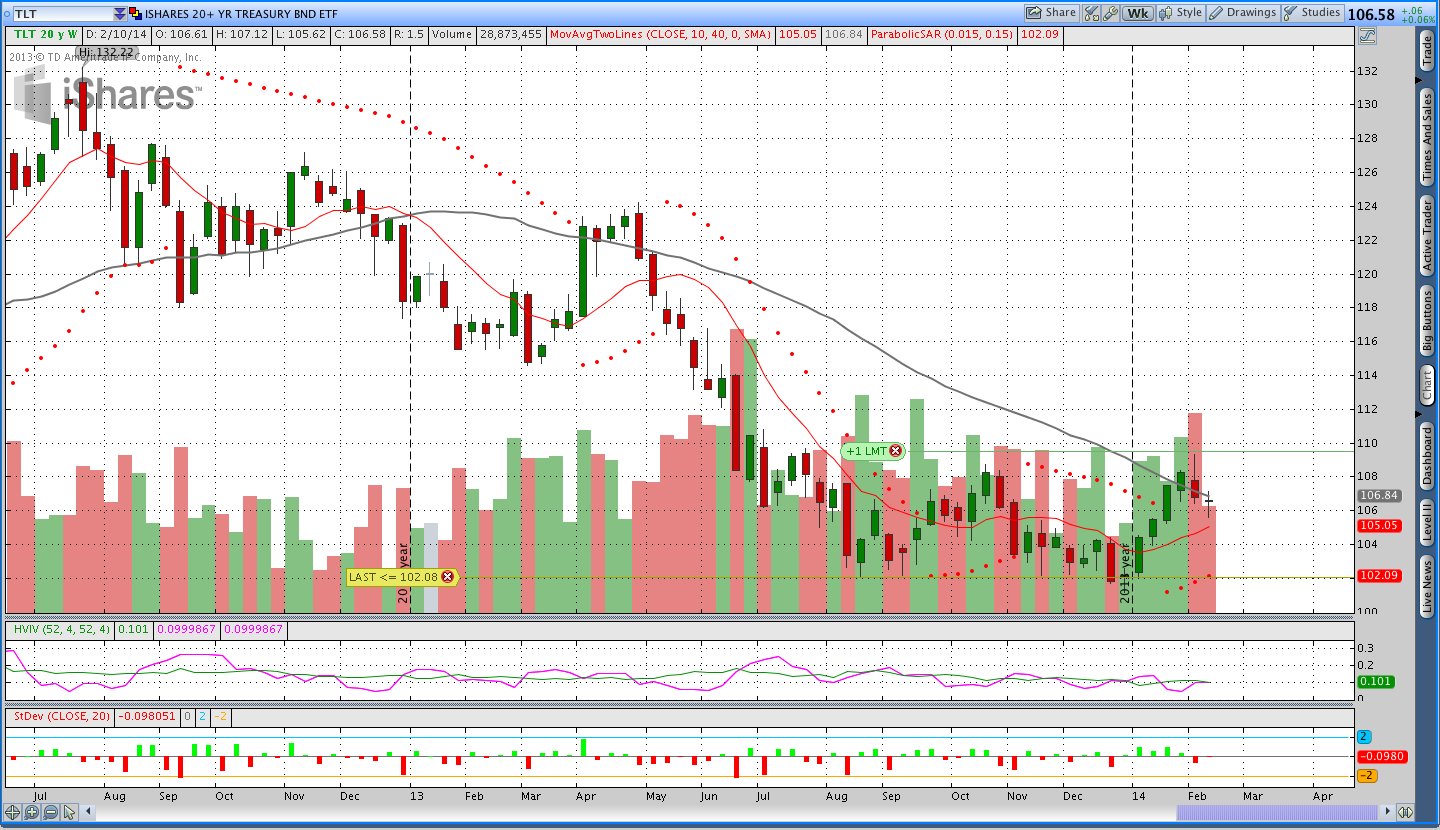
Bonds ($TLT):
Bonds had an uneventful week and there isn’t much to say. I’m still long and there hasn’t been much excitement, which is fine with me.
Donchian Channel Breakout Trades:
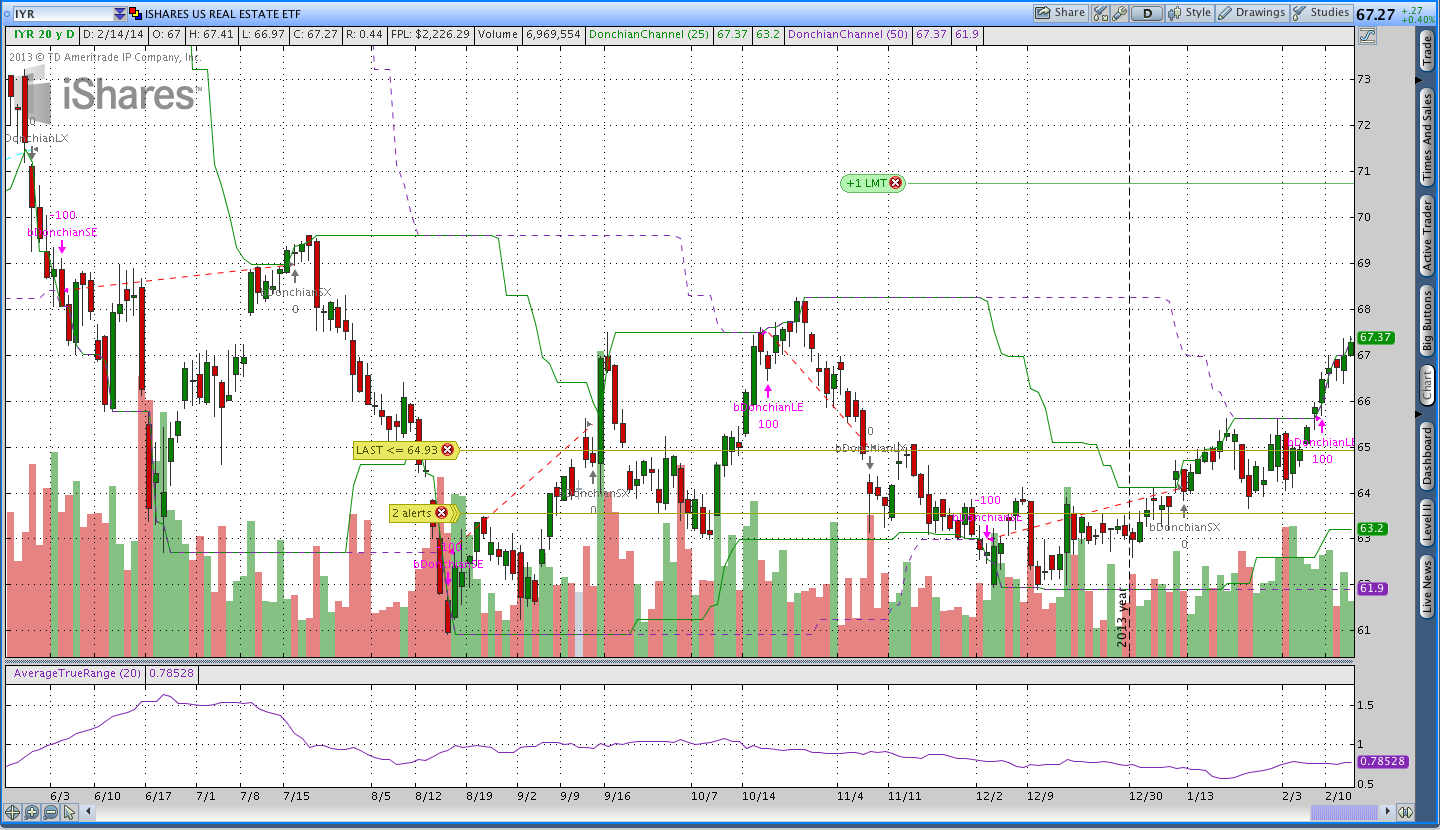
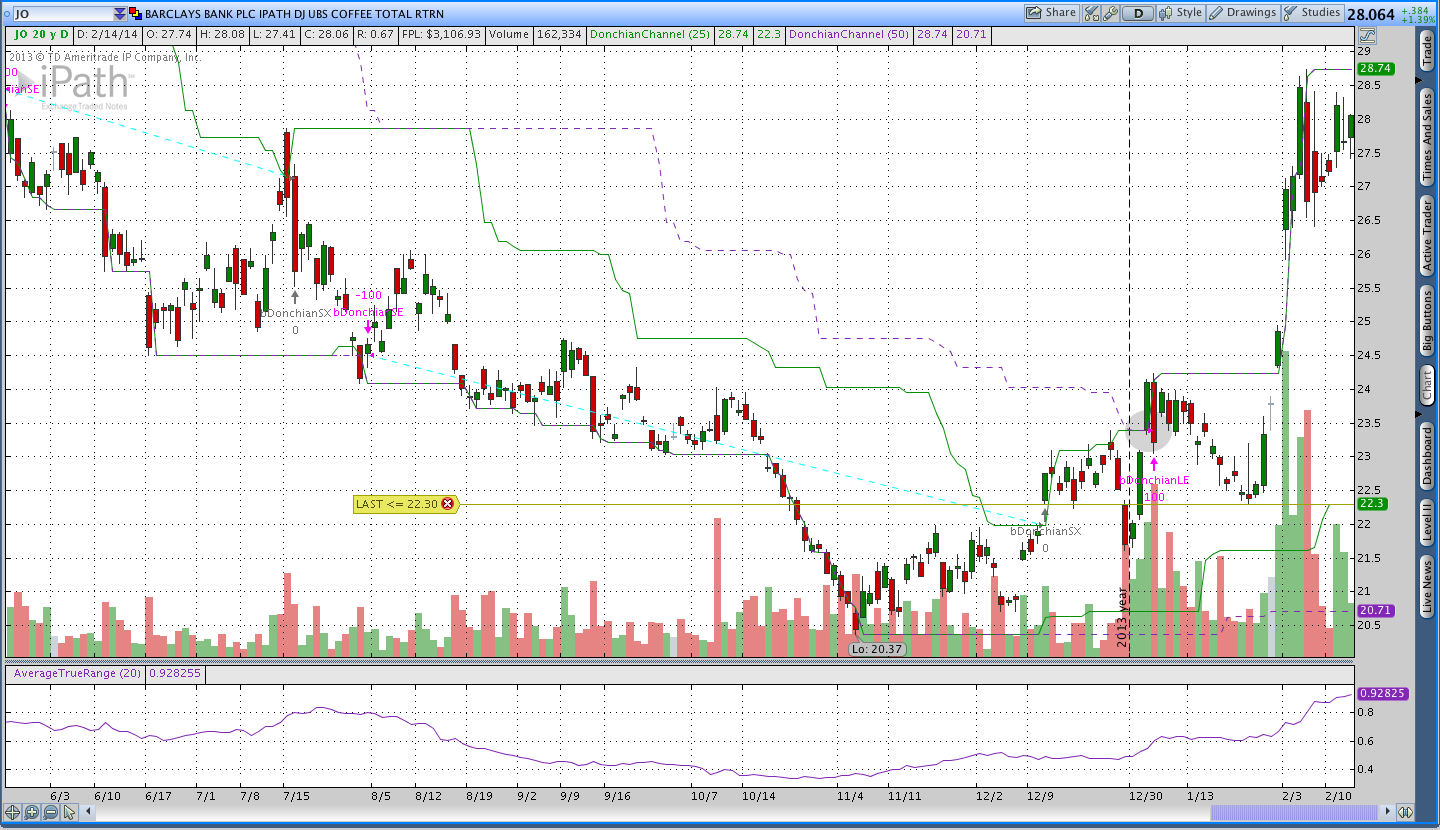
The Donchian Channel trades are still doing well overall. My short NZD/JPY position was stopped out this week, but Coffee ($JO) and Real Estate ($IYR) are moving higher.
Trades This Week:
IWM – Rolled the April Call to May
SPY – Sold a May 193 Call (that now needs to get covered)
GLD – Covered the short March and April calls
GLD – Sold May 108 Put for .60
NZD/JPY – Covered the Short 3,000 Notional Units
Option Inventory:
GLD – Short May 2014 108 Put (sold for .60)
IWM – Short May 122 Call (sold for .61 – rolled from April)
SPY – Short May 193 Call (sold for .53 – plan to cover on Tuesday)
TLT – Short May 2014 99 Put (sold for .55)
IYR – Short June 2014 57 Put (sold for .58)
ETF & Forex Inventory:
BAL (Cotton) – Long 50 shares from 53.19
JO (Coffee) – Long 58 shares from 23.38
IYR (Real Estate) – Long 39 shares from 65.63
USD/JPY – Short 3,000 Notional Units from 100.765
Looking ahead:
My stock positions had a rocky week, but everything else has been going well. The worst times for the pTheta system are when there is a trend change and then a reversal (a whipsaw). The short signal in $SPY that flipped long this week is one of those whipsaws. Fortunately, that hasn’t happened in the Russell yet. I’m going to cover my short $SPY call on Tuesday and look for a May put to sell. I’d like to sell another put in Gold and I’m just waiting for a little bit of a pullback to get a better price.
Have a great weekend and please share this post with anyone you think would enjoy it. Thanks.
Want to receive an alert as soon as the next market commentary is posted?

Sign up for my email list and stay up to date with the latest information on options trading and trend following.
Click here to sign up for the list, get a copy of the Theta Trend Options Trading System, the Trade Tacker I use, and information about new systems.
Even better . . . it’s all totally free.