Weekend Market Commentary 1/22/2016 – $RUT, $RVX, $SPX, $VIX, $VXV
Big Picture:
 For some reason (that I struggle to understand), the options trading universe seems to be fixated on selling naked premium. Even worse is the notion that it’s a “good idea” to sell futures options because it’s a, “better use of margin.” There are some big names promoting the strategies to inexperienced audiences, which strikes me as both irresponsible (at best) and potentially dangerous. The problem isn’t that the strategies don’t work, it’s that the allocations to the strategies are likely to be too great when a significant move takes place.
Last year the market underwent some sideways distribution and this year we’ve seen a controlled pullback. We have not seen a significant move with follow through since 2008 so newer traders haven’t experienced a true decline.
The collapse and quick rally we saw in August 2015 and the controlled move lower this year have largely allowed options traders to control their losses. Unfortunately, the controlled moves may also be rewarding them for holding bets with unacceptable unrealized losses. Newer options traders tend to focus on making money by selling premium. More experienced options traders look for opportunities to hedge their positions and reduce risk even if that adjustment later proves to be wrong.
As long as the market remains below declining moving averages, we need to remain skeptical of any rallies and anticipate the possibility of unexpected declines. Clearly we can’t predict where the market will go, but we can structure non-directional positions to avoid large Delta and Gamma exposure. If the market does find some follow through and make a sharp decline, the traders who controlled their risk will be rewarded.
The goal of non-directional trading is not to predict where the market will or won’t go. The goal is to construct positions that can adapt to market changes without excessive risk, losses, and heat.
Clues From Volatility
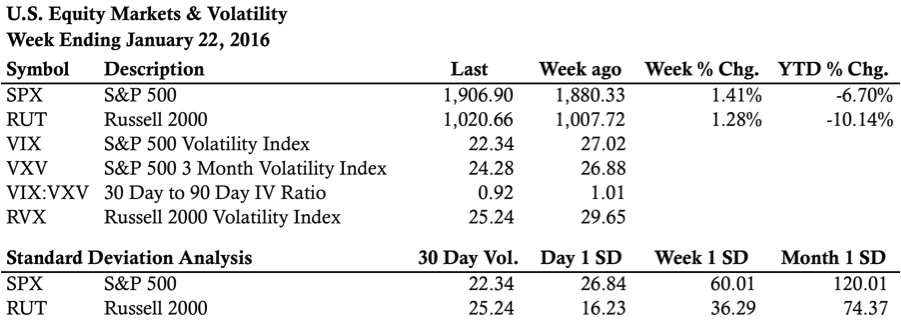
For the past two weeks both here and here, we’ve been discussing a divergence in Volatility. Specifically, the observation is that the move lower in 2016 has not been met with an explosion in volatility. Volatility has been much faster to collapse than rally despite the 6.7% move lower in the S&P and the 10% move in the Russell this year.
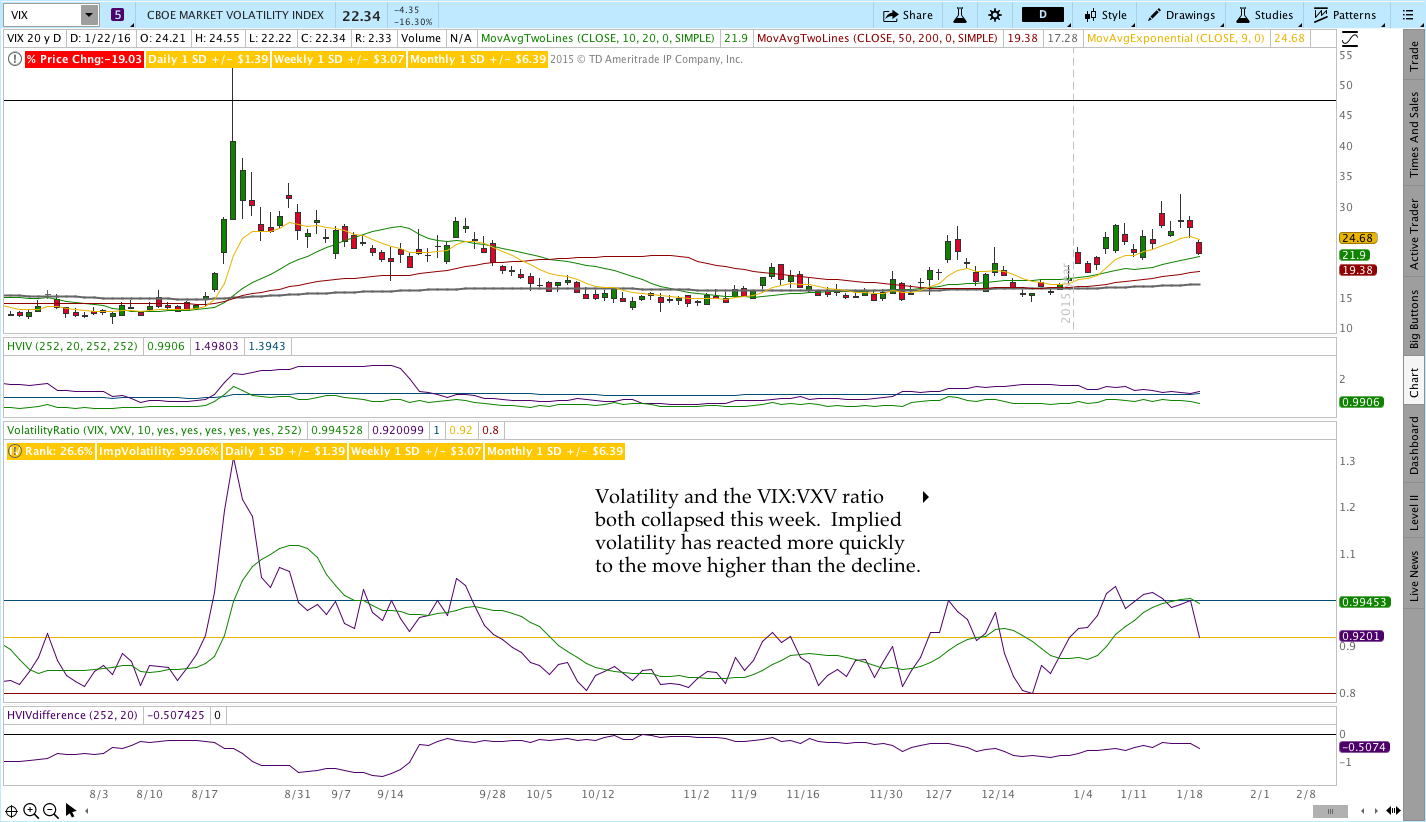
The premium of IV over HV is quite low right now given the recent decline and that validates the notion that the move lower is under control (at least for now). Additionally, the VIX:VXV ratio has fallen back to a more normal level even though the market is clearly damaged from a price standpoint.
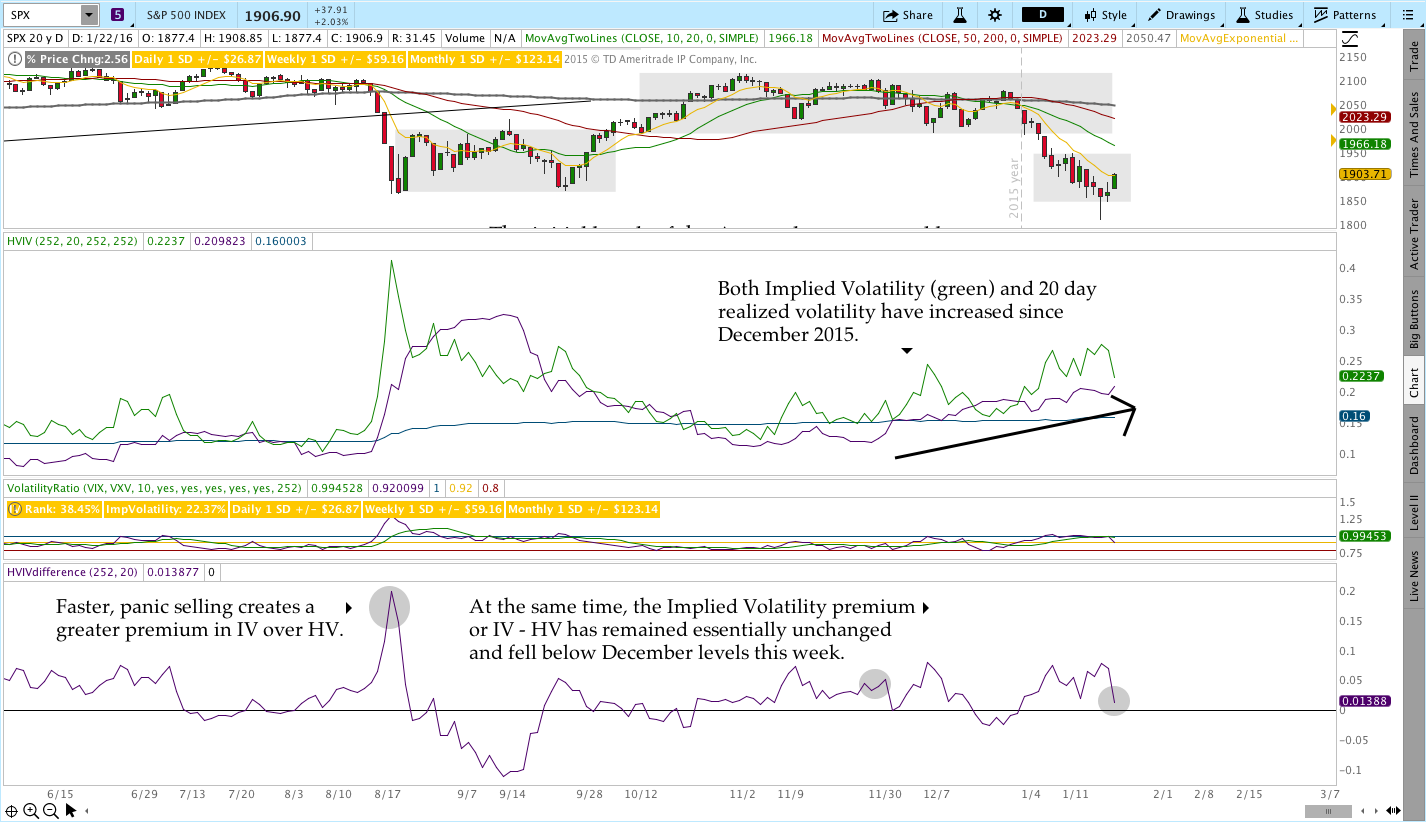
The reality is that we don’t know what will happen from here, but panic and capitulative selling have not entered the market yet. That realization suggests we’re likely to see either stability with a move sideways to higher or an unexpected breakdown followed by the panic that typically accompanies declines.
When you consider both price action and volatility, it seems likely that we’ll see some stability come into the market over the coming weeks. That being said, heavy unexpected selling could flip the market very quickly with the amount of complacency we see.
The market needs more participants to be caught off guard in order for panic to ensue.
Market Stats:
Levels of Interest:
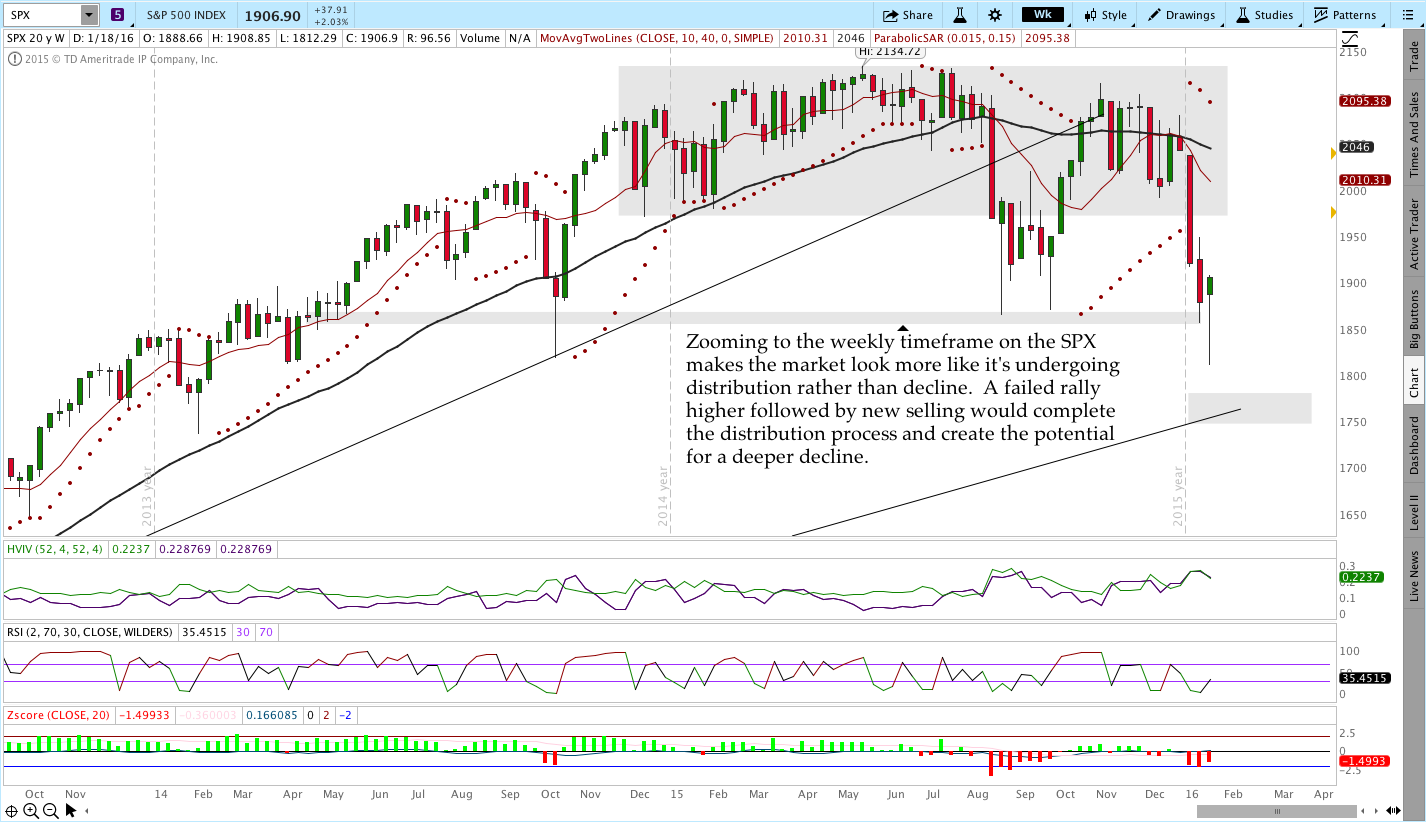
In the levels of interest section, we’re drilling down through some timeframes to see what’s happening in the markets. The analysis begins on a weekly chart, moves to a daily chart, and finishes with the intraday, 65 minute chart of the S&P 500 (SPX) and the Russell 2000 ($RUT). Multiple timeframes from a high level create context for what’s happening in the market.
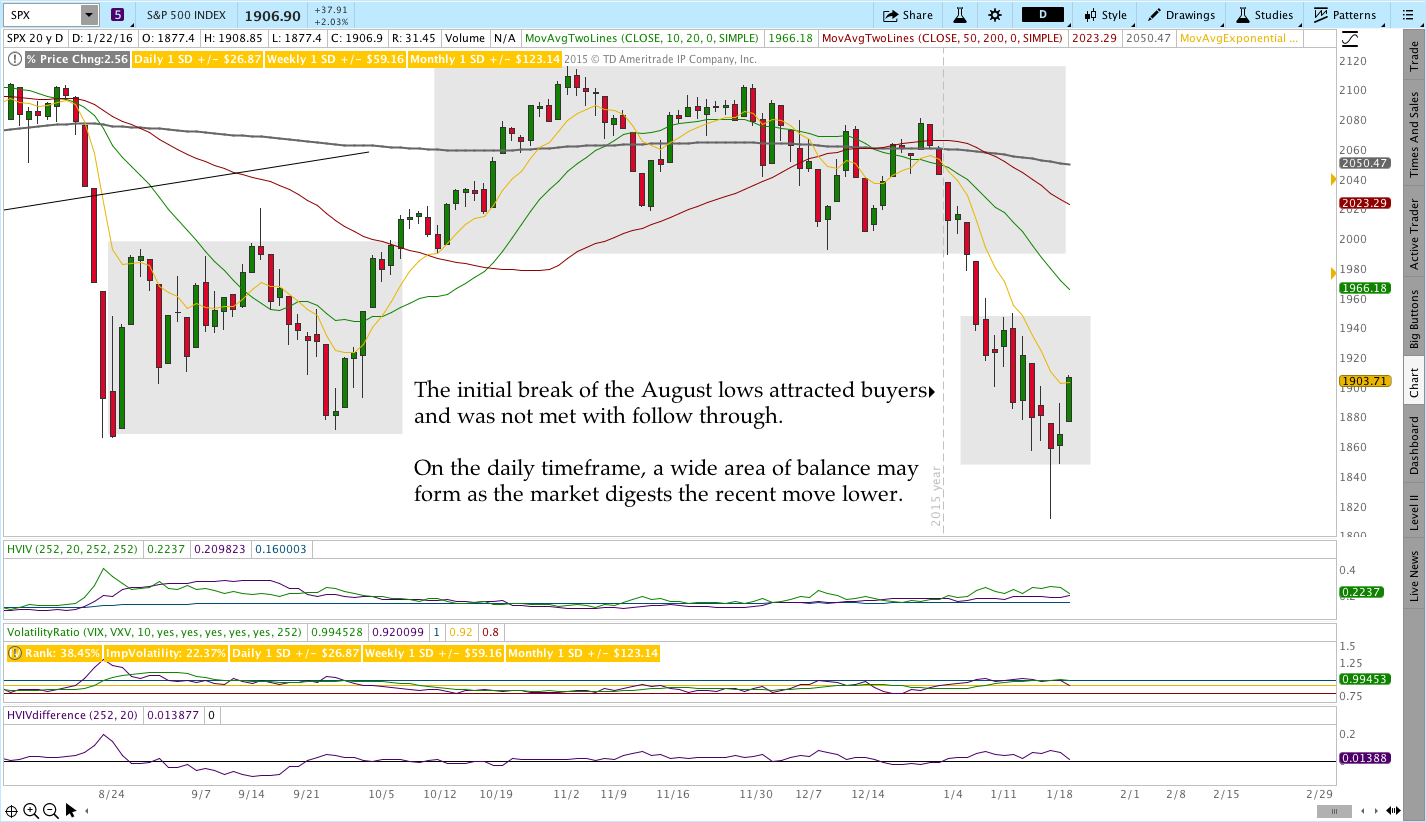
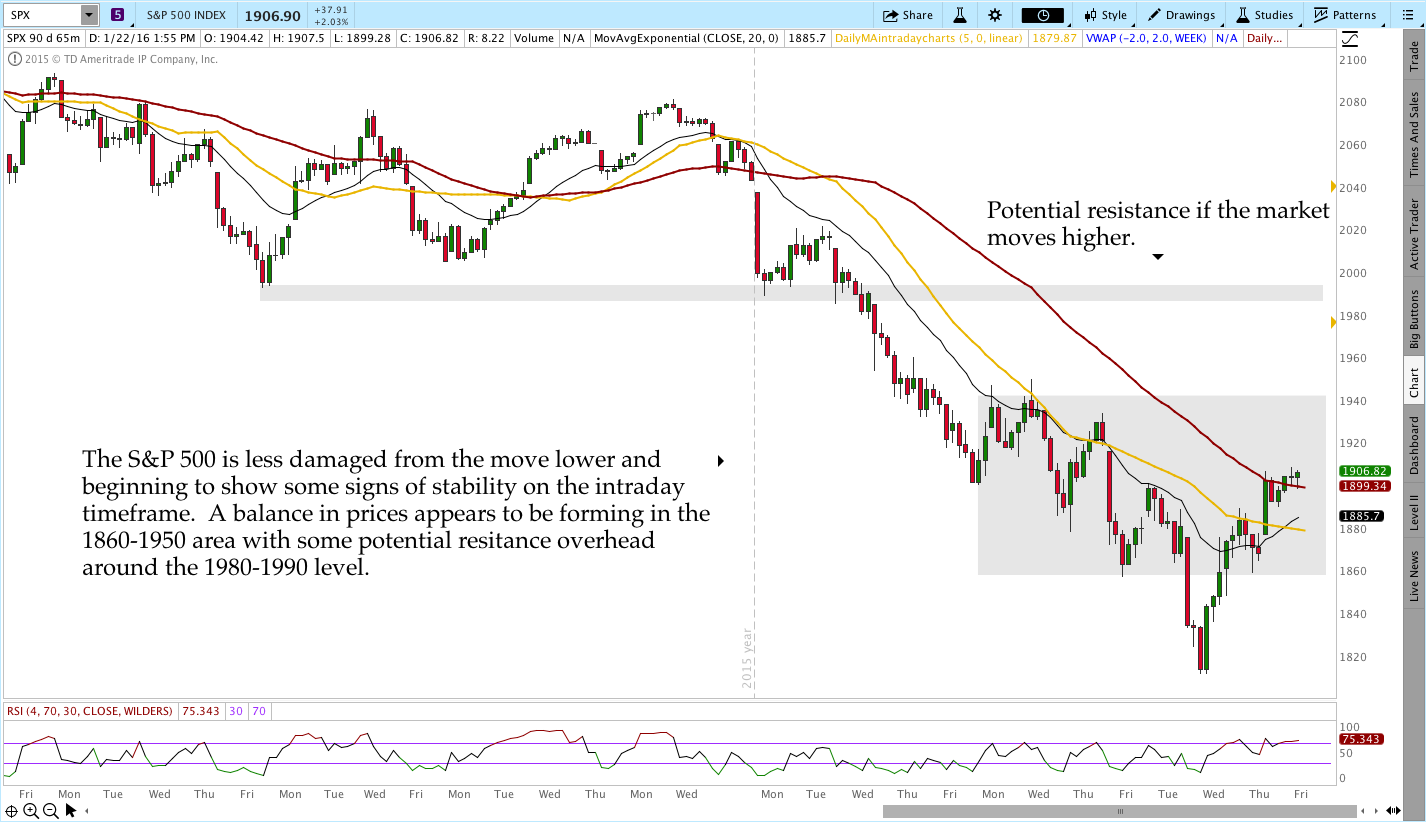
S&P 500 – $SPX (Weekly, Daily, and 65 Minute Charts):
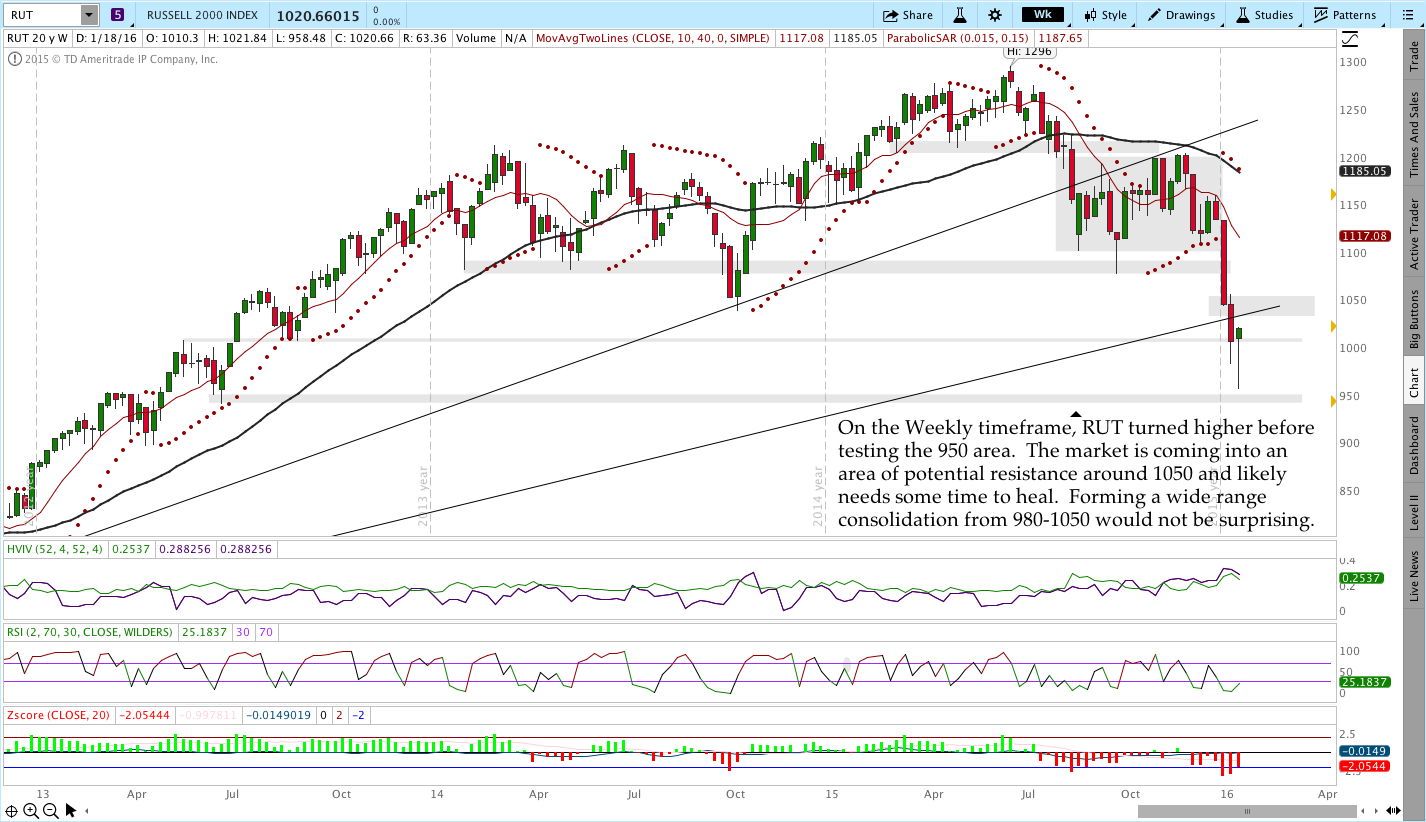
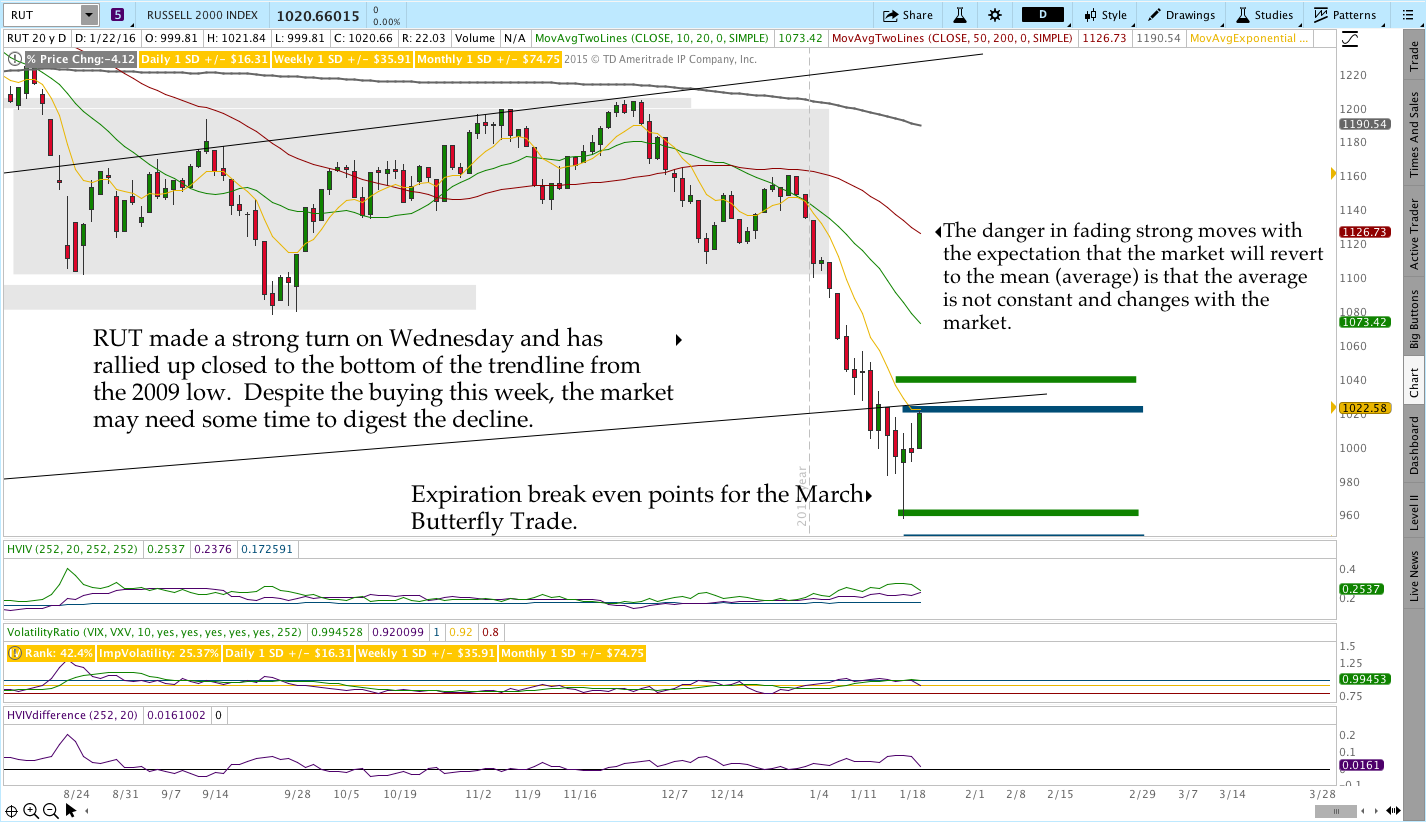
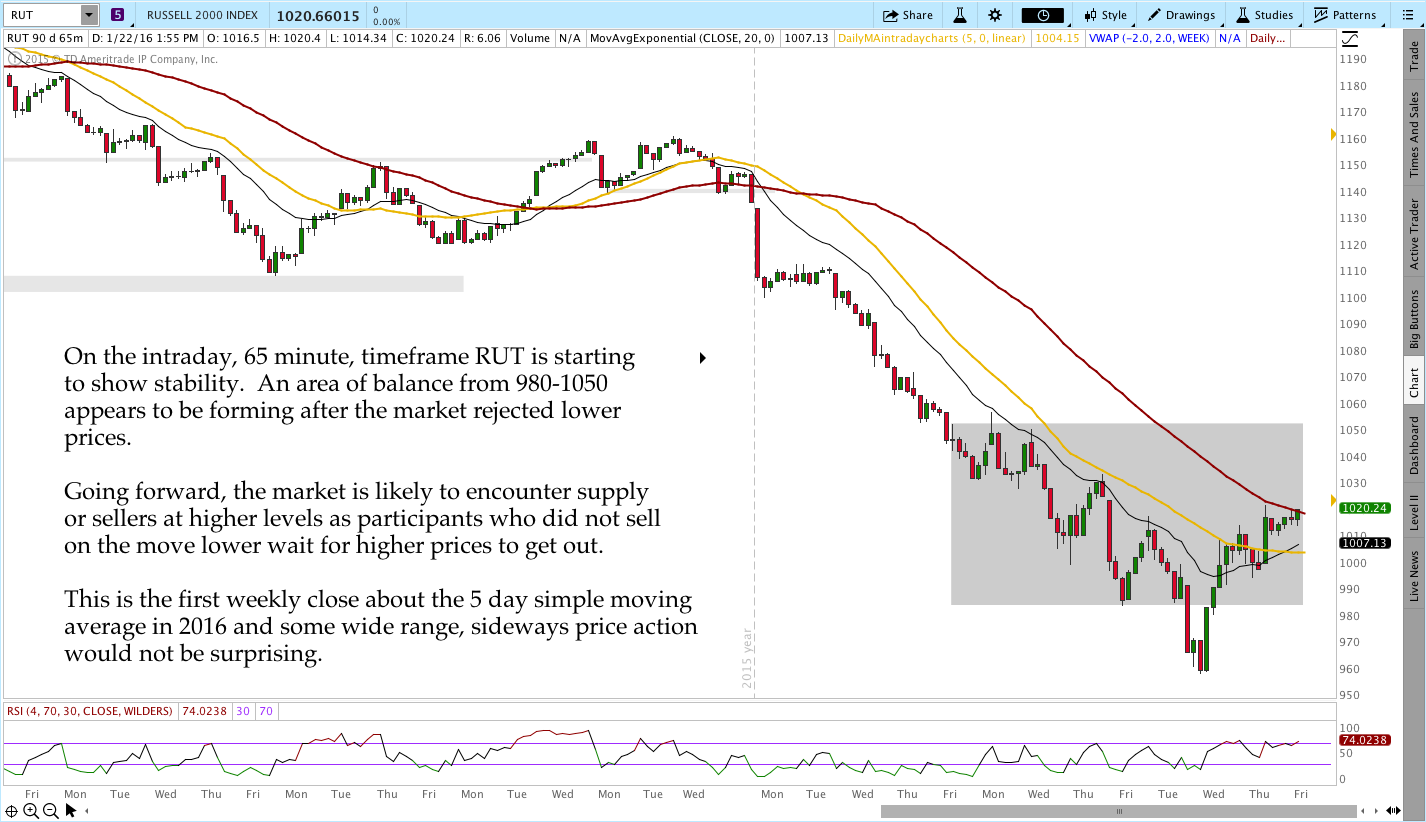
Russell 2000 – $RUT (Weekly, Daily, and 65 Minute Charts):
Live Trades . . .
The “Live Trades” section of the commentary focuses on actual trades that are in the Theta Trend account. The positions are provided for educational purposes only.
——————————
The March 2016 CIB trade is open and chugging along. I’ve been updating the Live Trade Page every day and I encourage you to check out that page if you’d like to learn more about trade entry, adjustments, and how I evaluate the market. The position is nearing an upside adjustment point, but it hasn’t become necessary yet.
The Broken Wing Butterflies (BWB’s) below the CIB are a preview of some strategies I’m testing.
Check out the Results Tab for fill prices and order specifics.
If you want to learn a safer, less painful way to trade options for income, check out the Core Income Butterfly Trading Course.
March 2016 Core Income Butterfly Trade:
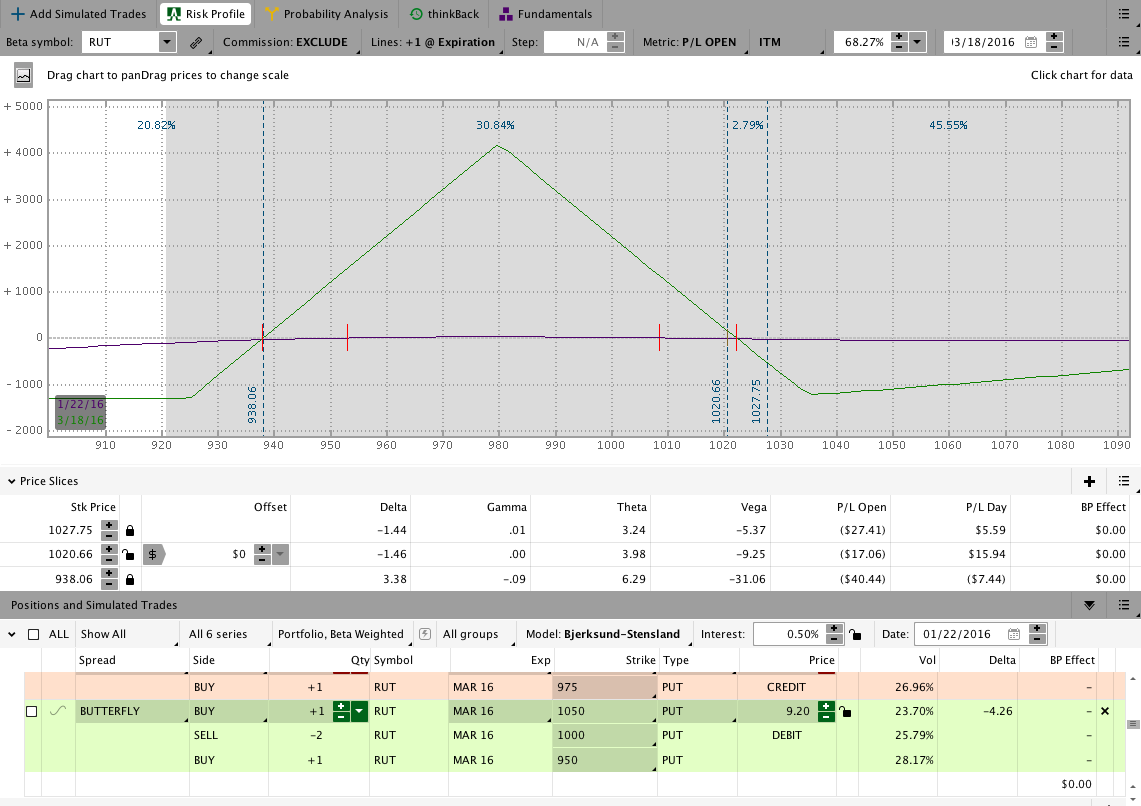
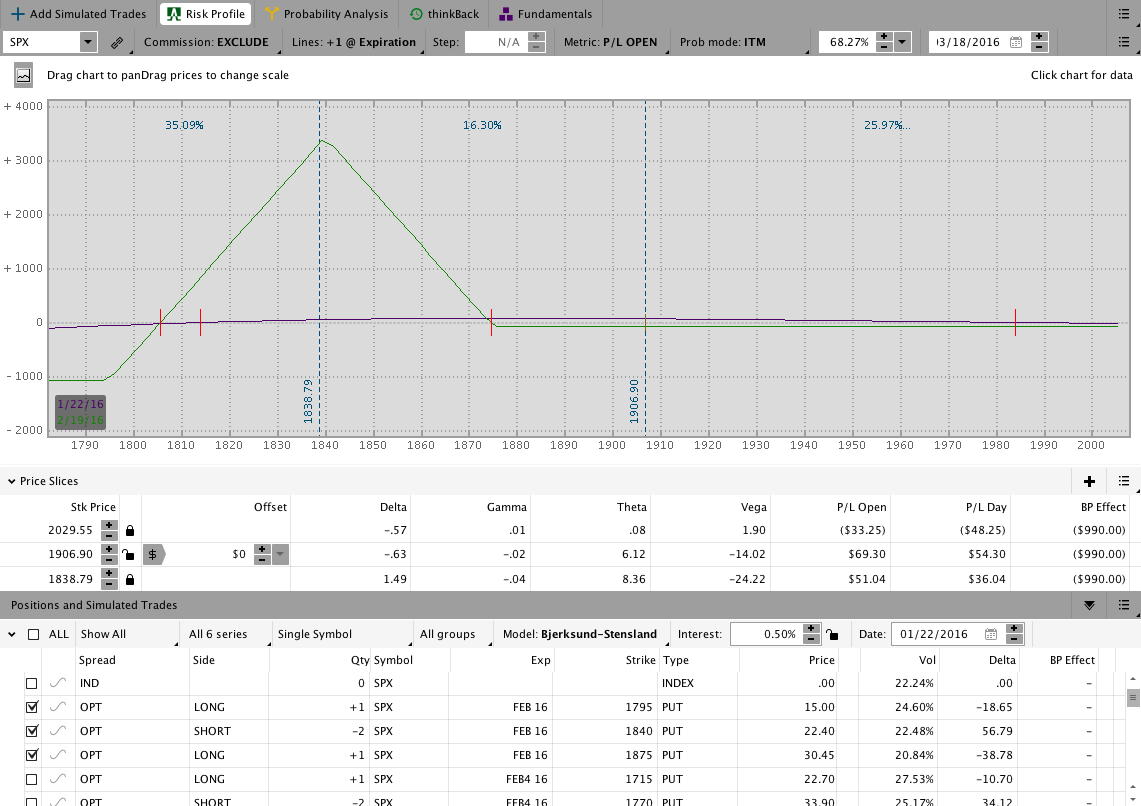
SPX BWB update (Around 35 DTE with 25 Delta shorts at entry):
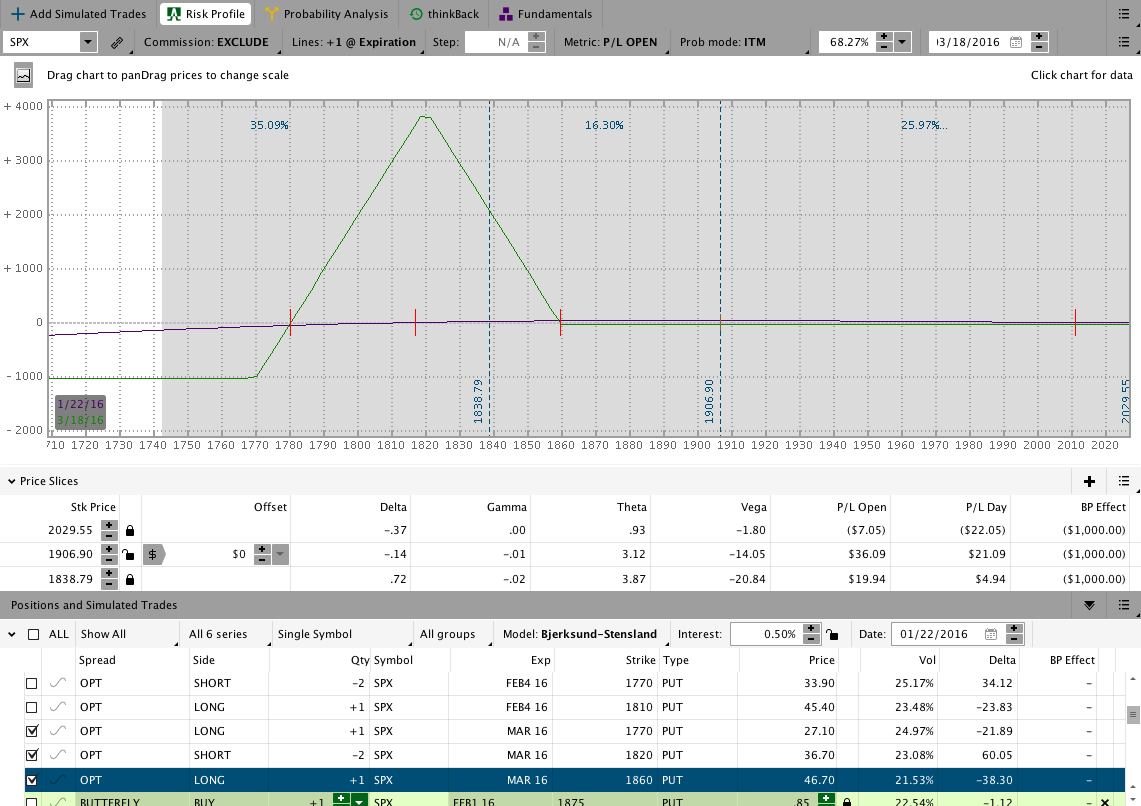
SPX BWB (Slightly over 60 DTE with 25 Delta shorts at entry):
The Results Spreadsheet is up to date as of Friday. All of the trades mentioned there are actual trades that I’ve taken. There are no paper trades or fuzzy fills, they’re all real.
Looking ahead, etc.:
Despite some big moves this week, all of the positions I have open are healthy. The sample account is showing an open profit on the year and my hope is that some portion of that will get locked in this coming week. Despite the wild start to 2016, the trades I’ve been in have taken very little heat and are holding up well. Next week I’ll be managing open positions and controlling risk.
Have a great weekend and please share this post if you enjoyed it.
Click here to follow me on Twitter.
Want to receive an alert as soon as the next market commentary is posted?

Sign up for my email list and stay up to date with the latest information on options trading.
Click here to sign up for the list, get a copy of the Theta Trend Options Trading System, the Trade Tacker I use, and information about new systems.
Even better . . . it’s all totally free.