Live Options Trade March 2016 Core Income Butterfly
Overview:
This post tracks the progress of the March 2016 CIB Trade. I’ll be updated the post as the trade progresses with written notes and video. The Greeks in the spreadsheet below will be updated daily.
As always, the information is being presented for educational purposes only and this is not a recommendation to take a trade.
Additional Information on the CIB can be found here and here and the premium course that covers the trade in detail is available here.
I do my best to Tweet trades as they take place and you can click here to follow me on Twitter.
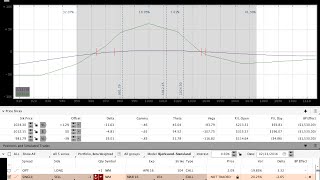
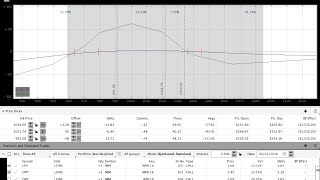
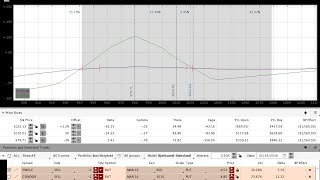
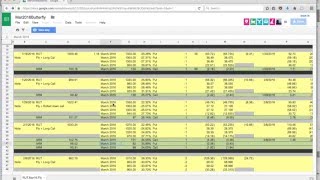
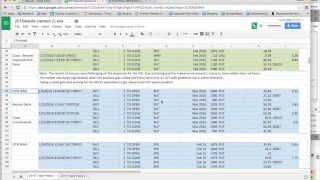
Position Greeks and Order Details (updated daily after the close):
Click here to view the full spreadsheet in another window/tab.
Note: The embedded results were removed from this page because it was creating viewing issues for some users. Clicking the link above takes you to the same spreadsheet that was previously embedded on this page.
Trade Update Videos:
-
-
2/24/2016 RUT CIB Closed For Around Target & Market Update
-
9
-
-
-
2/23/2016 RUT Options Income Butterfly Trade Update - Protecting Profit
-
9
-
-
-
2/22/2016 RUT March CIB Trade Update & New April Trade Entry
-
9
-
-
-
2/19/2016 RUT CIB Trade Update and Reverse Harvey
-
9
-
-
-
2/18/2016 RUT Core Income Butterfly Options Adjustment & KEY Levels
-
9
-
-
-
2/17/2016 RUT Core Income Butterfly Upside Adjustments and Rolling
-
9
-
-
-
2/16/2016 RUT Income Butterfly Upside Adjustment Choices
-
9
-
-
-
2/11/2016 RUT Core Income Butterfly Trade and Market Update
-
9
-
-
-
2/10/2016 RUT Core Income Butterfly Trade and Market Update
-
9
-
-
-
2/9/2016 RUT March CIB Downside Rolling Adjustment
-
9
-
-
-
2/8/2016 March CIB Downside Adjustments Update
-
9
-
-
-
2/5/2016 CIB Trade Update Nearing A Downside Adjustment Point
-
9
-
-
-
2/4/2016 RUT March CIB Trade Update Before Non-Farm Payrolls
-
9
-
-
-
2/3/2016 RUT Core Income Butterfly Update - Wide Range Market
-
9
-
-
-
2/2/2016 Daily Market and Position Update
-
9
-
-
-
2/1/2016 March CIB Upside Adjustment Video and Market Update
-
9
-
-
-
1/29/2016 March Options Butterfly Adjustment & Future Adjustment Plan
-
9
-
-
-
1/28/2016 Market and Butterfly Trade Update - All is well . . .
-
9
-
-
-
1/27/2016 Market and March Butterfly Update
-
9
-
-
-
1/26/2016 Options Butterfly Upside Adjustment Plan #2
-
9
-
-
-
1/25/2016 March CIB Trade Update
-
9
-
-
-
1/22/2016 Options Income Butterfly Upside Adjustment Plan
-
9
-
-
-
1/21/2016 Market Recap and Butterfly Trade Update
-
9
-
-
-
1/20/2016 Options Butterfly Trade Adjustment - Rolling Down
-
9
-
-
-
1/19/2016 March 2016 CIB Trade Entry
-
9
-
Trade Updates/Video:
February 24, 2016:
Note – Tomorrow there will be a new page to track the April trade and this page will not receive daily updates going forward.
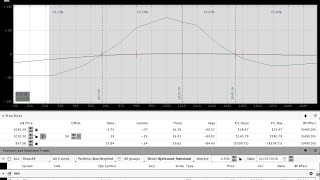
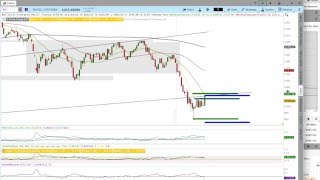
The March trade was closed today for around the target profit. I could have let the trade run longer, but the position was getting close to expiration and it seemed prudent to book the profit. It was a challenging cycle and I’ll post a recap at some point to summarize the position. The April trade is open and safe.
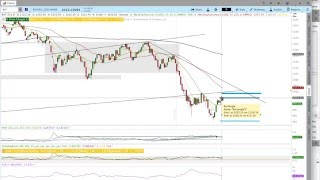
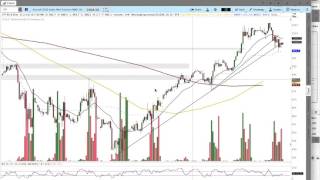
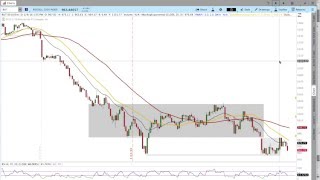
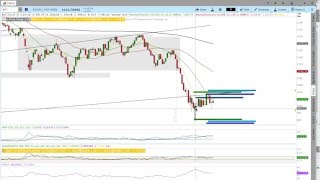
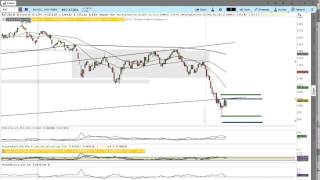
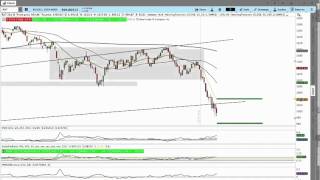
We saw a big turn in the market this morning after the gap lower, but on the intraday timeframe we still don’t have any confirmation of a move higher and lower. The range is large and that makes it easy to get caught off guard when the market moves. If RUT can get up above and hold the 1025 level, it has the potential to run to the 1035 area. Breaking back below 1000 would be short term bearish.
February 23, 2016:
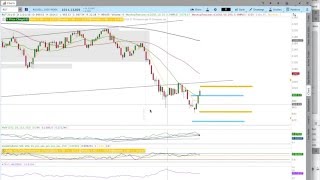
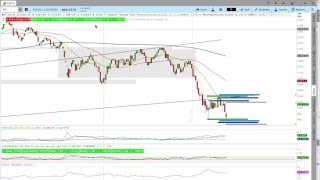
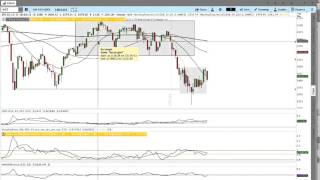
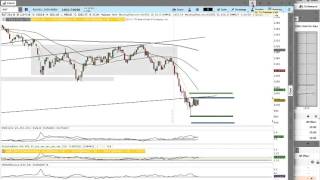
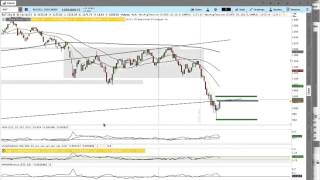
Yesterday we talked about the potential for a little pullback in the market today and that’s exactly what we saw. On the shorter term, 65 minute timeframe the RUT is still in a short term uptrend and has not violated the pattern of higher highs and higher lows. The daily timeframe is still bearish.
The March CIB has a good open profit as of the close today and I’m watching the trade and the markets closely. I’m trying to let the trade run slightly longer to pull in a little more money for the high commissions this month, but I will be trading to protect profit. Tomorrow I’ll be watching for a potential break of the 1000 and 1007 levels in RUT. Violating those levels could take the market down to the 985 area in the short term. If the market moves back up and above 1015-1020 area, I’ll become more defensive on the upside. The daily video goes through the trades and key levels. The April position that was opened yesterday is healthy.
February 22, 2016:
Some of the constructive price action we saw last Friday continued today with RUT gapping and then trading higher early in the day. At the same time, the move higher lacked conviction and follow through so I wouldn’t be surprised to see a red candle print on the daily chart tomorrow. I have, however, been wrong many, many times before.
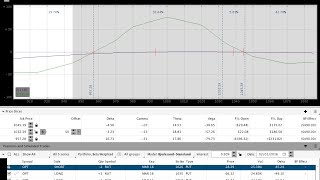
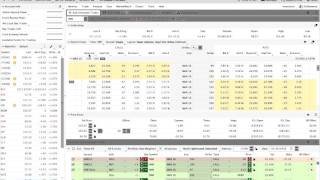
The trade was adjusted up today by closing out one of the 980 Butterflies and adding another 50×45 BWB centered at 1020. I also sold out the 99 and one of the 101 IWM calls to get delta slightly shorter (rather than neutral) overnight.
The video above goes through important technical levels for the March trade and discusses the April trade that was opened today. The spreadsheet above has a second tab added for the April position.
February 19, 2016:
The market nudged higher today and off of the 1000 level that we were watching. There are some constructive signs to validate the stability we’re seeing . . . most notably a collapse in implied volatility. Getting up and above the 1016 level will be key going into next week and a break below 995 will be short term bearish.
I made a “Reverse Harvey” adjustment to the position today to flatten the T+Zero line and the trade went into the weekend in good shape. We’re at 27 DTE as of Friday and my hope is that we’ll be able to exit the position next week and open a new April trade. Check out the video above for my anticipated adjustment if the market moves higher.
February 18, 2016:
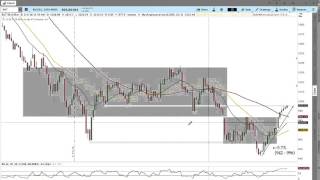
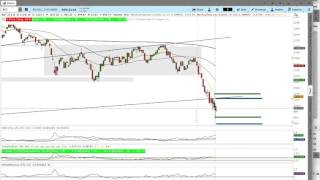
While I’m almost always happy to see a pullback when I’m trading the CIB, we do need to keep the pullbacks in perspective. The Russell has made an impressive move up and off the recent lows around 942 and took some time to rest today with a slight pullback. The longer term trend is definitely bearish while the shorter term trend still has the potential to move higher. I’m going to be watching the 1000 and 1016 levels in the market very closely tomorrow. If the market can get beyond and hold one of those levels, the potential for continuation exists.
The P/L on the trade swung back today and we’re in a good position. I rolled up one of the short 955 puts to 965 earlier this morning to cut the short delta slightly and provide a little more protection if the market does move slightly higher. The video above goes through the levels I’ll be watching tomorrow and hopefully we’ll wrap this trade up sometime next week.
February 17, 2016:
The market continued higher again today and the position was adjusted twice to move out the expiration break even. My hope at this point is that RUT takes a little time to slow down on the upside and simply rests. We don’t need a huge pullback to help the position as much as we just need a little less movement. The trade is inside of 30 DTE and the Butterflies are beginning to decay more quickly. The position is showing an open loss at this point due to the numerous adjustments, but the trade is still within guidelines. We’ll see what tomorrow holds. Check out the vide above for more information on the adjustments.
February 16, 2016:
As I mentioned in the video above, I’m starting to get a little dizzy with the wide range and back and forth price action. The Butterfly is sitting right around an upside adjustment point (again). I’m considering either rolling up one of the lower Butterflies or adding 2 Butterflies slightly below the money. The ultimate choice will depend on the overnight action in the market and how price reacts at the 995 level in the morning.
The T+Zero line is flat even though we’re slightly outside the body of the Butterfly so I’m not exceptionally concerned. This has been a very active expiration cycle from an adjustment standpoint, but the position is still safe and well within risk guidelines. Check out the video above for more information on the adjustments I’m considering.
February 11, 2016:
Quick note that there may not be a daily video tomorrow afternoon because I may be away from my computer. I will update the trade spreadsheet by Saturday morning at the latest and in time for the Weekend Commentary.
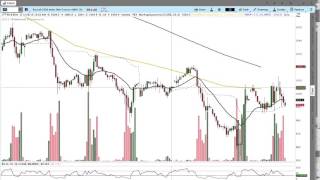
The Russell violated the recent low around 955 today and struggled to move back into the previous range from 955-985. For the time being, the market is bearish and we can expect to see a continuation of the move lower. Getting back above 955 creates the potential for a short term move higher. On the longer term, weekly timeframe, nothing suggests a bottom is forming or that there is any reason for bullishness. The market continues to violate previous support levels and move lower. The current position is still in good shape despite some wide swings in the market that forced us to chase lower early in the trade, then higher, and now lower again. See the video above for full update.
February 10, 2016:
Just because the market is higher intraday, it does not mean the decline is over. The market is making some big moves in both directions and that price action makes it easy to get shaken out of trades and/or over-adjust. Today RUT backed away from the 985 level we’ve been watching as an area of potential resistance and headed back towards the recent lows. The position should be safe on a gap lower to 900 and potentially beyond that with the disaster protection put that was purchased on February 5th. A video discussing the position has been uploaded.
February 9, 2016:
Have I mentioned that I’m becoming a little bearish? The market doesn’t seem to be happy right now and the daily trading ranges are large. I rolled the 980 Butterfly down to 955 and picked up another IWM call to protect the upside. When I put the position back on, I went with two RUT flies to compensate for the previously full sized position. The Greeks in the position are good and we have some additional room to run on the downside. See the video and spreadsheet above for the trade details.
February 8, 2016:
We had a rough gap lower in the RUT this morning followed by continued selling. The position is back to one butterfly and call and has an open loss. The trade is well within the risk guidelines and the Greeks are under control. A video was uploaded.
February 5, 2016:
It was an ugly day and week for the U.S. Equity Markets. The March CIB is sitting around a downside adjustment point, but I haven’t changed the position yet. I picked up an out of the money IWM put going into the close to protect against a catastrophic gap lower over the weekend. I don’t expect a catastrophic gap lower, but I’m willing to spend a little money on insurance given the current price action. An overview video of the position was uploaded.
February 4, 2016:
The Russell ended the day slightly positive, but it’s still just chopping around. There hasn’t been any follow through in either direction and that’s good for the CIB. Tomorrow morning is Non-Farm Payroll and that has the potential to move the market. A brief video showing the position was uploaded above.
February 3, 2016:
The market seems to be moving a lot without much direction. The position came very close to a downside adjustment point today, but the market quickly rebounded. The position is safe. See the video for more information on the trade and the market.
February 2, 2016:
The Russell pulled back today and the trade came into the money a little bit. The upside adjustment from yesterday brought the position to full size and the trade should begin to decay more quickly in the coming days. The Greeks are under control. See the video above.
February 1, 2016:
The market pushed a little bit higher intraday only to end the day down a few points. We added the third Butterfly to the position and the trade is now full size. The position has a small open profit and we’re at 45 DTE. See the video above for the full update.
January 29, 2016:
The market flew up today and I adjusted the trade on the upside. The market closed outside of the body of the Butterfly due to a rally in the last hour and the position has a slight drawdown. The trade is under control and may get another upside adjustment on Monday depending on how the market opens. The video above gives the full run down.
January 28, 2016:
The Russell 2000 is still chopping around with little direction. The market was higher early in the day and sold off to end essentially unchanged. The position is moving along and healthy.
January 27, 2016:
The Russell 2000 backed away from the upside adjustment point and the market is in a state of chop without much direction. The daily video reviews the position and the market environment.
January 26, 2016:
The market is whipping back and forth and we’re nearing an upside adjustment point again. The daily video goes over the adjustment plan if we move higher tomorrow.
January 25, 2016:
There was a nice little pullback in $RUT that helped the position. A video has been uploaded to the gallery above.
January 22, 2016:
The trade is getting close to an upside adjustment point. A video was posted discussing the next move. Towards the end of the video I also discuss and show you a new trade I’m testing out.
January 21, 2016:
A video has been uploaded to the gallery above. Enjoy.
January 20, 2016:
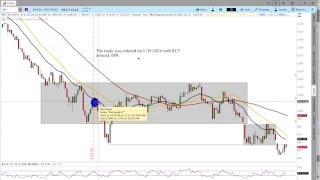
Later in the day: After breaking through the downside roll point, RUT found buyers and the market moved higher. RUT is also outperforming SPX, which is the opposite of what we’ve been seeing lately. I used the strong bid to re-open the CIB at 980 with 55 point strikes.
Early notes: The market gapped lower overnight and the position hit the downside adjustment point. The market failed to move higher from the adjustment point and the position was closed. The trade will be reopened tomorrow or the next day. We’re around 57 days to expiration so we still have plenty of time to get involved.
January 20, 2016 Video:
Entry Day Video – January 19, 2016:
Don’t miss out. Want to receive an alert as soon as new content is posted?

Sign up for my email list and stay up to date with the latest information on options trading.
Click here to sign up for the list, get a copy of the Theta Trend Options Trading System, the Trade Tacker I use, and information about new systems.
Even better . . . it’s all totally free.