Writing Naked Puts. The Unspoken Challenger to Buy and Hold
Casual investors are usually discouraged from selling naked options because naked options are considered “risky.” The occasional exception is selling naked puts, however, naked puts are frequently presented as a strategy to buy stock at a lower price. I’m not totally sure why it’s less risky for a causal investor to buy a stock that’s declining in price, but we’ll leave that as a discussion for another day.
In addition to the advice to stay away from naked options, many investors are encouraged to be long stocks . . . always. The challenge with a buy and hold mentality is that there are times when stocks decline in value and it doesn’t make sense to hold them. However, as I hinted above, today we’re not going to discuss the merits of buy and hold. Today we’re looking a better way to buy and hold and, ironically, it involves selling naked options.
Put Selling, Briefly:
Before we talk about index returns, let’s take a quick minute to discuss a naked put. Selling a naked put means you’re giving someone else the right to sell stock at a certain price in the future. The price the put holder has the right to sell the stock at is the strike price. The goal of selling naked out of the money puts is that price will close above your strike price at expiration and the put will not be exercised. Intuitively, if the market price is higher than the naked put strike at expiration, the holder will not want to sell stock at a price below the market price and the put will not be exercised.
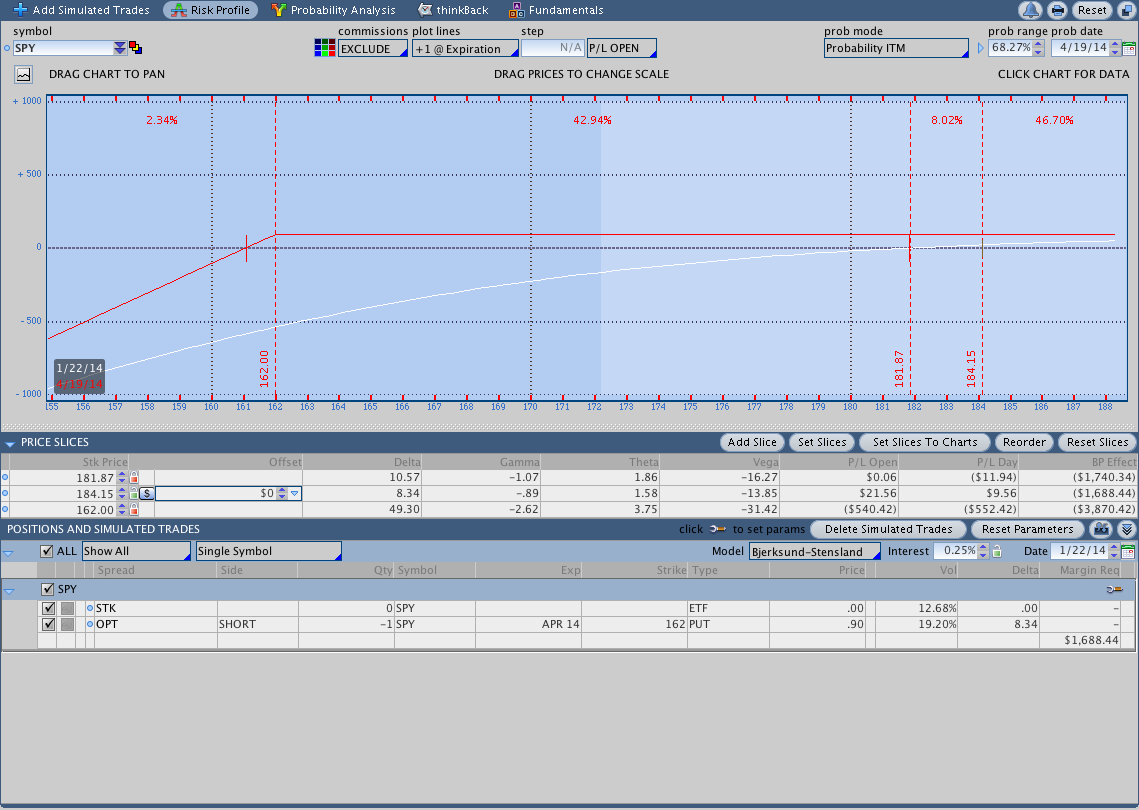
When you sell a naked out of the money put there are three ways to come out ahead. You can make money if price goes up, down slightly (stays above the strike), or remains the same. The image below shows the risk graph for a naked put.
A naked put strategy is very simple and, as we’ll see below, the indexed returns can be less volatile and higher than buying and holding stocks (specifically the S&P 500).
CBOE Put Write Index:
The CBOE Put Write Index ($PUT) sells one month at the money $SPX puts and invests the cash in one and three month treasury bills. The index is collateralized meaning that enough cash is held to secure settlement of the short puts. The strategy is a conservative options strategy that sells cash secured puts to improve the return of the short term treasury rate. Simple enough?
What the strategy is really doing is attempting to generate additional yield beyond the short term treasury rate. The index is taking a vehicle with a known yield (albeit small) and minimal price risk and attempting to sell premium to boost returns. The strategy at Theta Trend has been similar except that I’m using a trend following system to generate returns and selling both calls and puts.
While the Put Write Index is slightly different than selling out of the money puts, it’s a good benchmark index for a put selling strategy.
Put Write Returns vs. S&P 500 Returns:
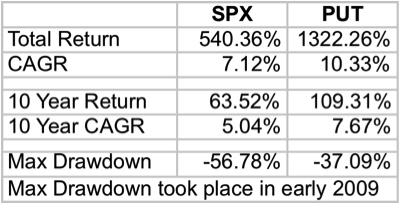
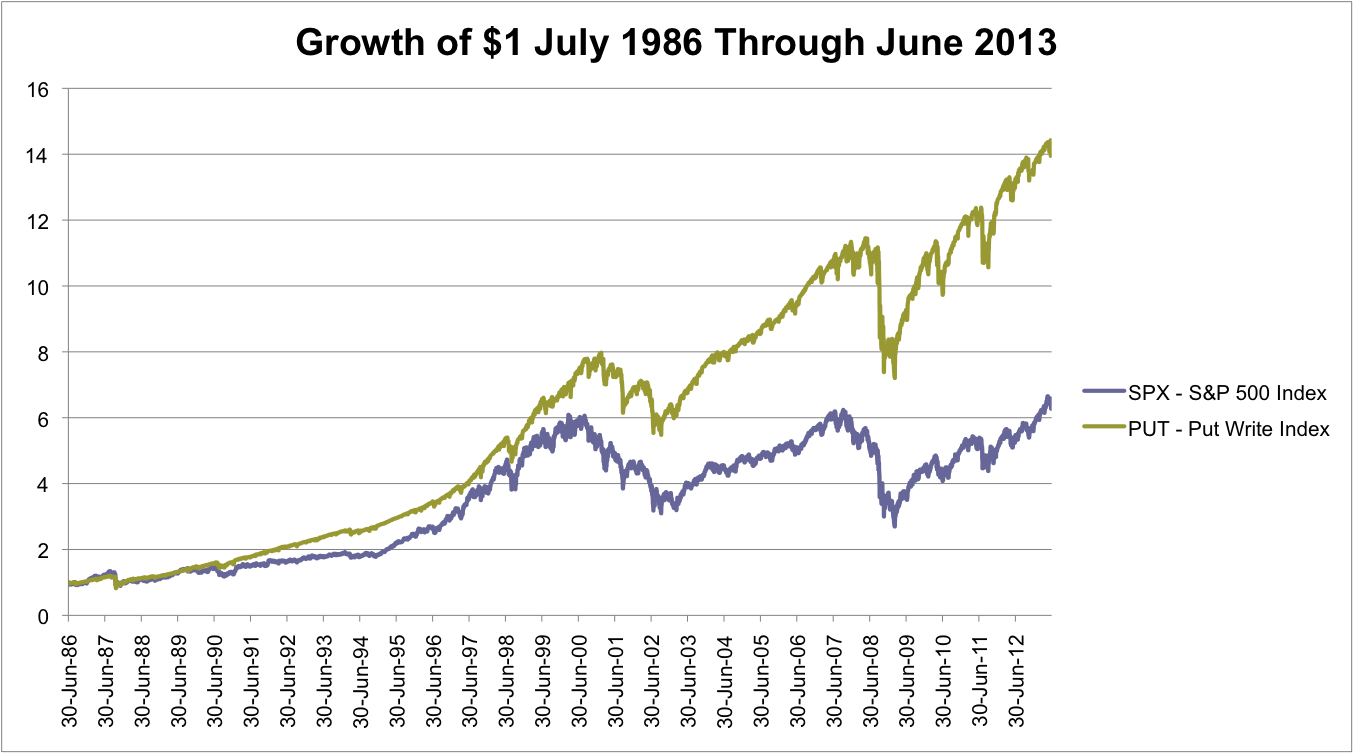
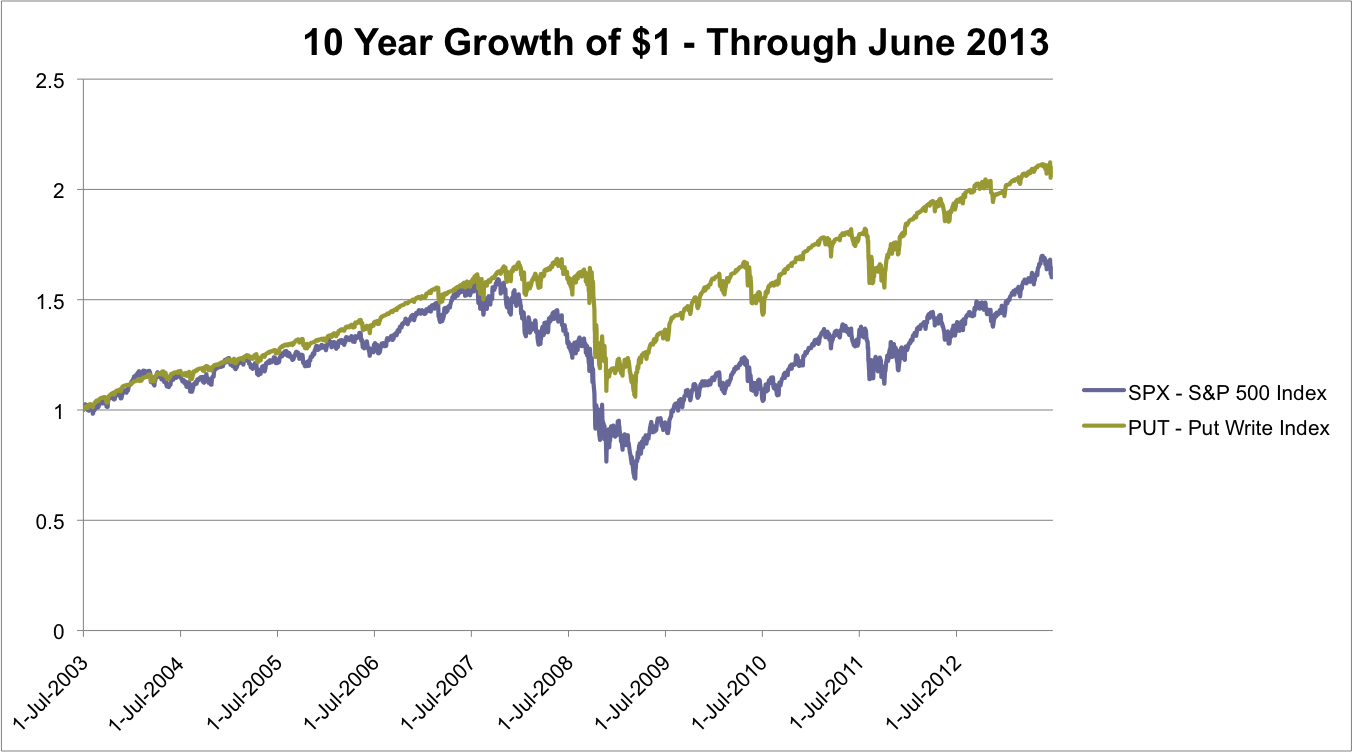
The bottom line on returns is that $PUT outperforms the S&P 500 on a buy and hold basis and does it with a lower draw-down. Would you like to to have higher returns with lower draw-downs?
Extensions:
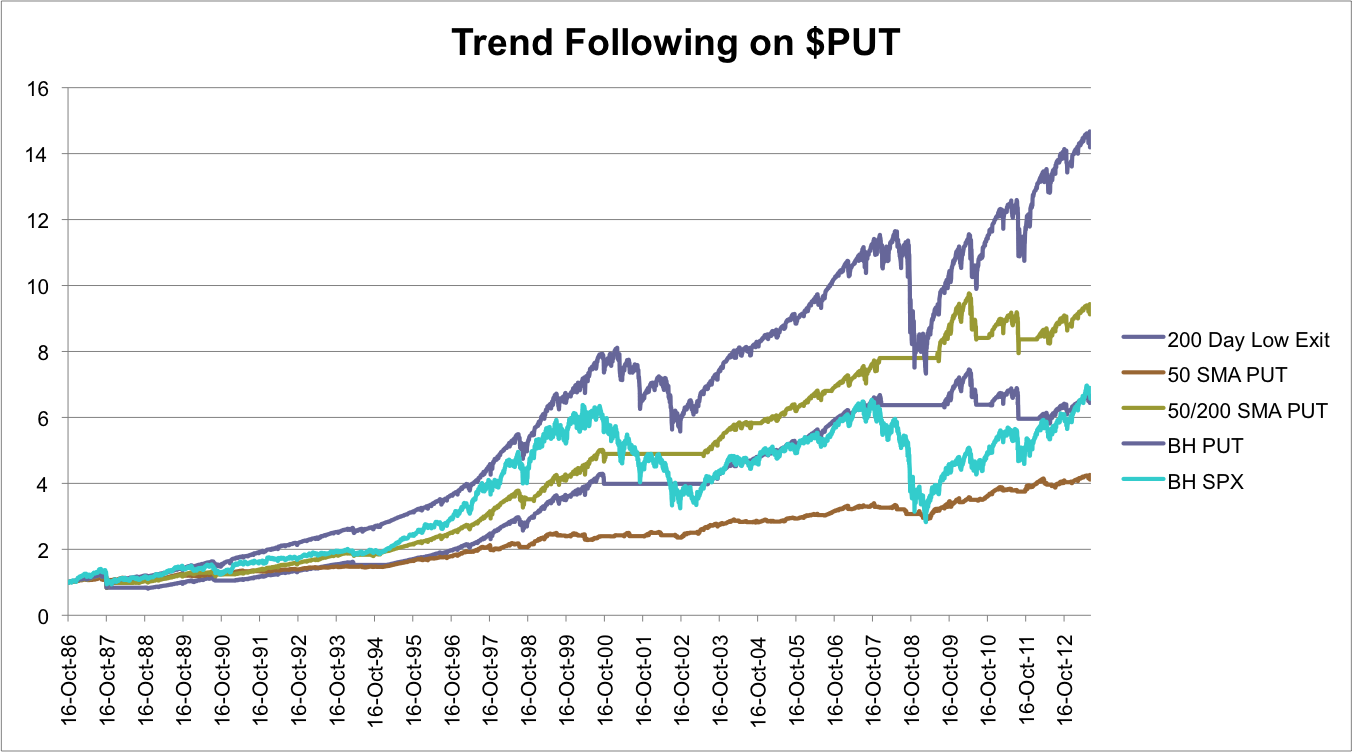
The following image shows the results from several basic trend following strategies applied to the $SPX. The strategies were intended to limit involvement in $PUT to when the S&P was in an uptrend. What’s interesting is that all of the strategies undermined returns. In looking through the data and charts it seems like $PUT tends to decline very quickly during down moves and also recover more quickly than $SPX.
Intuitively, as $SPX declines we’d expect to see a rise in implied volatility making selling puts more attractive. The irony of selling naked puts is that they have the highest potential yield when selling them seems the least desirable.
The graphic below shows some following basic trend following strategies applied to $SPX in a failed attempt to boost returns: buy and hold, buying PUT when the SPX 50/200 day moving average cross is positive, exiting PUT when SPX makes a new 200 day low, only buying PUT when SPX is above it’s 50 day SMA. None of the strategies improved returns beyond buy and hold.
The results suggest that selling puts every month and avoiding situations where the puts settle in the money might be a better strategy than attempting to time the $SPX. Also note that applying trend following filters to the $PUT index itself is like trading your equity curve.
Potential Application:
Interestingly, a Put Write Index ETF does not exist at this point. Does anyone want to collaborate on that? The potential application for a new options system would be to allocate 50% of an account to holding short term interest bearing investments and the other 50% to naked option margin. Note that if a margin account is used, the system can sell unsecured puts and potentially generate higher yields. At this point, a leveraged version of $PUT is just an idea and I have not tested that type of system to see the actual impact on returns . . . yet.
If you wanted to mimic $PUT, ETF’s like BIL and SHY would be good candidates for short term yield investments. Alternatively, a total bond fund, like AGG or BND, with a slightly higher yield could be used, but that introduces more price risk.
What I’m doing with my pTheta system is similar to the Put Write Index. pTheta sells naked options in a trend following manner and also trades a trend following trading system. The big difference between the pTheta system and PUT is that pTheta is NOT collateralized. In other words, I’m selling naked options with cash requirements that exceed the value of the account.
Guess what, this is just the first post in a series about selling puts. Want to know when the next articles are posted?

Sign up for my email list and stay up to date with the latest happenings.
Click here to sign up for the list, get a copy of the Theta Trend Options Trading System, the Trade Tacker I use, and information about new systems.
Even better . . . it’s all totally free.
What a great article Dan! Thanks for sharing! I didn’t know about the existence of this $PUT startegy.
Hey, thanks Henrik. I think there are a lot of possibilities and ways to build a similar index. At the end of the day, it seems like the index is just trying to generate income. A put selling strategy overlaid on your dividend growth stocks would be interesting as well. Thanks for the feedback.
Excellent article Dan. I’ve been following the exact same strategy except the cash requirements of settlement if the index were to fall to zero is 3x higher than the cash reserves I have, i.e. ‘leveraged’ by a factor of three. It’s been working fantastically so far on the ASX200.
It would be AWESOME if you could test the above strategy on the SP500 and post back.
Hi Dan! Very interesting article. The exponential graphs perplex me because they suggest a growing position size. A consequence of changing position size is distorted drawdowns. For example, that 1987 drawdown looks minuscule in [the first graph in] comparison to 2001-2 or 2008-9. I’d like to see an apples-to-apples comparison. Can you redo the graph with fixed position size?
One other question: why do you say the trend-following filters are a failed attempt to boost returns when two of them appear to far outpace B&H? Thanks!
Hey Mark,
Maybe you’re wanting the images to have a Log scale. Unfortunately, I can’t seem to find the excel file where I did this analysis (2 years ago and a new computer) so I’d need to recreate everything.
In the graphs above, the position is fixed. We’re looking at a one dollar initial investment. To that $1 I’m applying the daily percentage change in the index. Doing that mirrors what would happen if you bought the index on the first day. All the graphs above really do is re-index the indexes to $1 instead of their initial values. That makes it easier to compare indexes with different starting prices.
For example, say we have the following sequence of changes:
Day 0 = Buy
Day 1 = +10% (obviously this is an exaggeration)
Day 2 = -5%
Day 3 = +3%
Note that the percentage changes are measured relative to the previous day.
Let’s say we’re looking at 10k instead because it’s just easier.
Day 0 = 10k
Day 1 = 11,000
Day 2 = 10,450
Day 3 = 10,763.50
Thanks for the email and I’m glad you were able to get the Trend Following question figured out. I’ll follow up with you via email.
Dan
Hey Dan, how’s SMA filtered PUT strategies been looking since 2012?
HI, you know I haven’t tracked or updated the strategies in a while so I’m not totally sure. Based on the market in 2014-2015, my guess is that the strategies performed well. At the same time, we’d need to pull the data from the CBOE and re-run the analysis to know for sure.
But now there is a put write strategy! It’s PUTW.