There’s Something In the Way She Moves – Evaluating Russell 2000 Monthly Ranges $RUT
The first two months of 2016 have been challenging for many non-directional options traders. In January the markets steadily sold off while this February we’ve seen large percentage moves both higher and lower. When the market makes big moves it’s easy to get caught up in our emotions and say things like the market has gone “too far” or moved “too much.” The reality is that we have no control over how much the market moves and it frequently moves much more than “it should” . . . whatever that means.
While there’s a good amount of attention paid to returns in the indexes, as non-directional traders, our ability to make money is largely related to the ranges as well. Intuitively, if we sell premium around some range or move our pocket of decay to follow the market, the distance the market travels will have a direct impact on our trades.
This post takes a look at monthly percentage ranges in the Russell 2000 Index. The goal in evaluating the ranges is to get an idea of the amount the market moves on average. Understanding an average move can give us insight when we’re structuring and adjusting our positions.
Data and Assumptions:
This discussion uses Russell 2000 ($RUT) monthly price data from Yahoo Finance. The data covers October 1987 – present and February 2016 is included in the charts below even though the month isn’t over yet.
Ranges are defined as the monthly high minus the monthly low. To normalize the data into percentages, the range (high – low) is divided by the monthly open value of the index.
Positive and negative range values are based on the current month close relative to the prior month close. If the current month close value is less than the prior month close value, the range for that month is negative. Conversely, the range is assigned a positive value if the current month close value is higher than the prior month close.
Ranges by Date:
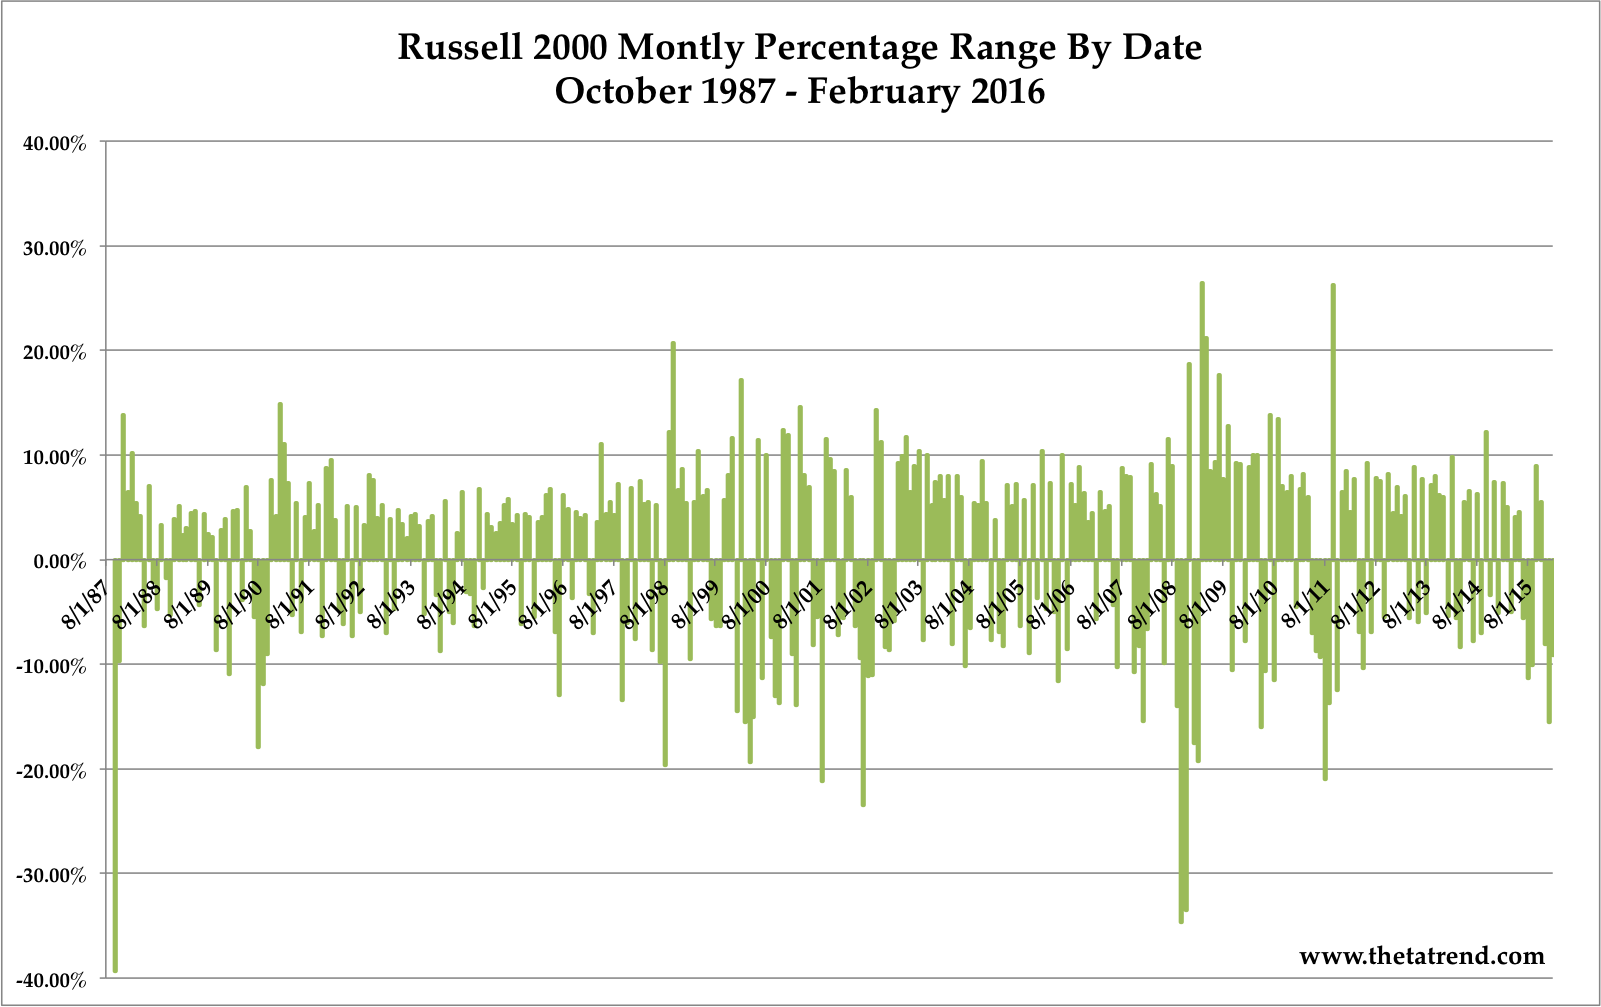
The following image displays the percentage ranges for the Russell 2000 from October 1987 through February 2016. One of the more interesting observations is that large negative ranges seem to be followed relatively closely by large positive ranges. That behavior suggests that the Russell can move sharply out of large declines.
The large percentage ranges in 2008 were the largest since 1987. The January 2016 and February 2016 ranges are relatively typical in comparison.
Frequency of Returns:
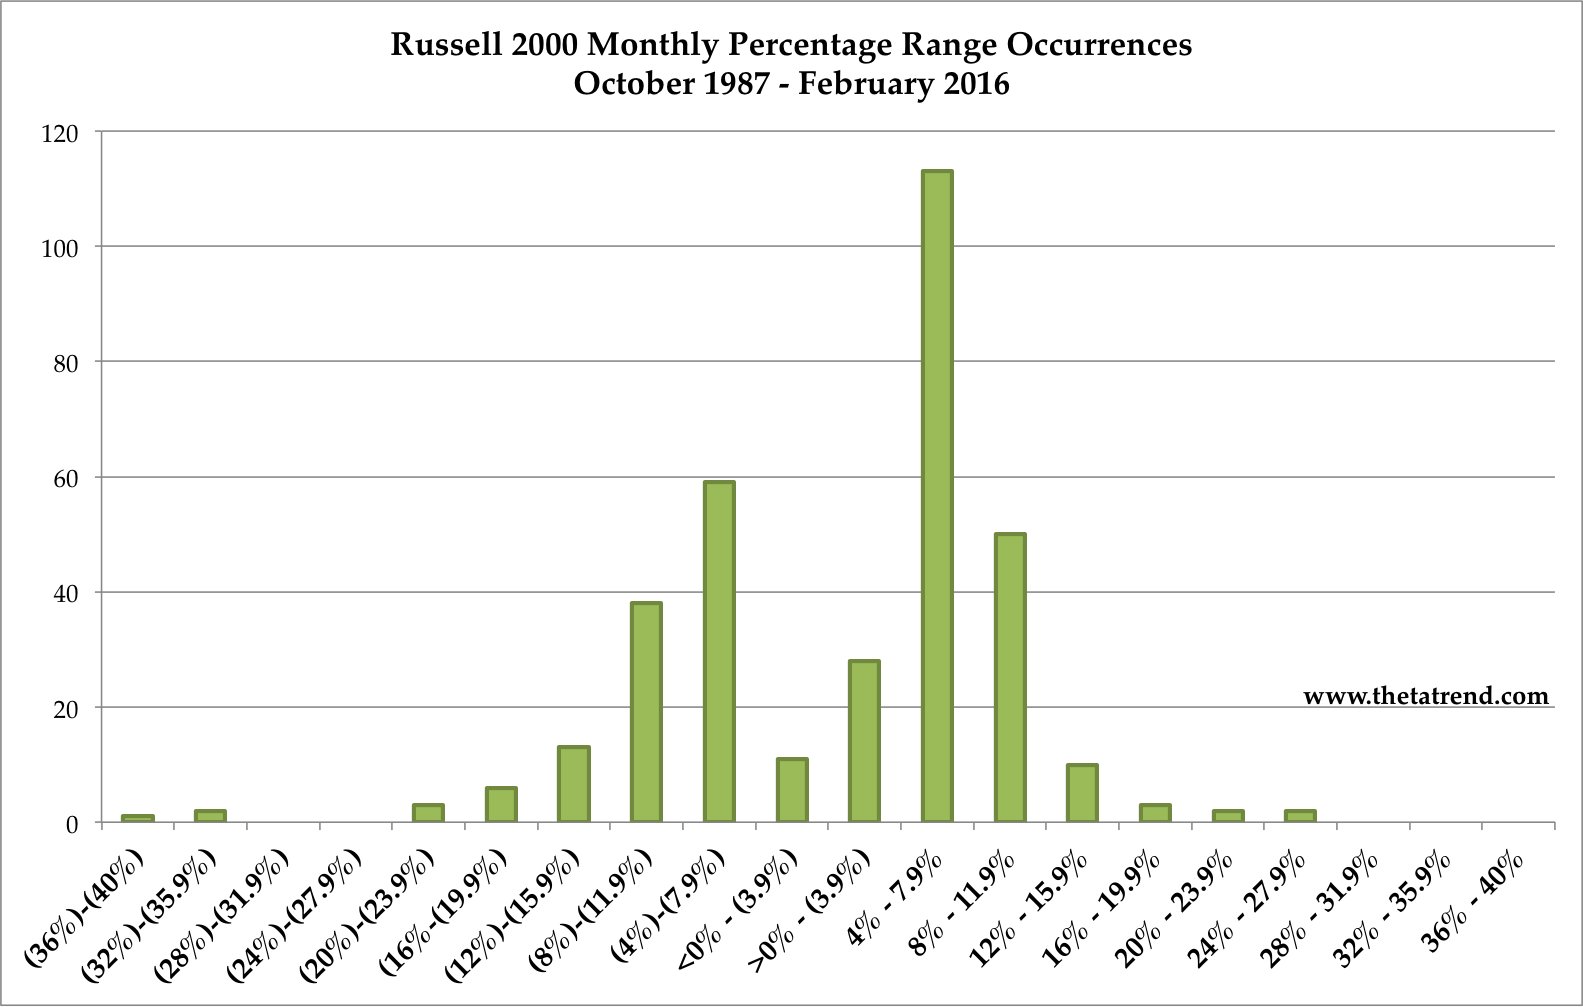
The next image is a frequency distribution for the range percentages. What’s extremely interesting about the distribution is the relative low number of ranges in the 0% to -4% bin. The range count is less than half as many as in the 0% to +4% and far fewer than the -4% to -8% count. The big take away is that if the range is negative, we can assume that the range is going to be larger than 4%. Intuitively, that makes sense because we expect the range to expand on down moves.
Another key take away is that most of the time we can expect a range greater than 4% regardless of whether the range is positive or negative.
Averages:
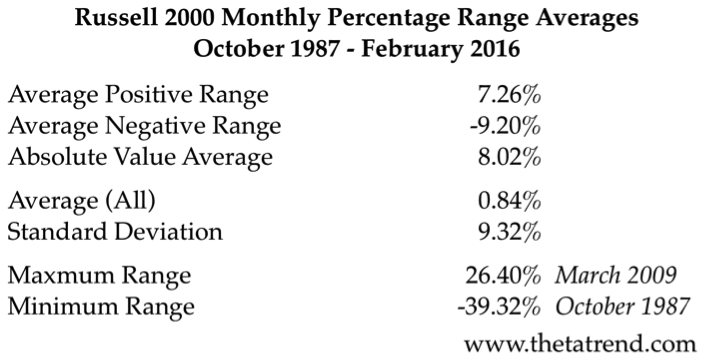
The table below summarizes some of the key averages for the Russell 2000 percentage ranges.
The average positive range only looks at months with a positive range while the average negative range only looks at months with a negative range. The absolute value average comes in right between the positive and negative averages.
The raw average for all returns is slightly positive at 0.84% with a standard deviation of 9.32%. In other words, a typical month should have a percentage range of under 9%. On up months the range might be slightly less and on down months the rage might be slightly greater, but a 9% range is fairly typical.
Trading Implications:
Since our focus is on non-directional options income strategies, knowing how far the market can travel (or range) is useful. We can both structure our trades around a typical range and adjust positions to widen the range.
A butterfly strategy like the CIB generally begins with 50 point legs meaning the long strikes are 100 points apart. With the Russell trading around 1,000 that means that the long legs effectively span the typical monthly range of 9%. The position changes and moves with the market, but the general structure is a good starting point from a range perspective. Other Butterfly configurations, namely Broken Wing Butterflies, have an extremely wide profit zone that provide an even wider range.
The posts below provide information on the range of profit for various options trades, which are even more meaningful when you have an idea of how much the market typically ranges.
Related Reading:
Range of Profit on Things With Wings: A Look At $RUT Iron Condors and Butterflies
The Shocking Range of Profit on Butterflies – Analysis of Broken Wing Butterfly Option Trades
Want to receive an alert when new content on options trading is posted? Sign up below and we’ll keep you in the loop.

Sign up for my email list and stay up to date with the latest information on options trading.
Click here to sign up for the list, get a copy of the Theta Trend Options Trading System, the Trade Tacker I use, and information about new systems.
Even better . . . it’s all totally free.