IWM Put Butterfly Update and Market Commentary
Big Picture:
Last weekend I was away from home and didn’t get a chance to write the market commentary. Incidentally, I was visiting New York and had a chance to see the New York Stock Exchange, which was really cool. At any rate, the equity markets have been extremely strong for the past two weeks. That strength put a lot of pressure on my IWM Put Butterfly, which has been adjusted a few times now. There’s a video below that walks through the current position and the adjustments to bring you up to speed.
In the past week, I make a job change and am now working at a new accounting firm. The reason the change is relevant is that I no longer have the flexibility to get into my trading software during the day. However, that won’t stop me from trading. The big difference is that now I’m able to watch the first hour and a half of trading every morning and can place trades during that time. As a result, I’m going to be adjusting when and how I trade slightly. The system most impacted by the change is the breakout system because I can’t always enter trades when we get to a new high. That change isn’t as significant for Forex because I tend to leave GTC orders in the market without concern, but it does change things for the ETF’s. I had a few fairly unfortunate fills using GTC orders for ETF’s and, as a result, I don’t like to leave orders in the market. We’ll see what changes as we go forward, but the general idea is that I’m going to be making adjustments based on closing prices rather than intraday fluctuations.
Implied Volatility:
Implied volatility came off a little bit this week and is down significantly over the past two weeks.
The Weekly Stats:
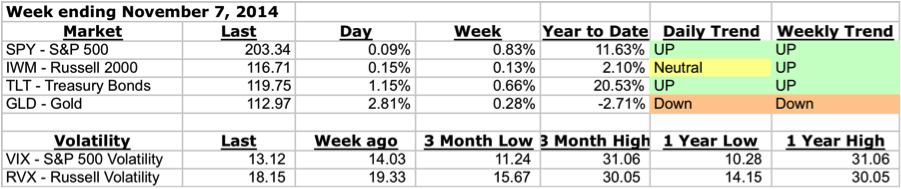
A note about trend . . . Trend on the daily timeframe is defined using Donchian channels and an Average True Range Trailing Stop. There are three trend states on the Daily timeframe: up, neutral, and down. On the weekly timeframe, I’m looking at Parabolic SAR to define trend and there are two trend states, up and down. In reality, there are always periods of chop and I’m using the indicator to capture the general bias of both the trend and those periods of chop.
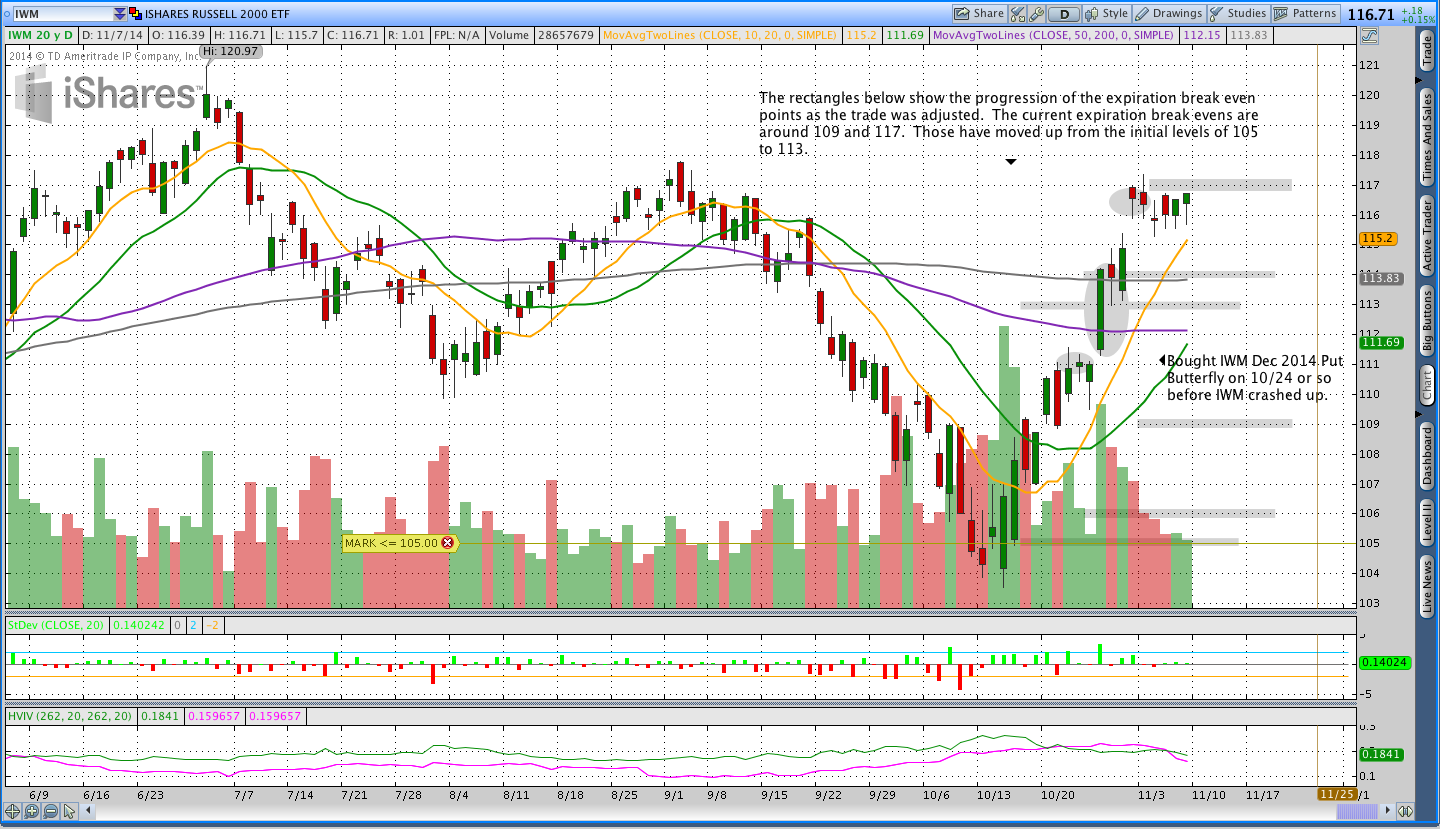
IWM December 2014 Put Butterfly Update:
A couple of weeks ago when IWM was trading around 110.50, I bought a December 2014 104/109/114 Put Butterfly. My thinking at the time was that the Russell 2000 had made a pretty good run higher and was coming into a potential area of resistance around the 50 and 200 day moving averages. Additionally, the 50 day was below the 200 day and the general mood was more bearish than bullish. Guess what . . . I was totally wrong and IWM went from 110.50 to an intraday high around 117 within the first week of the trade. As IWM moved higher, I added the 111 Put Butterfly, then the 113 Put Butterfly, and finally rolled the 109 Butterfly to 115. What I’m left with now is the 111, 113, and 115 Put Flys. Each Butterfly has 5 point strikes.
Last week, the second week of the trade, IWM stabilized a little bit and that helped the position. Fortunately the December 2014 options are down to 40 days to expiration and, at least for now, I have IWM trapped inside the expiration break evens of my position.
Below there are two images and a YouTube video to explain the current position. IWM is a little bastard that can really run.
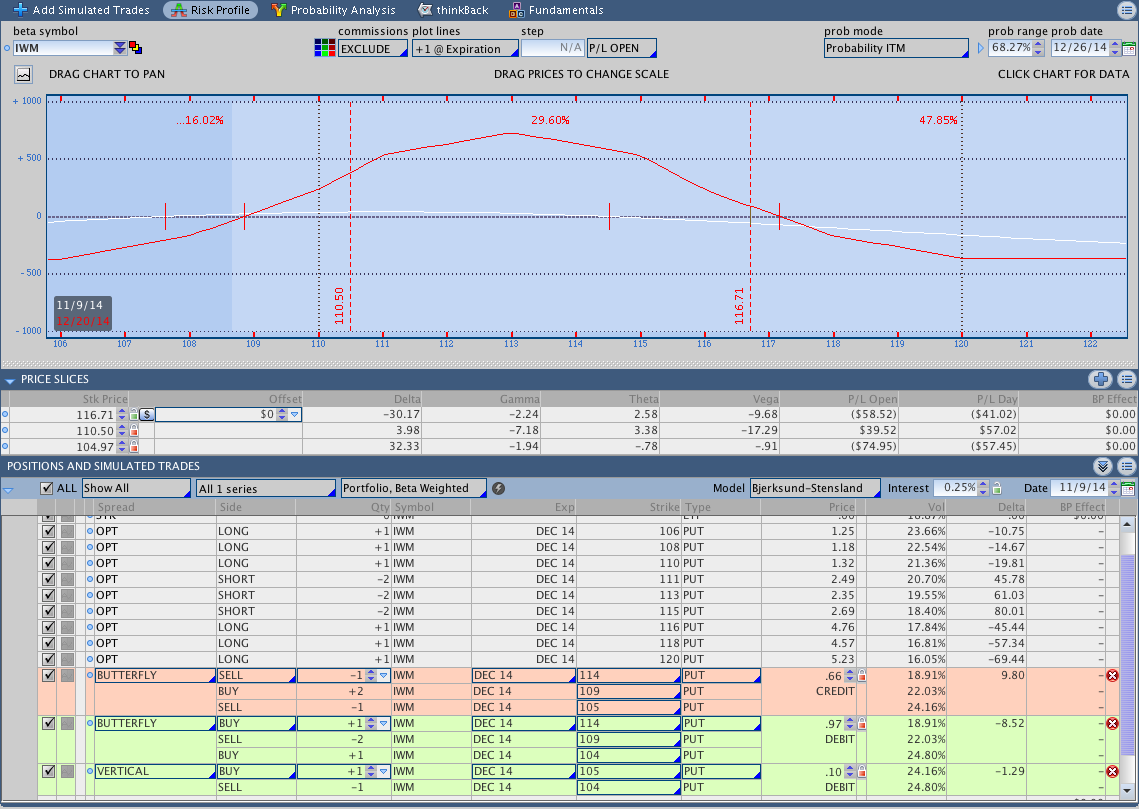
Here’s a video of the Butterfly:
Breakout System Market Stats:
In the interest of time, I won’t be discussing the Breakout system this week. I am still short EUR/USD and long USD/CHF. I am also long USD/JPY.
Trades This Week:
None
Option Inventory:
IWM – Dec 2014 106/111/116 Put Butterfly (bought for 1.03)
IWM – Dec 2014 104/113/114 Put Butterfly (bought for 1.05)
IWM – Dec 2014 109/115/119 Put Butterfly (bought for 1.17)
ETF & Forex Inventory:
EUR/USD – Short 5,000 notional units from 1.35028
USD/CHF – Long 6,000 notional units from .9037
USD/JPY – Long 2,000 notional units from 110.084
Looking ahead:
My biggest concern right now is the IWM Butterfly. If equities continue higher this week I’ll be forced make another adjustment, which I really don’t want to do. My hope is that prices will settle down or pull back a little bit, but I can’t control that so we’ll just see what happens.
While I haven’t had a chance to write about it yet, I’m into the second month of “investing” with a rotation system. The system is a commission free ETF version of the system described in the Ivy Portfolio book and is easy to execute because new positions are only taken on a monthly basis. I hope to get some content out about that system soon.
If you enjoyed this post, please click above to like it on Facebook or Tweet it out. As always, thanks for reading and enjoy the rest of your weekend.
Want to receive an alert as soon as the next market commentary is posted?

Sign up for my email list and stay up to date with the latest information on options trading and trend following.
Click here to sign up for the list, get a copy of the Theta Trend Options Trading System, the Trade Tacker I use, and information about new systems.
Even better . . . it’s all totally free.