Weekend Market Commentary ($IWM, $SPY, $GLD, $TLT, $IYR) – 12/12/14
Big Picture:
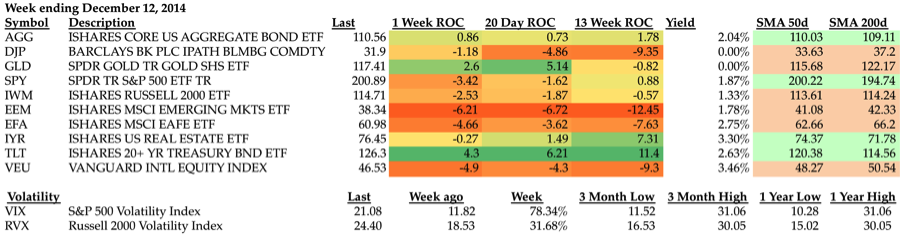
Last week I mentioned that U.S. Stocks were grinding higher, but other markets around the world were making big moves (generally lower). This week the S&P 500 took a hit and the $VIX surged 78%. The sell off hit both the S&P 500 and the Russell 2000, but the Russell held up better. Gold had a good week, but the major winner was the long term U.S. Treasury Bond ($TLT). It’s definitely worth noting that $TLT is now up over 27% Year to Date. How many people would have said they wanted to be long U.S. Long Dated Bonds at the start of 2014? My guess is very few and this should be another reminder that the market can, and does, do whatever it wants.
Emerging Markets continued to lead the way down for risk assets this week. The media is telling us that Emerging Markets are struggling because of Oil and I suppose that seems somewhat reasonable. At the end of the day, what matters is that we’re seeing broad selling across all risk assets, a strong dollar, strengthening in Gold, and a surge in U.S. Government Bonds. If that statement didn’t make it clear, it sounds like there’s trouble in the world. My feeling is that something bad is on the horizon and I don’t know when or what, but I’m keeping a close eye on price action as we move into the end of the year.
In other cool news, Abnormal Returns picked up my post on Bonds this week!
The Weekly Stats:
Implied Volatility:
Implied Volatility in the S&P 500 has reacted much more to the down move than the $RVX. Both the $VIX and the $RVX are moving closer to the upper part of their one year ranges.
Technical Analysis:
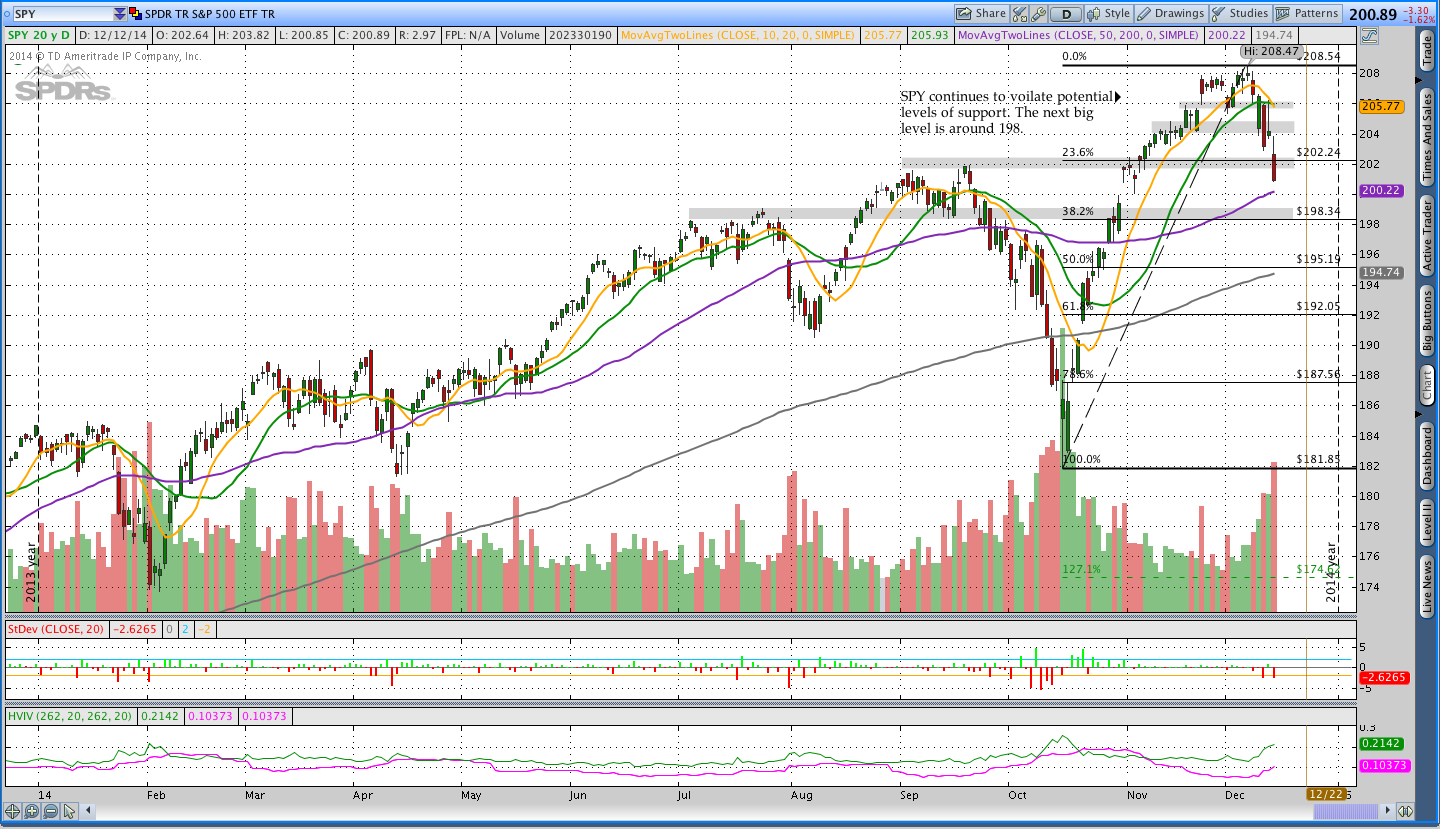
In the chart below we see $SPY taking out multiple levels of potential support. This is the reason support levels are always “potential.” We never know where the market will find support, but we can say that there are areas where it has the potential to find support. If we continue lower, the next area of potential support is around 198 and that also corresponds to a 38.2% retracement of the recent move from the October low.
Open Trades:
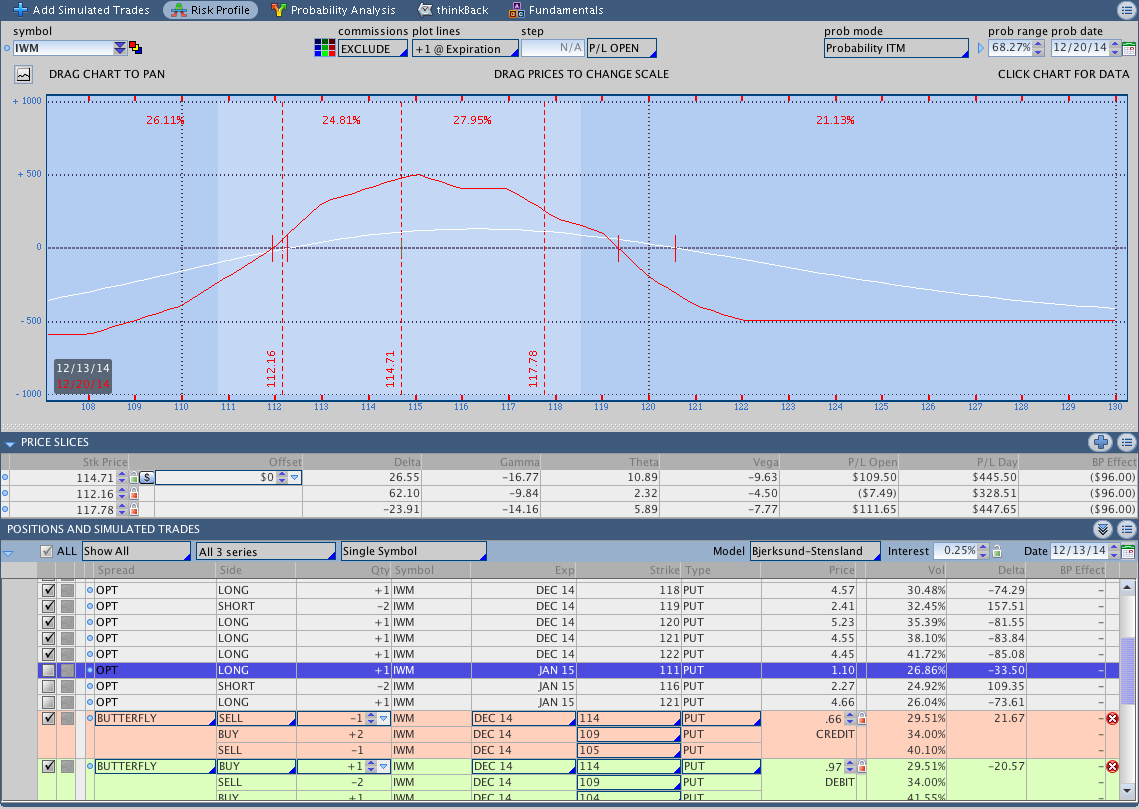
$IWM December 2014 Put Butterfly Update:
Things are finally starting to go a little more smoothly for the December Butterfly. On Thursday when the Russell 2000 was racing higher, I decided to buy a long call to hedge the upside. The following morning $IWM gapped lower and sold off so I sold the call. That hedge cost me some money and that hurt the position a little bit, but it was a good learning experience.
I closed part of the trade yesterday (Friday) and I decided to hold it over the weekend . . . we’ll see if that was the right choice or not. My goal is to get out of the trade by Wednesday. After I close out the Butterfly, I’ll be posting a full analysis of the trade. An updated picture of the position, including all adjustments, is shown below.
In case you missed it, I put up a video yesterday to discuss an expiration week adjustment that I used. The adjustment both closed part of the trade and reduced downside risk.
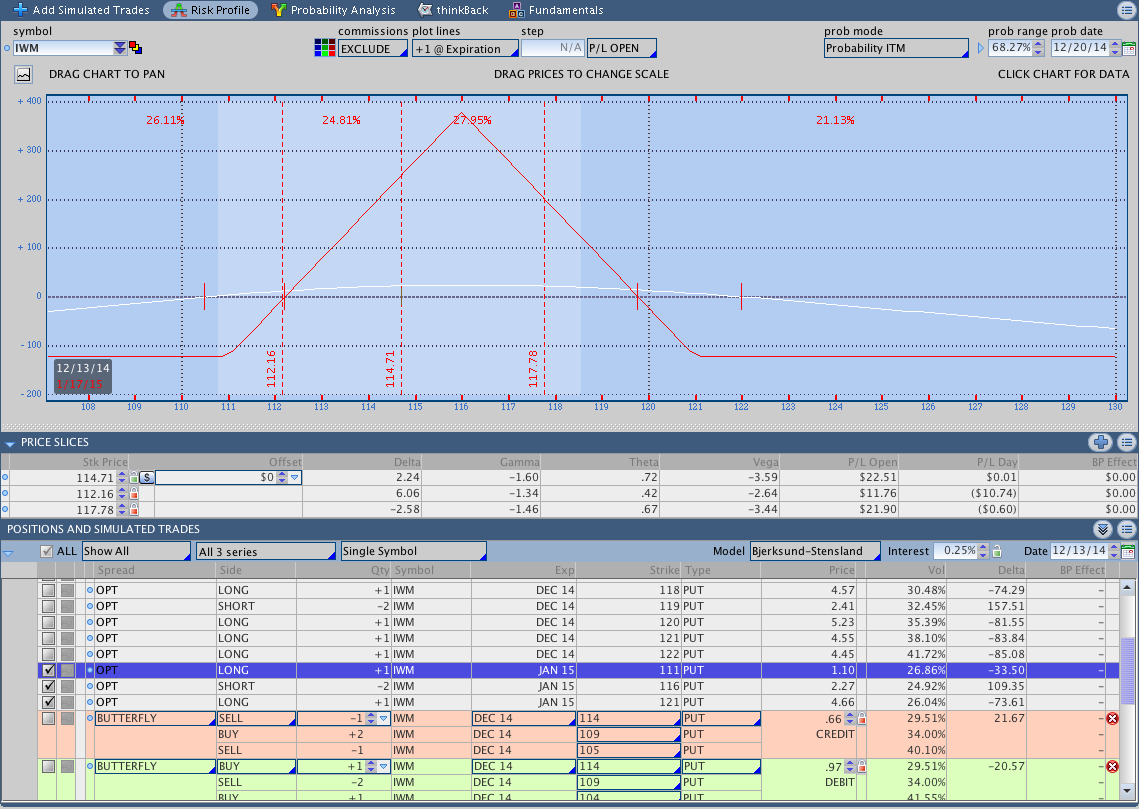
$IWM January 2015 Put Butterfly
Yeah, it still goes without saying that the January trade has been much easier than the December position. At this point, my only criticism of myself or the trade is that I should have added to the position. That being said, I’m still learning about and getting the feel for trading Butterflies so I’ll cut myself a little slack. A picture of the current position is shown below.
pTheta Open Position and Trade Watch:
Last week I was short a $SPY January 2015 186 put. I covered that put this week because $SPY was selling off and, more importantly, $VIX was surging. I had the sense that the move in the $VIX was saying something more than the $SPY price move was telling us and I decided to get out with a very small profit. I’m glad I closed the trade.
Last Sunday I posted a video that went over a naked put sale in Gold ($GLD). I was filled on a February 2015 101 Put for a .50 credit and the trade has been smooth sailing so far. I have a GTC order in to close the trade for a .20 debit.
ETF Rotation Systems:
I have two rotation systems running right now. One is the Schwab Commission Free ETF Rotation System and the other is a Basic ETF Rotation System using similar markets in my TOS account. The Schwab Rotation System is currently long $TLO (Long Bond) and $SCHH (Real Estate). The Basic ETF Rotation System is long $SPY and $IYR (Real Estate). It goes without saying that the Schwab Rotation System is doing significantly better this month than the Basic System.
As a reminder, I put up some new pages to track the ETF Rotation systems. I’m in the process of putting together a trading plan for 2015 and I’m hoping to have some information out about that soon. The 2014 equity allocation is no longer accurate, but I’m not ready to disclose the 2015 allocation just yet. Check out the following pages if you haven’t already:
Schwab Commission Free ETF Rotation System Results
Forex Breakout System:
This week we saw the Dollar lose a little ground against most of the majors, but all of the Forex trades are still open.
Trades This Week:
GLD – Sold to Open February 2015 101 Put for a .50 credit
SPY – Bought to Close January 2015 186 Put for a .60 debit
IWM – Bought to Open and Sold to Close February 2015 120 Call (2.48 open, 1.92 close)
IWM – Sold to Close 106/113/116 Put Butterfly for a .33 Credit
Note that the December Butterflies in the inventory below are not completely up to date due to adjustments. I’ll have a full recap on the position once everything is closed out.
Option Inventory:
IWM – Jan 2014 111/116/121 Put Butterfly (bought for 1.22)
IWM – Dec 2014 106/111/116 Put Butterfly (bought for 1.03) (the 111’s were rolled to 113 this is partially closed)
IWM – Dec 2014 104/113/114 Put Butterfly (bought for 1.05)
IWM – Dec 2014 109/115/119 Put Butterfly (bought for 1.17) (one of the 115’s is covered now)
IWM – Dec 2014 112/117/121 Put Butterfly (bought for .85)
IWM – Dec 2014 115/119/122 Put Butterfly (bought for .63)
GLD – Short Feb 2015 101 Put (sold for .50)
ETF & Forex Inventory:
SPY – Long 12 Shares from 207.38
IYR – Long 32 Shares from 76.7699
EUR/USD – Short 5,000 notional units from 1.35028
USD/CHF – Long 6,000 notional units from .9037
USD/JPY – Long 2,000 notional units from 110.084
NZD/JPY – Long 2,000 notional units from 89.036
Looking ahead:
As I mentioned above, I don’t think the markets are happy right now. It’s December Options expiration on Friday and I’m going to be getting out of the December $IWM Butterfly. I have some things cooking for 2015 that I’ll be sharing soon so keep a close eye on the blog. If you’re interested in trading options with a small account, you’ll definitely be interested in what’s coming up. Have a great weekend.
If you enjoyed this post, please click above to share it on Facebook or Tweet it out. Thanks for reading!
Want to receive an alert as soon as the next market commentary is posted?

Sign up for my email list and stay up to date with the latest information on options trading and trend following.
Click here to sign up for the list, get a copy of the Theta Trend Options Trading System, the Trade Tacker I use, and information about new systems.
Even better . . . it’s all totally free.