Weekend Market Commentary 5/20/2016 – $SPX, $RUT, $VIX, $VXV
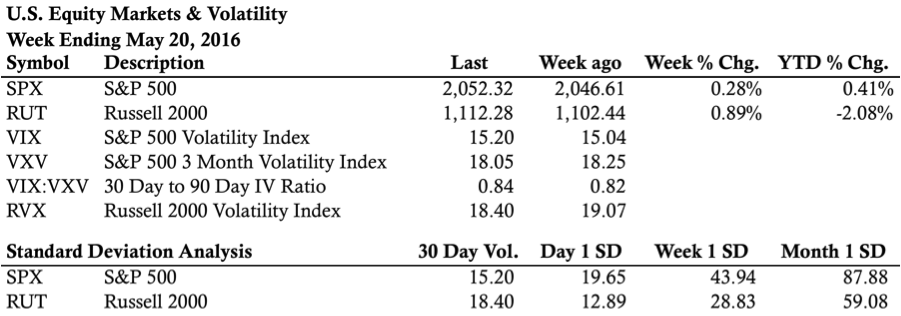
Market Stats:
Big Picture:
I’d like to tell you that everything matters. The reality is that at least 99% doesn’t and I’m open to debating the merits of that remaining 1%. The challenge is that we never know what matters in advance and by the time we do know it’s usually too late.
The markets are like a big riddle. Sometimes what we think matters doesn’t matter and what we think doesn’t matter does matter. Ultimately we don’t know what matters until after the fact, but many participants spend a hell of a lot of time trying to understand what matters by worrying about news, announcements, technical indicators, and a host of other things. As far as trading is concerned, what really matters is us.
We all know markets can move up, down, or sideways. Investors generally want markets (and especially equity markets) to move higher. Over time that’s served investors well. The challenge in trading is not that markets don’t move up over time, it’s that the timeframe is much shorter. Consequently, shorter term swings have the potential to create challenges for positions. In trading, what matters is our ability to adapt to shorter term changes. However, even more important than the system is our ability to avoid taking the short term drama too personally. Conceptually that’s easy . . . in reality it’s harder and takes some time to learn.
In looking at the charts this morning, I see mostly nothing. I’m indifferent, agnostic about direction, or whatever you want to call it. The market has been whipping about since early 2015 without much follow through in either direction and we’ll all know what happens after the fact. Despite the limited directional progress, the wide range with a path to nowhere has been challenging for non-directional traders and many have experienced drawdowns this year.
The initial (maybe it’s just human) reaction many traders have when a strategy has a drawdown is to switch what they’re doing. What seems like a little pain in backtesting can seem like unreasonable hell when your account is red. Ironically, as soon as a trader changes their strategy the market is likely to begin rewarding the old strategy.
In reality, I have never tested a strategy that doesn’t have losing trades and drawdowns. In other words, the vertical equity curve is elusive. Knowing that all strategies have drawdowns is one thing . . . accepting it is another. Additionally, accepting drawdowns when you’re in the middle of one is far different than accepting drawdowns when things are going well or you’re backtesting.
On an account level basis, I went into the weekend sitting near break even for the year. That outcome has been challenging to create, but it has nothing to do with my trading as much as the environment. That outcome only came about because I accepted the drawdown and continued following the system. Sure, I could have done a few things better in hindsight, but that’s just trading. I accept the outcome and I’ll keep looking for opportunities to improve.
I could tell you that no strategy works 100% of the time, but I’ll spare you the cliche crap this morning. All of you “know” that, but I’d venture to guess that not all of you have truly accepted it. Have you?
Volatility:
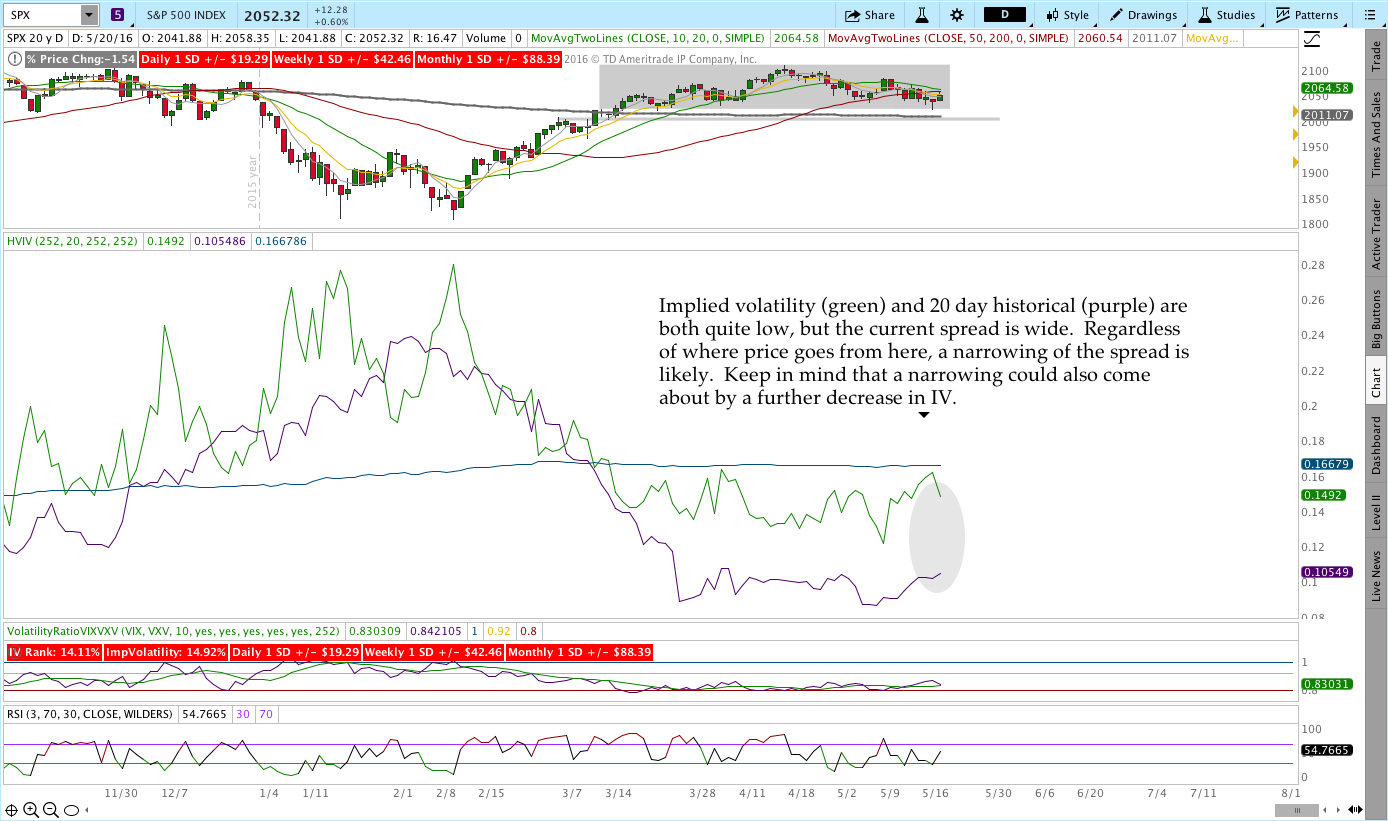
Volatility isn’t telling us much right now other than there’s not a lot of panic. Implied Volatility is quite high relative to 20 day Historical Volatility and both are considerably lower than longer term Historical Volatility. The message . . . things are quiet.
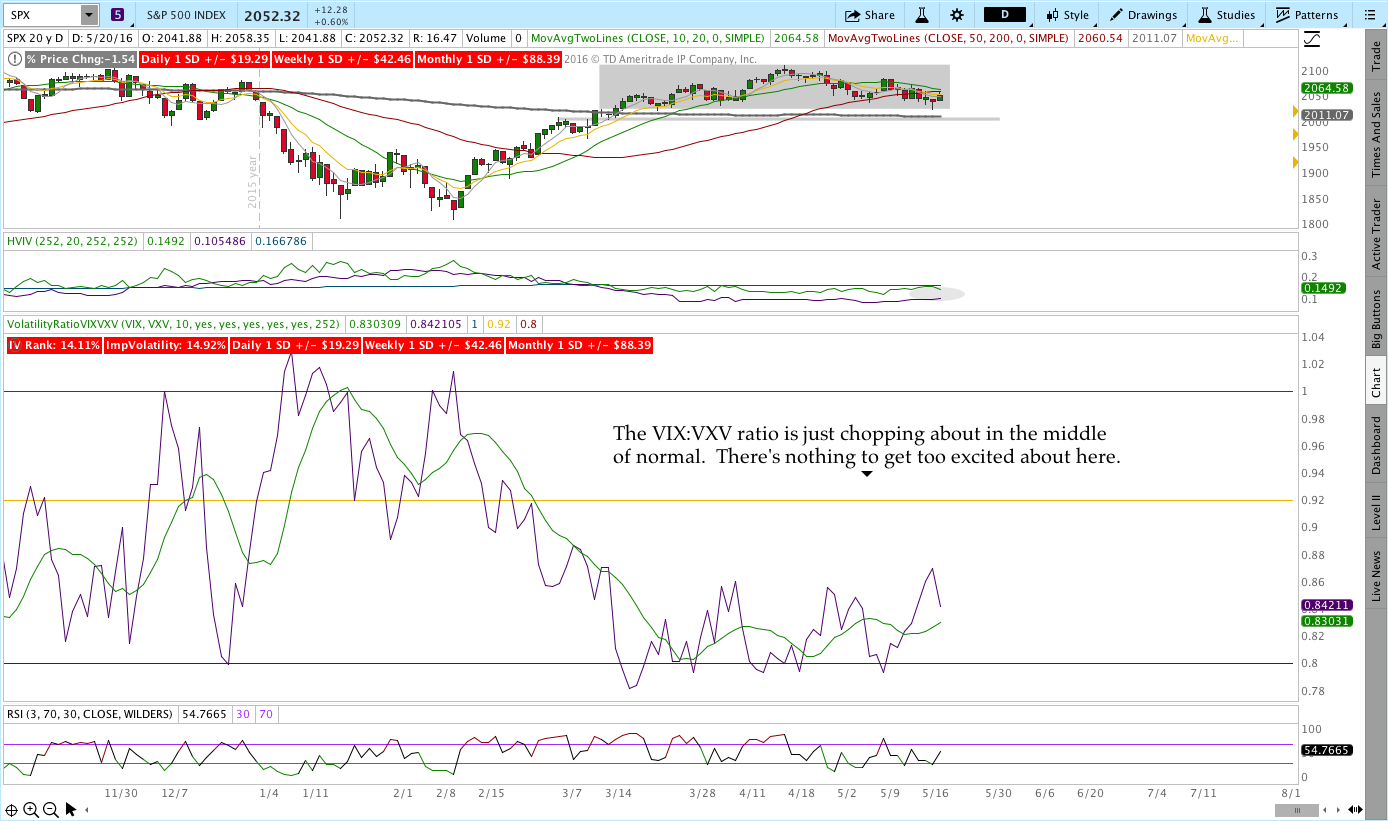
The VIX:VXV ratio is just chopping about in the realm of normal.
Levels of Interest:
In the levels of interest section, we’re drilling down through some timeframes to see what’s happening in the markets. The analysis begins on a monthly chart, then weekly chart, moves to a daily chart, and finishes with the intraday, 65 minute chart of the S&P 500 (SPX)). Multiple timeframes from a high level create context for what’s happening in the market.
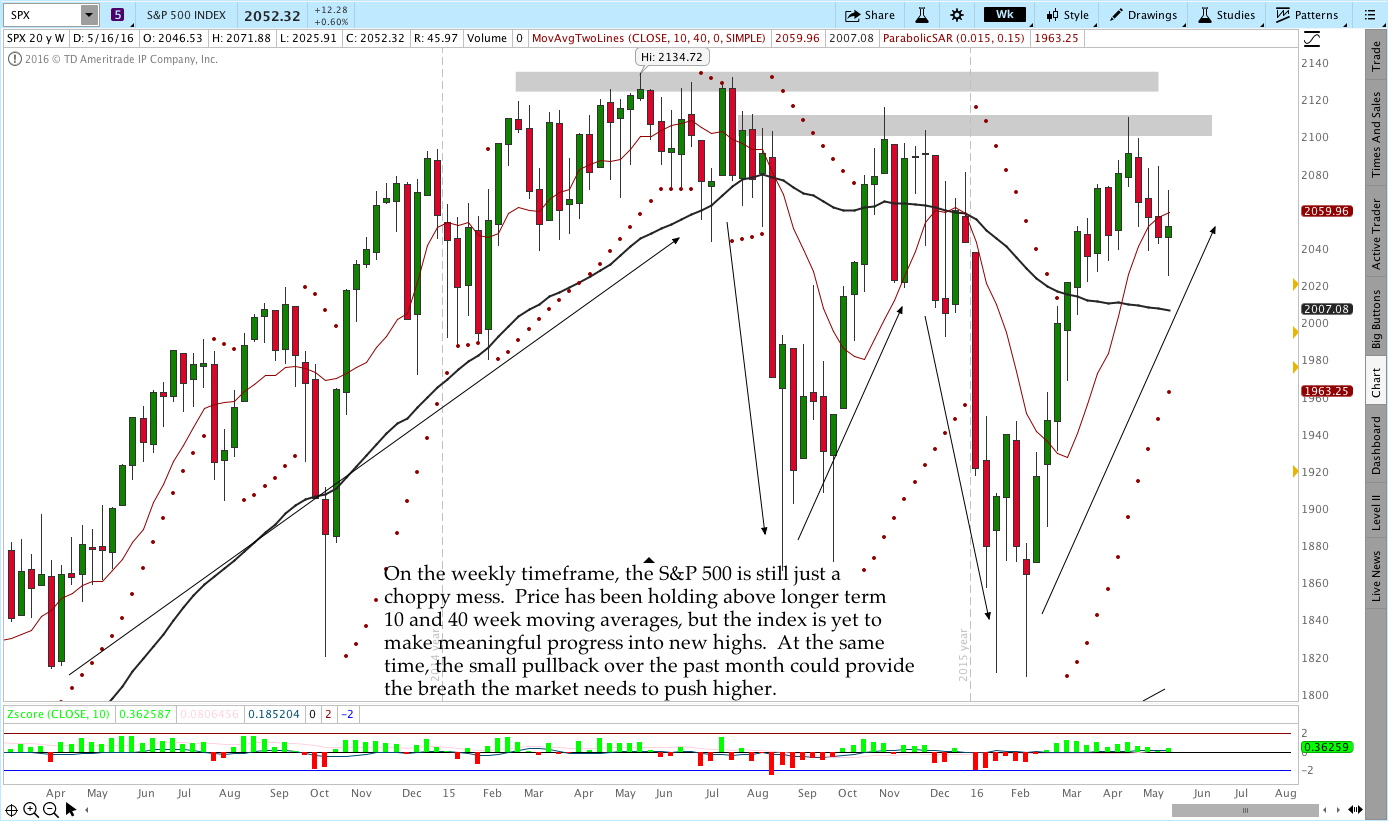
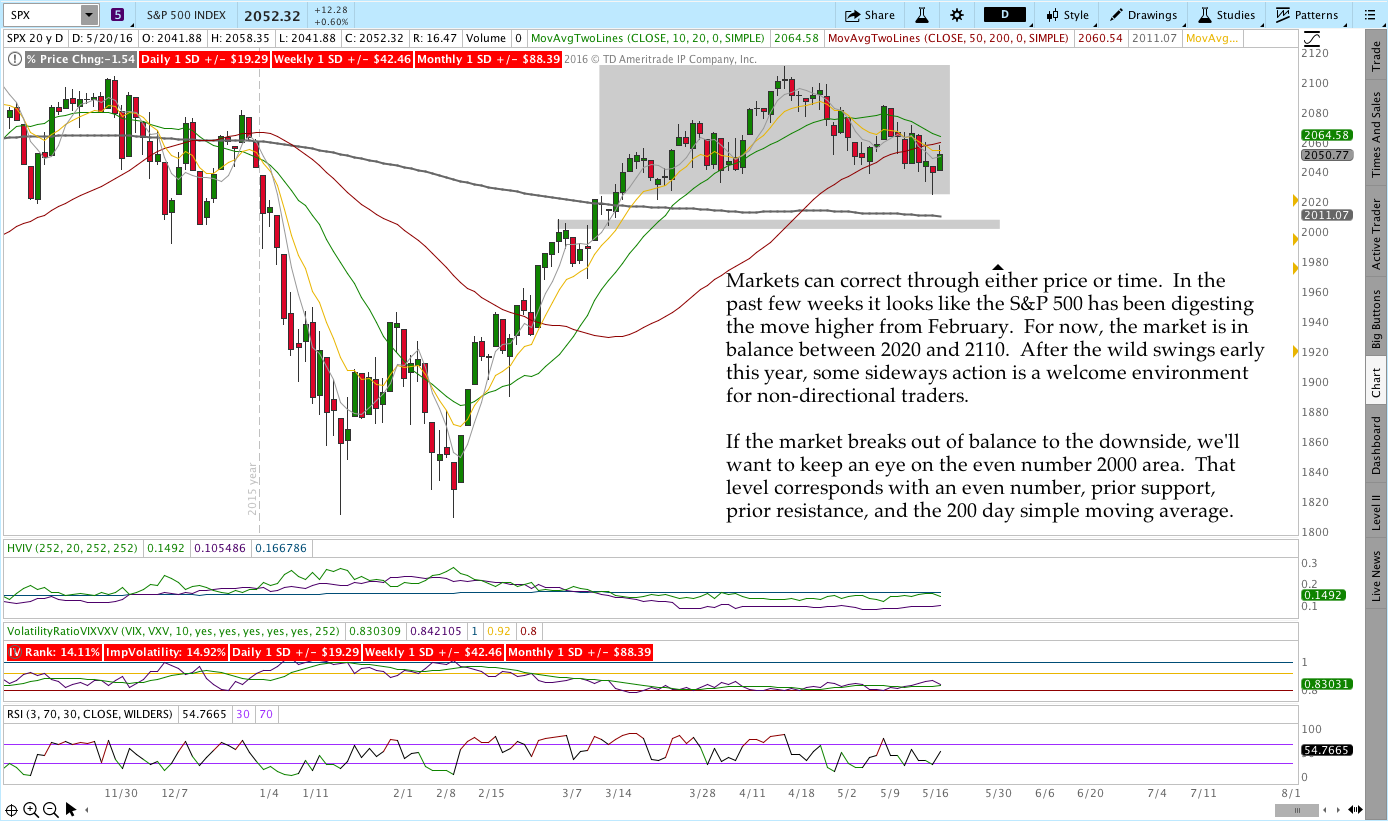
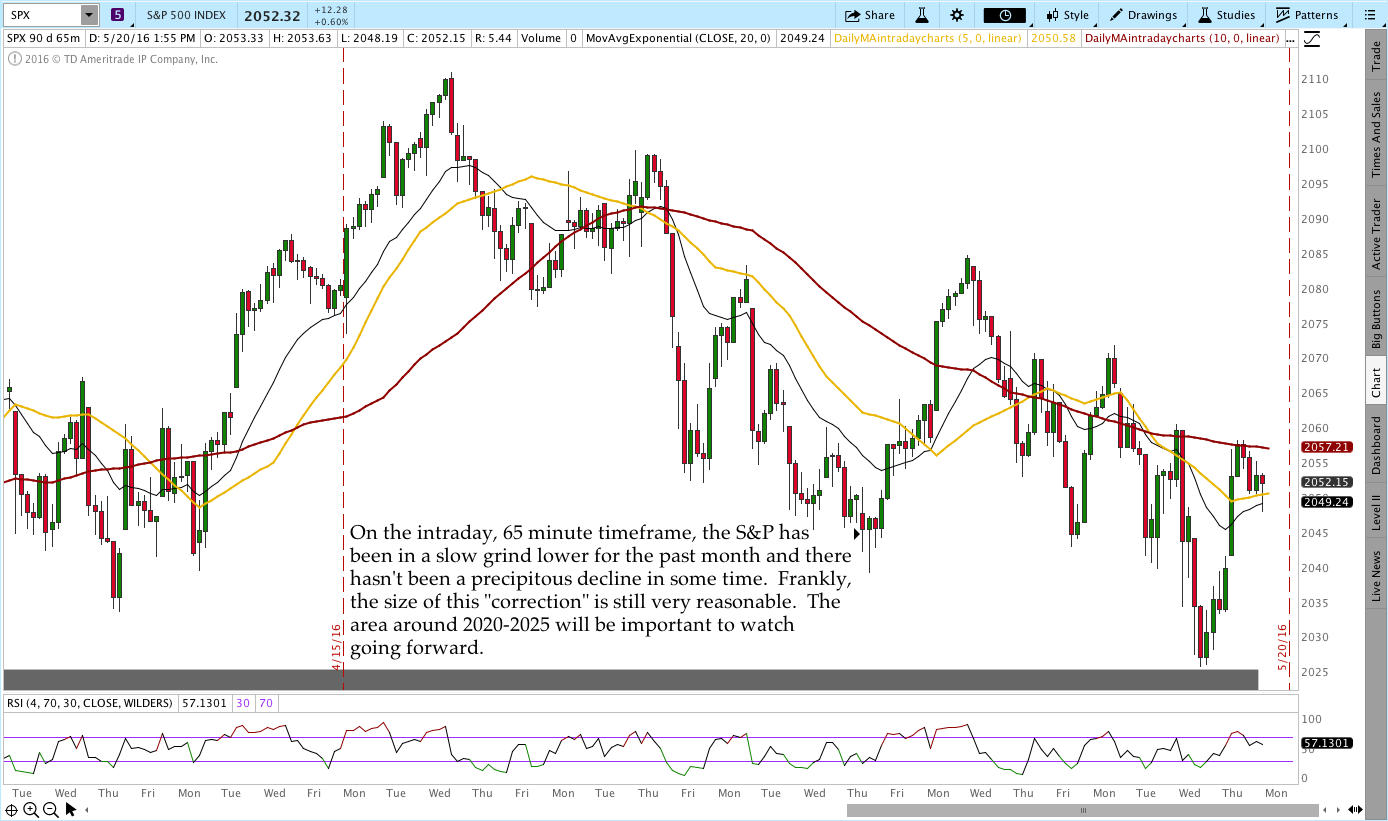
S&P 500 – $SPX (Weekly, Daily, and 65 Minute Charts):
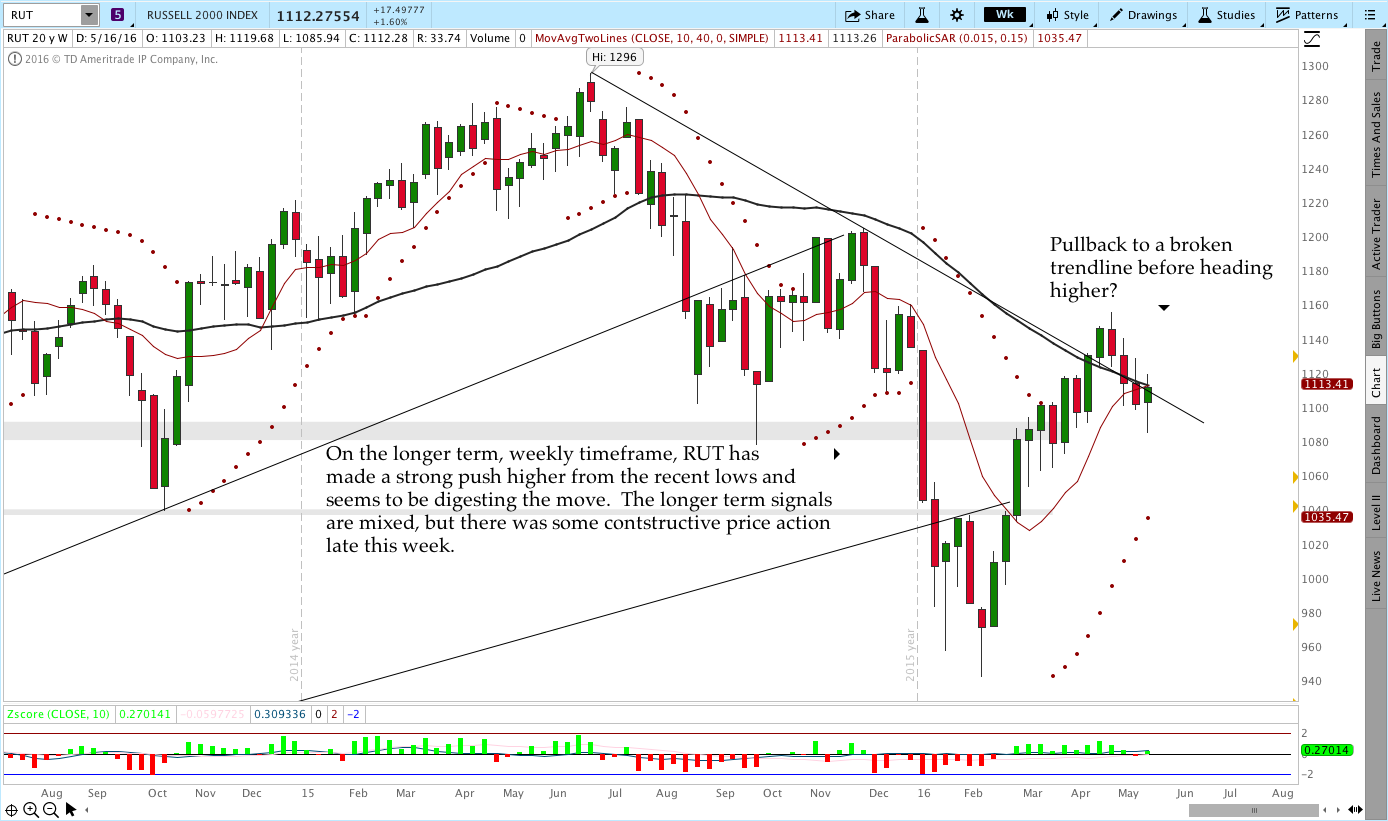
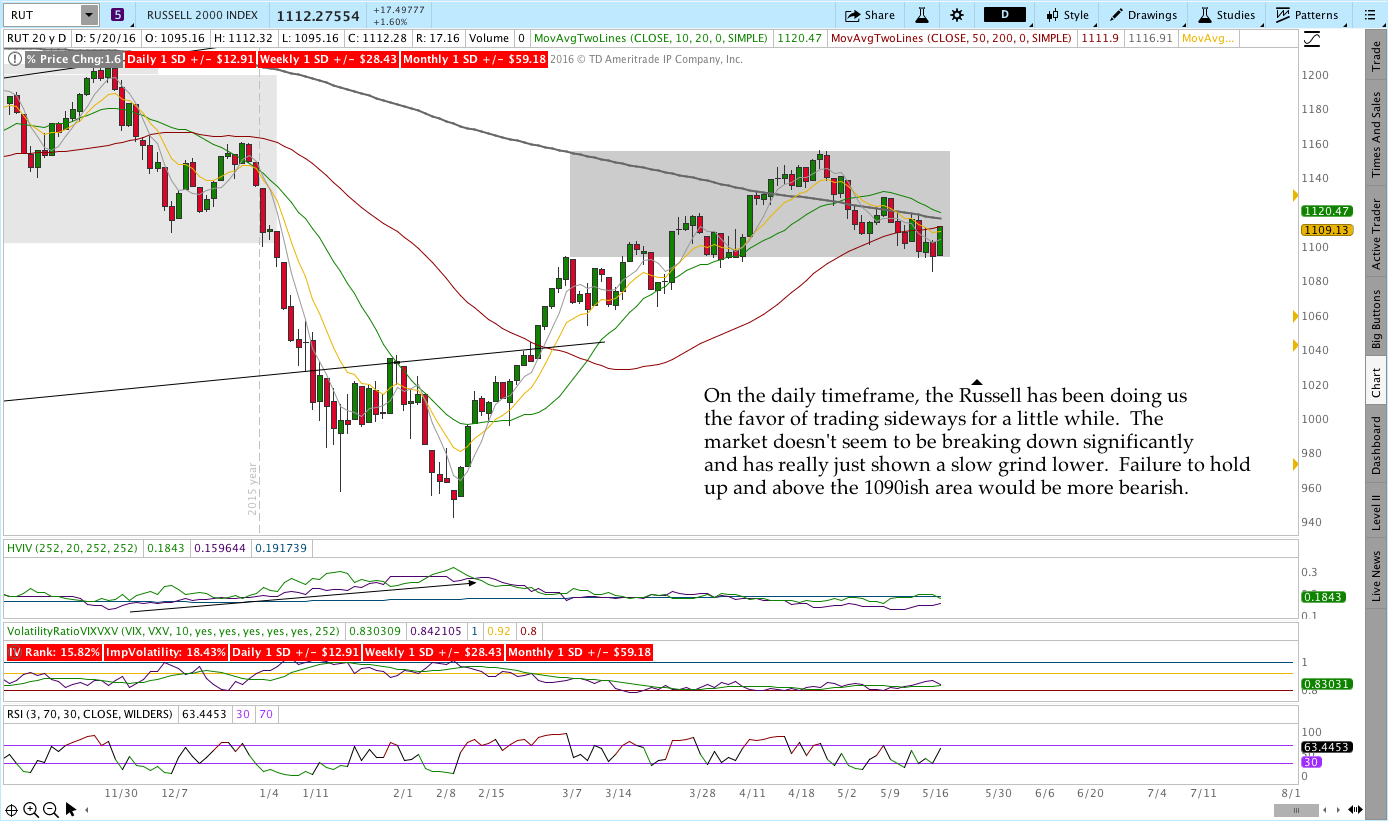
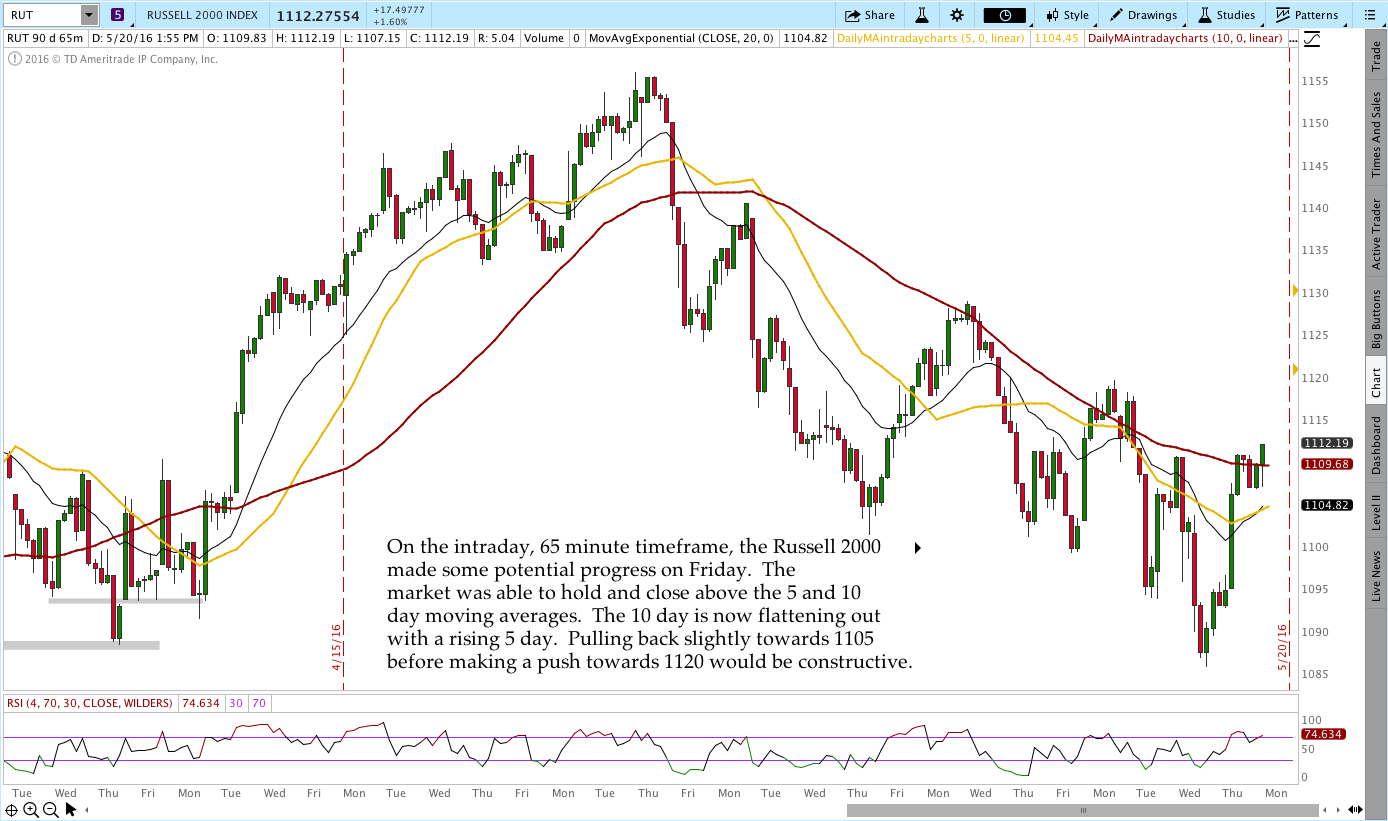
Russell 2000 – $RUT (Weekly, Daily, and 65 Minute Charts):
Live Trades . . .
The “Live Trades” section of the commentary focuses on actual trades that are in the Theta Trend account. The positions are provided for educational purposes only.
——————————
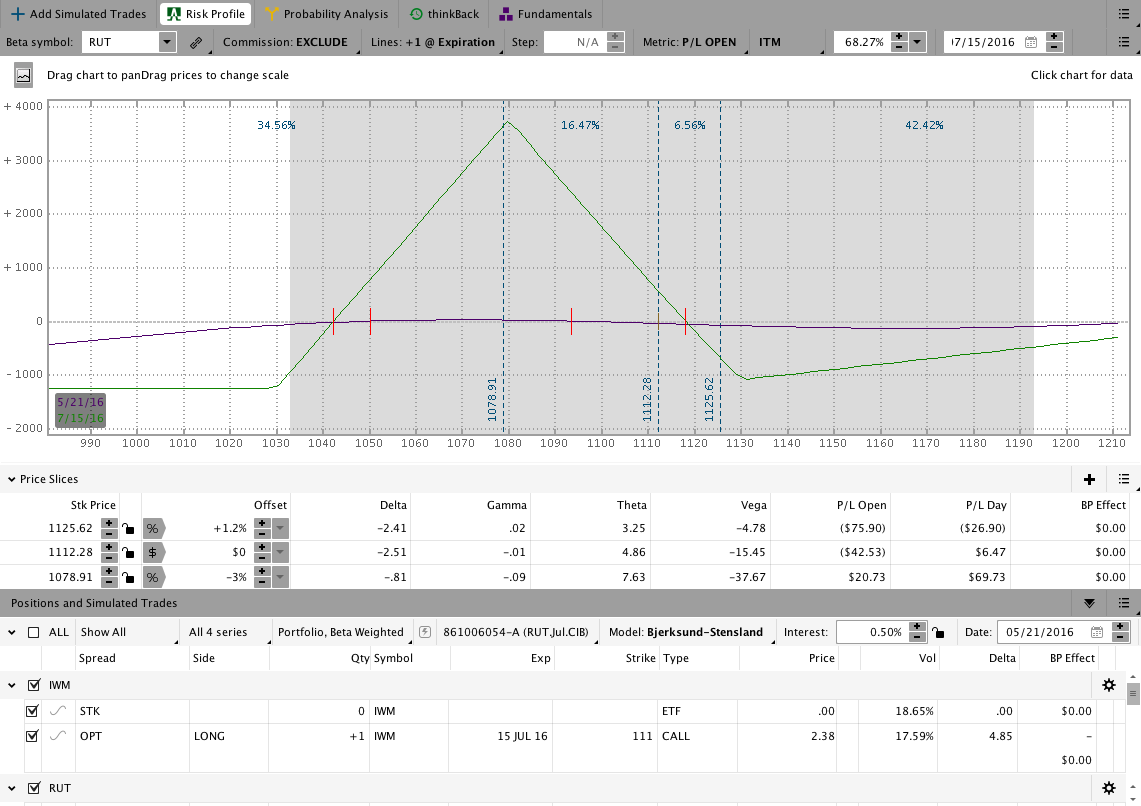
Yesterday with 55 DTE I opened a new $RUT CIB for the July expiration. The trade is open and has a small open loss at the close on Friday. At this point there isn’t much to say about the position.
$RUT July 2016 Core Income Butterfly Trade:
If you want to learn a safer, less painful way to trade options for income, check out the Core Income Butterfly Trading Course.
Looking ahead, etc.:
I have some longer dated BWB’s open right now and I was able to close a few this week. I may defend some of the open positions against a potential move higher. All are healthy right now, but a fast move higher wouldn’t be a ton of fun for a couple of the positions.
I’d be thrilled to see this sideways choppy price action continue. Sadly, I never get to choose.
Have a great weekend and please share this post if you enjoyed it.
Click here to follow me on Twitter.
Want to receive an alert as soon as the next market commentary is posted?

Sign up for my email list and stay up to date with the latest information on options trading.
Click here to sign up for the list, get a copy of the Theta Trend Options Trading System, the Trade Tacker I use, and information about new systems.
Even better . . . it’s all totally free.