Weekend Market Commentary 1/17/14 – Stocks, Bonds, Gold ($SPY, $IWM, $QQQ, $TLT, $GLD)
Big Picture:
 Good morning everyone (well, everyone in the US anyway). Last week I mentioned that I thought the tides might be changing. This week we saw a continuation of last weeks move in both Bonds and Gold and it appears as though the downtrend in those markets has slowed. I think what we’re seeing in both markets may be the beginning of some constructive healing, but I do not expect the trend to sharply shift to the upside. I’m not saying it can’t or won’t happen, but I don’t think we’re seeing that just yet.
Stocks basically churned on the week with a little shakeout; the S&P ($SPY) ended down slightly and the Russell ($IWM) and Nasdaq ($QQQ) ended slightly higher. I generally don’t include the Nasdaq in our discussions, but I sold a naked April Put in the Nasdaq so I thought I’d mention that market as well. Details for the trade are listed below in the Inventory section.
The Weekly Stats:
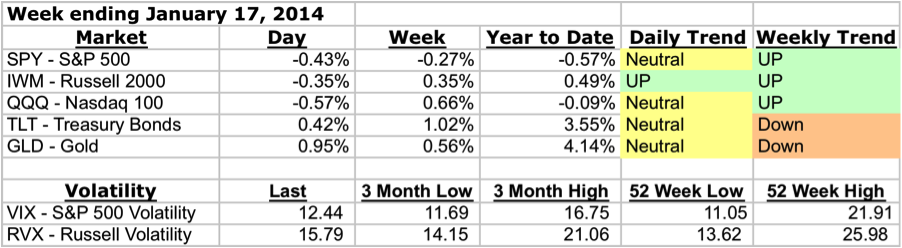
A note about trend . . . Trend on the daily timeframe is defined using Donchian channels and an Average True Range Trailing Stop. There are three trend states on the Daily timeframe: up, neutral, and down. On the weekly timeframe, I’m looking at Parabolic SAR to define trend and there are two trend states, up and down. In reality, there are always periods of chop and I’m using the indicator to capture the general bias of both the trend and those periods of chop.
Stocks ($SPY – SPDR S&P 500 ETF and $IWM – iShares Russell 2000 Index ETF):
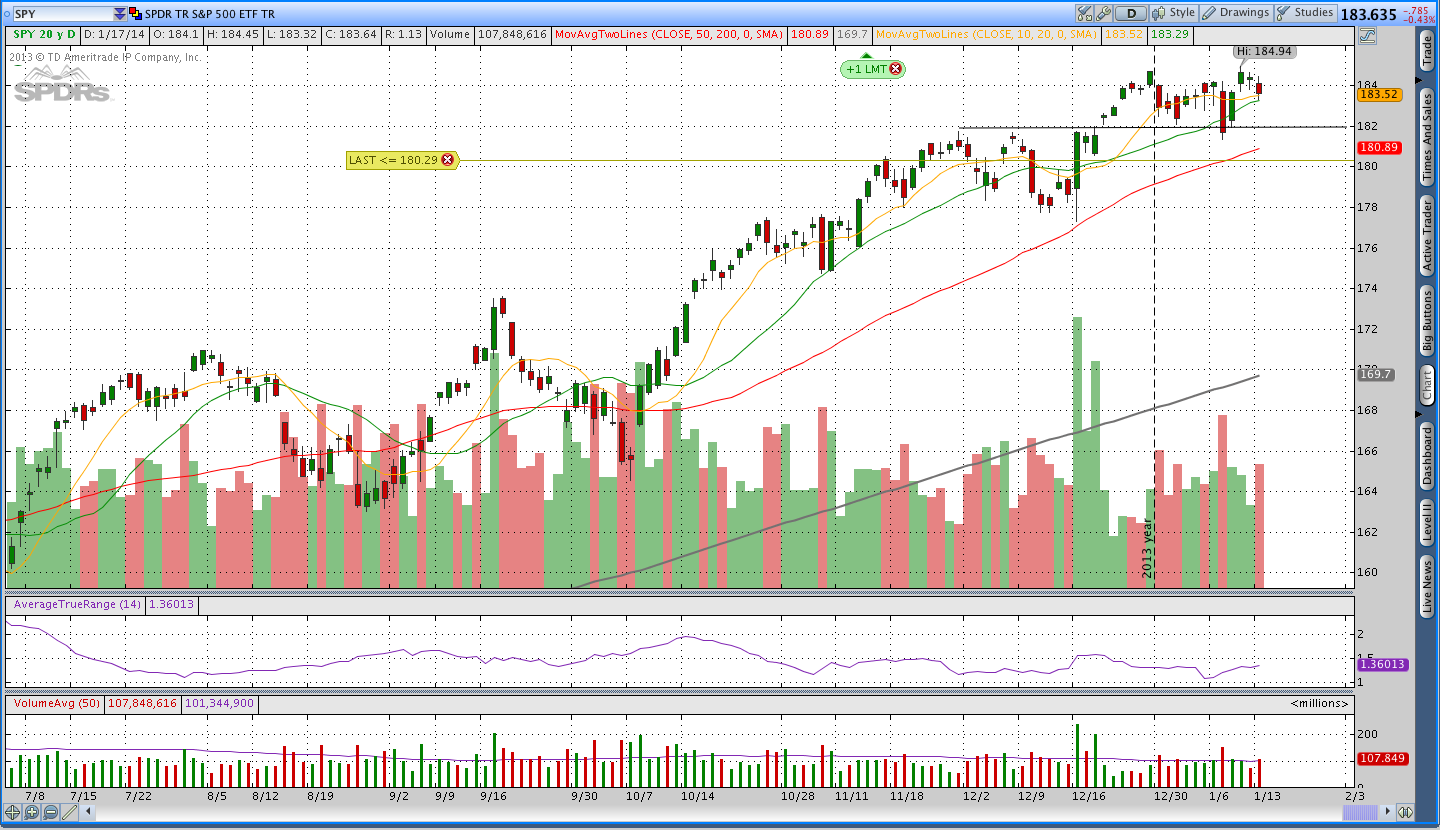
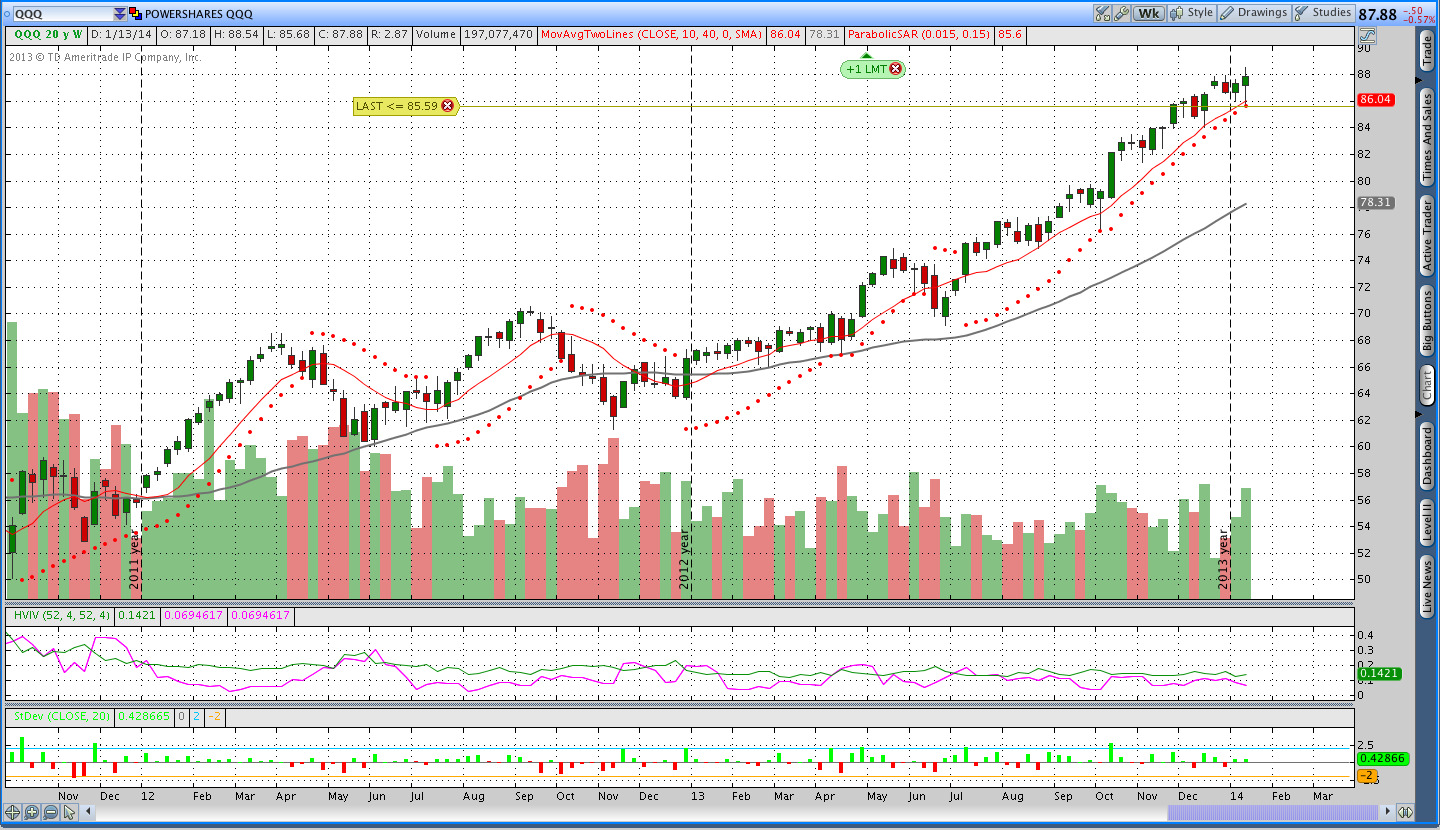
Stocks had a choppy week with a little bit of a shakeout on Monday that I used as an opportunity to sell a $SPY put. Volatility continues to be depressed and is trading in the low end of both the 3 month range and 1 year range. I also sold a $QQQ naked put and a naked strangle in $IWM. You can see the trade specifics in the inventory below.
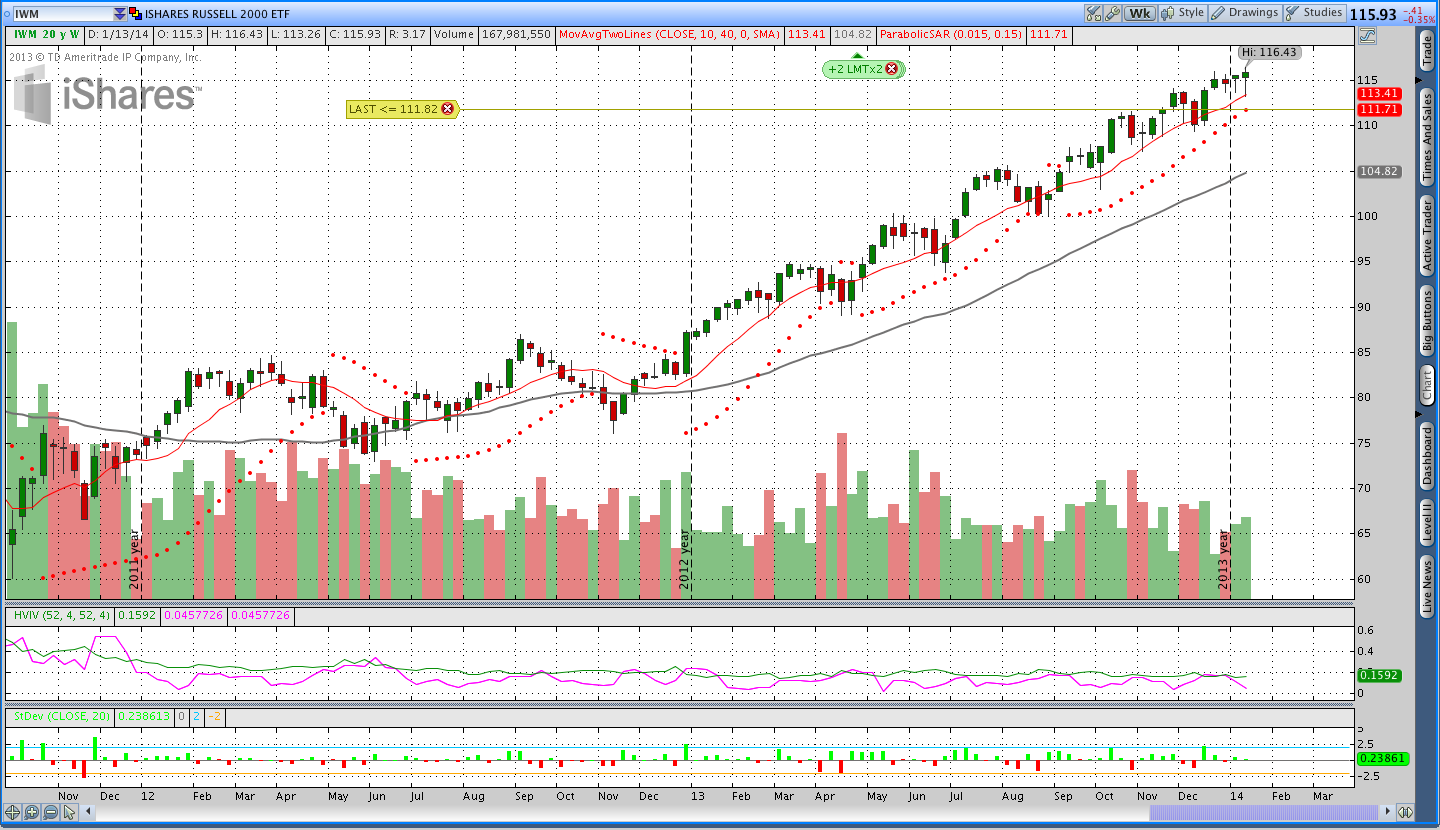
The shakeout on Monday took prices down to a prior level of support and price bounced decisively back on Tuesday. Price is essentially range bound and consolidating right now and until we see a definitive breakdown my bias will continue to be long. The pTheta system uses Parabolic SAR on the weekly timeframe to determine trend direction. As trends continue, the pSAR moves closer to the market and eventually gets hit and that invalidates long trades. I think we’re approaching a situation where the pSAR will be hit and the long stock trades will be closed.
$RUT Iron Condor Trade Update:
The $RUT Iron Condor was closed for a small gain on Thursday. For some reason, I psychologically have a hard time trading Iron condors and I decided to close the position both to free up margin and free my mind. I did, however, replace the position with an April 2014 naked strangle in the Russell 2000.
Gold ($GLD – SPDR Gold Shares ETF):
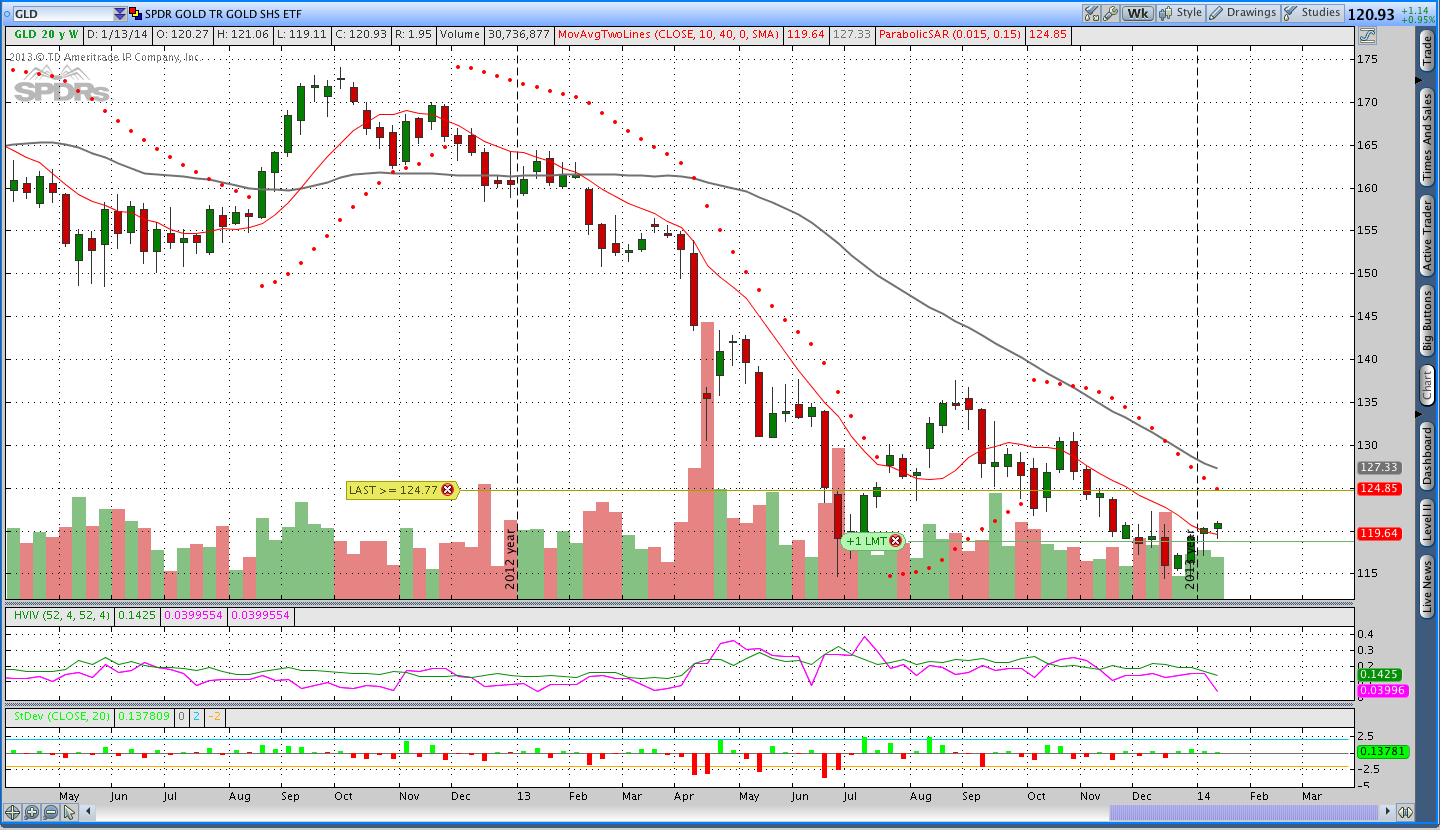
Gold ended the week in the green with the entire gain coming on Friday. I was trying to sell a 134 April call all week, but was unable to get the .50 or so price I wanted. I’m generally opposed to selling naked options for less than .50 and really prefer .70 and above. I’ll try to get filled on a naked call next week, but I may need to move down from 134 to 133 to get the price I want.
On the weekly chart of Gold ($GLD) below, price is up above the 10 week or 50 day moving average. It’s possible that we’re beginning to see some sort of base building, but it’s a little early to tell for sure. If price stops moving lower and the longer term moving averages have some time to level out, then we can say some base building is taking place. For the time being, Gold has failed to make new lows on the weekly chart and that suggests the downtrend has slowed. That being said, price is slowly drifting higher on declining volume.
Bonds ($TLT – iShares Barclays 20+ Year Treasury Bond ETF):
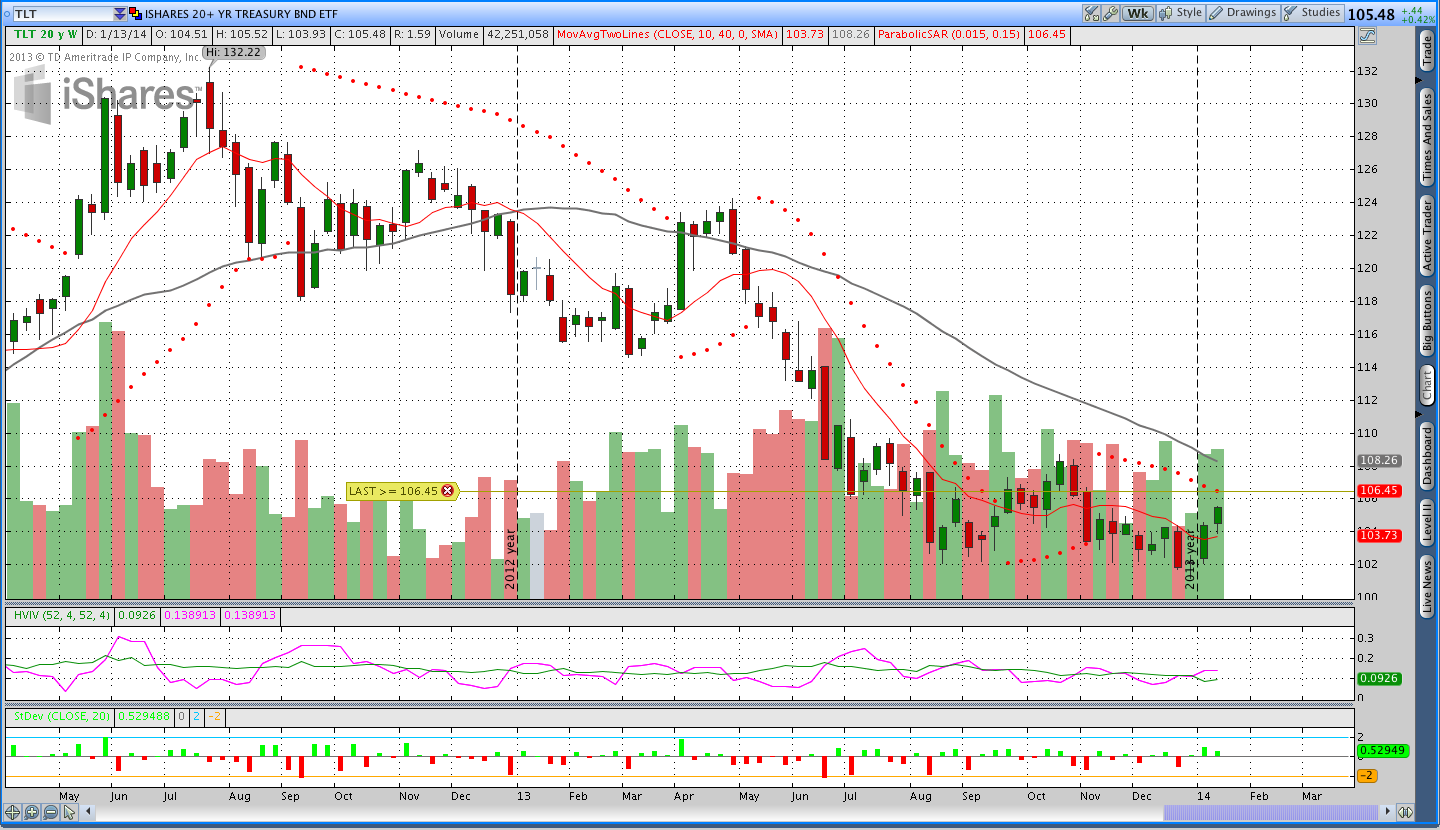
Bonds were strong this week. I was stopped out of the 106/110 vertical spread, but I sold a naked April call for the pTheta system. The daily trend moved from down to neutral and the weekly trend remains down. Bonds, like Gold, have been in a downtrend for a while, but I think Bonds look stronger.
In the weekly chart of Bonds below, the 10 week or 50 day moving average is moving horizontally and we saw a decisive move up from the moving average. Price is getting close to hitting the Parabolic SAR. If pSAR is hit, I’ll be looking for puts to sell in $TLT.
Trades This Week:
RUT – Closed the Iron Condor
SPY – Sold a naked April 162 Put for .90
QQQ – Sold a naked April 79 Put for .53
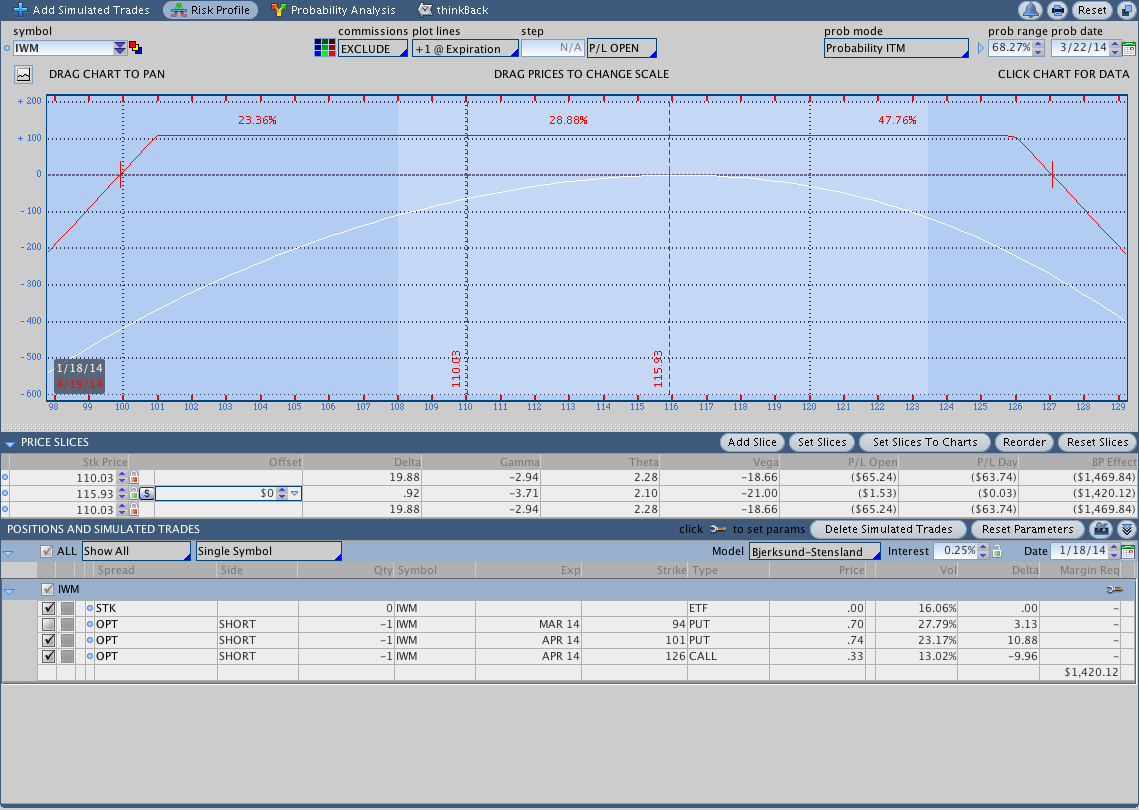
IWM – Sold the April 101/126 Strangle for 1.07
TLT – Sold a naked April 109 Call for .50
TLT – Bought to close the Feb 106/110 Call Credit spread
Option Inventory:
IWM – Short March 2014 94 Put (sold for .70)
GLD – Short March 2014 139 Call (sold for .53)
SPY – Short April 2014 162 Put (sold for .90)
QQQ – Short April 2014 79 Put (sold for .53)
IWM – Short April 2014 101/126 Strangle (sold for 1.07)
TLT – Short April 2014 109 Call (sold for .50)
ETF & Forex Inventory:
NZD/JPY – Long 3,000 notional units at 80.56
USD/JPY – Long 4,000 notional units at 100.61 and long another 4,000 at 101.64
BAL (Cotton) – Long 50 shares from 53.19
JO (Coffee) – Long 58 shares from 23.38
Looking ahead:
It will be interesting to see if Bonds and Gold continue to be strong next week. If Gold remains strong I may be able to get a fill on the short call I want and I’ll post details to Twitter if that happens. Stocks are chopping around in a range and a breakout in some direction becomes increasingly likely.
My feeling is that people tend to think about markets in terms of arbitrary periods of time because it helps them add order and makes them feel like they have a sense of understanding. It’s impossible to know what will happen in 2014, but my sense is that the strong down trends may be slowing. We’ll need to wait and see.
One last thing . . . if you’ve read this far and still have lingering questions, feel free to post them in the comments below.
Want to know what’s going on at Theta Trend and see new systems as soon as they’re posted?

Sign up for my email list and stay up to date with the latest happenings.
Click here to sign up for the list, get a copy of the Theta Trend Options Trading System, the Trade Tacker I use, and information about new systems.
Even better . . . it’s all totally free.