$SPY Naked Put Trade Details
Overview:
This is brief overview of the $SPY naked put I sold Monday. The trade was tweeted shortly after entry and on Monday was down a little bit of money. Yesterday $SPY was stronger and that moved the trade back into positive territory.
$SPY Naked Put (pTheta Trade):
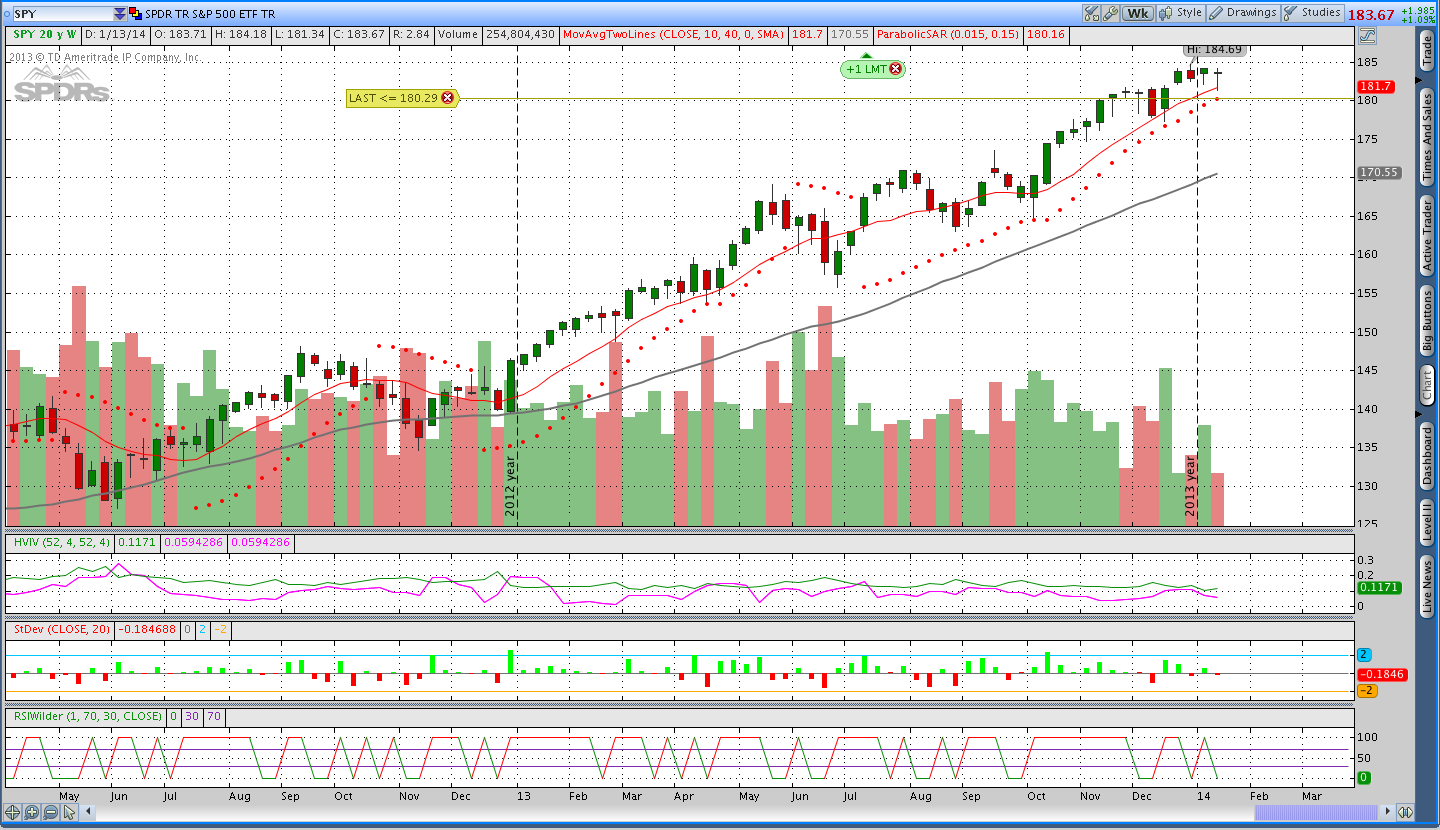
On Monday we were 95 days until April expiration and stocks sold off throughout the course of the day. I took the down day as an opportunity to sell a put for the pTheta system. The point of selling the put on a down day is that it allows me to enter at a price that is closer to the stop level so the potential loss will be smaller if the position is stopped out. In the image below, the Parabolic SAR (pSAR) stop level is around 180.29. If price trades to that level, I will exit the trade.
Risk:
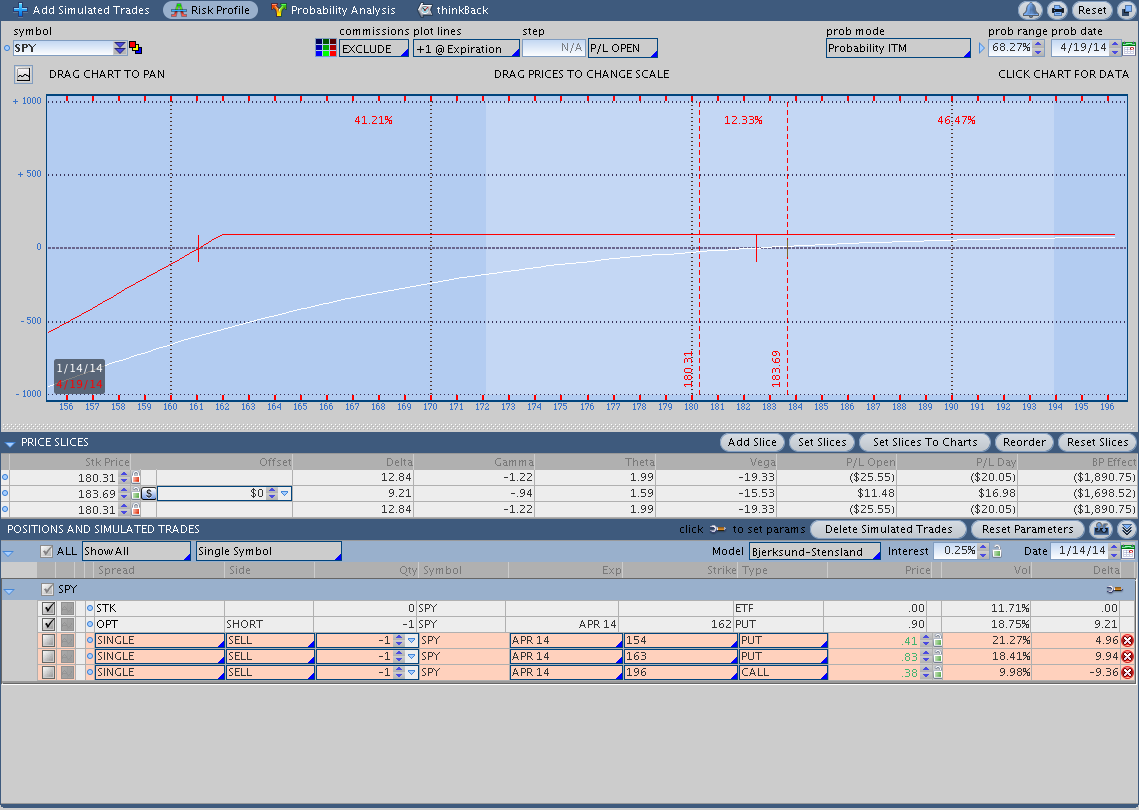
In the risk graph below there are two vertical lines. The left line corresponds to a stop level of around 180.29 and the right line is the current price. If price immediately traded to the stop level, the position would suffer a loss of $25-$30. The naked put was sold for a .90 credit and my profit target with the pTheta system is always to buy the position back for a nickel.
Trade Details:
I sold the April 2014 162 $SPY put for a .90 credit.
![]()
Current Inventory:
As of today, I have the naked $SPY put described above, an $IWM March naked put, and a $GLD March naked call. I’m currently looking to sell an April $GLD call, but I haven’t been filled yet. If I am filled on an order, I’ll post it out on Twitter.
Oh and one more thing. I’m looking for new markets to trade. If there’s a market you’d like to see me trade, let me know in the comments below and I’ll consider it. Thanks for reading.