Analysis of S&P 500 Returns Above & Below The 200 Day SMA $SPY $SPX
The 200 day SMA is a widely watched indicator of health for the U.S. Stock market. When price is trading above the 200 day SMA, most market participants can agree that a longer term up-trend is either in place or developing. When price is trading below the 200 day SMA, most people recognize that the up-trend has stopped or is reversing. That being said, it’s dangerous to make generalizations about an indicator like the 200 day SMA without understanding the potential risks.
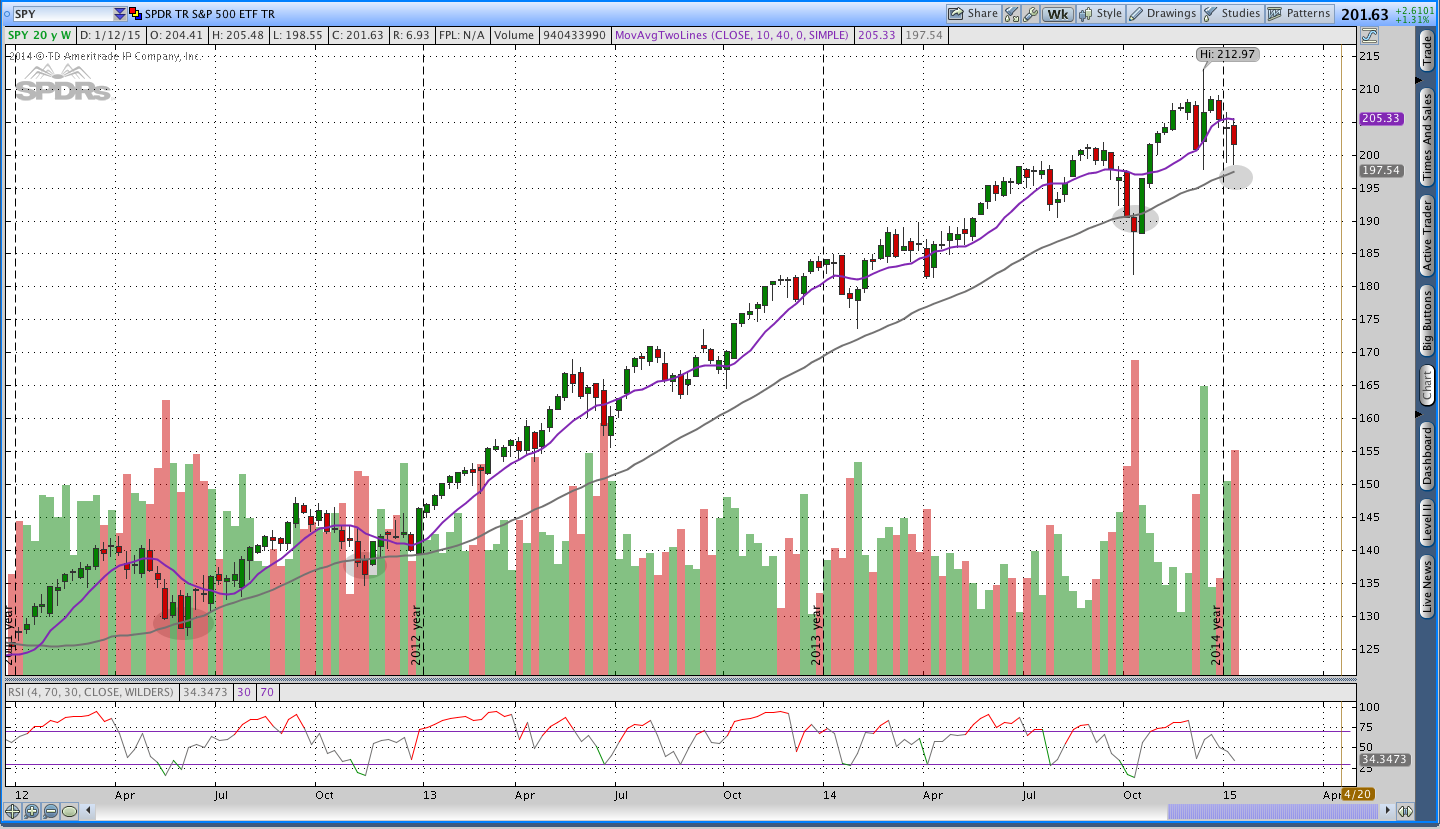
Over the past few weeks we’ve seen some volatility come back into U.S. Equities while they hang around all time highs. The S&P 500 ($SPY) has bounced around the 50 day SMA and could potentially be coming down to visit the 200 day Simple Moving Average. The chart below is a weekly chart for the S&P 500 ETF ($SPY) with two simple moving averages that approximate the 50 day (10 weeks) and 200 day (40 weeks or 10 months) moving averages. A brief glance at the chart shows us that $SPY has only come down to test the 200 day moving average once since 2012.
What does it mean?
One of the obvious lessons from a longer term chart is that when price is trading above the 200 day simple moving average, price is likely to advance. The challenge is quantifying that advance and knowing what to expect. As a result, we’re going to look at 20 years of total returns in the S&P 500 ($SPY) based on it’s location relative to the 200 day SMA.
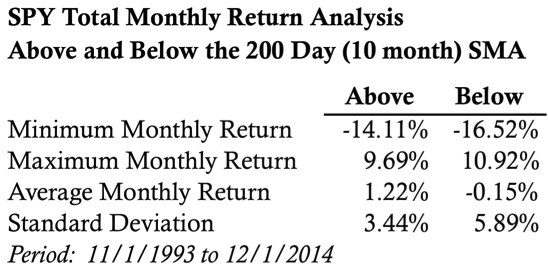
The table below summarizes the total monthly returns for the S&P 500 from 11/1/1993 to 12/1/2014. What we see from looking at the table is that when $SPY is trading above the 200 day simple moving average, it returned around 1.22%. Additionally, that monthly return was accompanied by a lower volatility in returns as indicated by the 3.44% standard deviation of monthly returns.
On the other hand, it’s surprising to see that the average monthly return wasn’t horrible when $SPY was trading below the 200 day simple moving average. That return came in at -0.15% on average. However, the 5.89% standard deviation of monthly returns shows us that there was significantly more volatility in returns. The minimum and maximum monthly returns both took place while price was trading below the 200 day simple moving average.
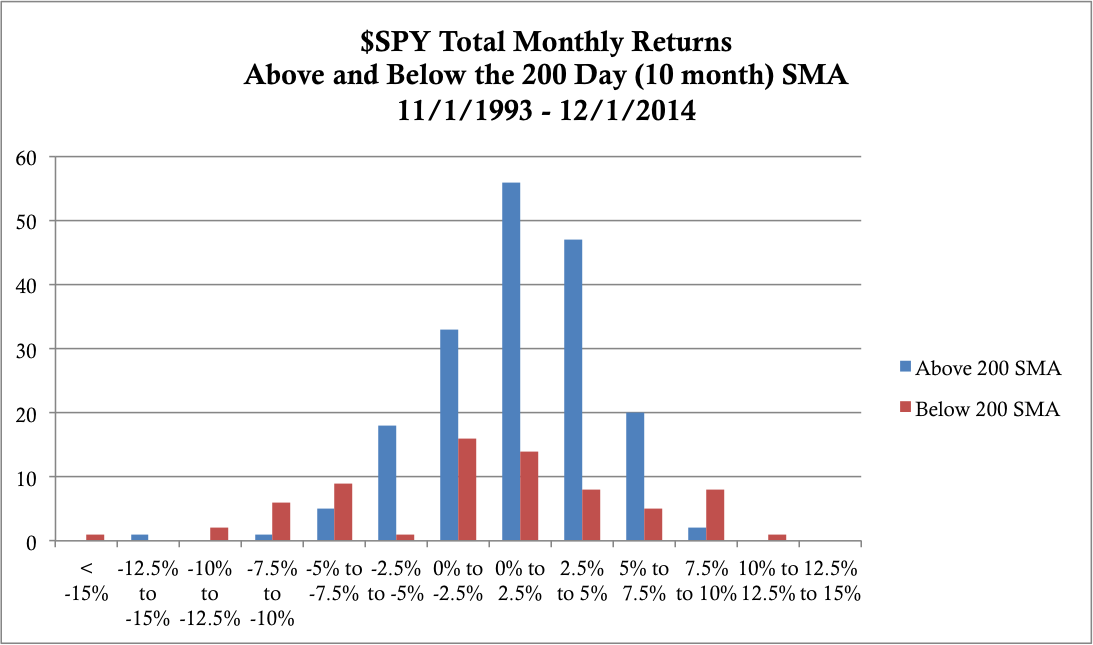
In addition to looking at the table, it’s helpful to look at a distribution of the the returns. The image below shows the distribution of total monthly percentage returns. It’s worth noting that over the look-back period, the S&P 500 has spent more months above the 200 day (10 month) simple moving average. The distribution also shows us that when price is trading below the 200 day simple moving average, negative monthly returns of -5% or less are much more likely to occur.
A word of caution:
All studies of historical data are a product of past performance. Intuitively, we understand that, but it’s important not to make generalizations without understanding the context of the present relative to the past. In the case of the S&P 500, we’re looking at a market that is currently trading near an all time high with a 200 day SMA that is also at an all time high. That observation skews the data and the returns to the upside.
Proponents of buy and hold could potentially use the numbers above to justify holding positions even though price is trading below the 200 day simple moving average. After all, the average monthly return when price is trading below is just -0.15%. The danger in that strategy is that maintaining a long position while price is trading below the 200 day SMA comes with larger drawdowns and a greater likelihood of drawdown. Knowing that, owning stocks when price is below the 200 day SMA is not the most productive use of capital.
For additional investing insights check out this post: Investing. Here’s a plan to stop doing it wrong