Weekend Market Commentary 3/24/2016 – $SPX, $VXST, $VIX, $VXV
Market Stats:
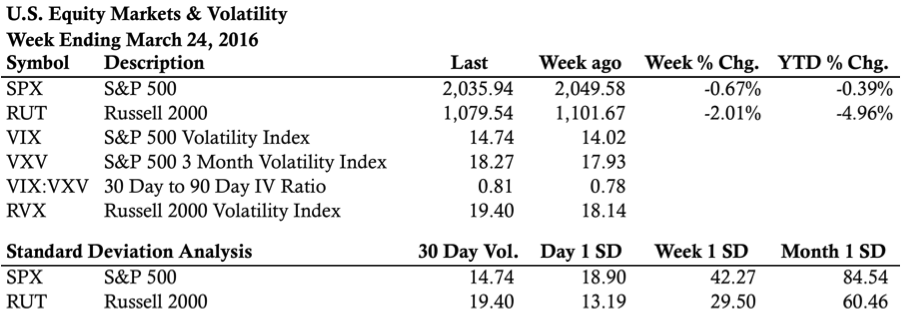
Big Picture:
Just a quick reminder that I’ve been uploading a daily video to the Live Trade Page that covers technical analysis and walks through a sample CIB trade. The video on Friday also showed a couple of BWB’s I’ve been testing out (starts around 11 minutes in), click here to head over and check it out. As an aside, if you sent me an email I’m planning to catch up tomorrow (Monday).
—————————
Does it seem like it’s hard to make sense of what’s going on in the market? Guess what? The market has no idea what it’s doing either.
Recently I’ve seen numerous headlines saying the market is “complacent” and I don’t think I can take another one. The market has advanced in the past few weeks and volatility has confirmed the move higher. That’s not complacent. That’s relatively typical. When you take a step back to longer term timeframes what you see is disconnected trends, a lot of chop, and longer term mean reversion.
Despite their inability to earn money from the markets, the financial entertainment industry is frequently forward looking. A large majority of stories talk about where the market might be going or is going. There’s a lot of heavy analysis about what the market “might do.” Somehow that ambiguity is passed off as high level information with potential value. Nonsense. If our goal is to be consistently profitable over long periods of time, we need to focus on controlling risk and managing positions.
From a technical standpoint, there’s confusion across multiple timeframes while everyone is sitting around looking for the next big move. Some of the predictions (regardless of what they are) will be right and others will be wrong. When someone is right it can cause us to believe certain viewpoints, but in reality everyone is going to be right and wrong at different times and nobody ever knows what will happen. We all have a 33% chance (higher, lower, or the same).
Our goal as non-directional traders is to manage positions regardless of what’s happening in the market. Whether the market moves up or down is largely irrelevant, but obviously slower movement is generally better than fast movement. Having an “if then” trading plan with multiple scenarios is far more important than knowing what scenario plays out. There is no part of a story about the market being “complacent” that will help with that.
The hours we put in before we’re in a trade matter at least as much and probably more than how “potential” movement will impact our open positions. I spent the past two days manually testing trading systems and refining some BWB rules. Manually testing is and has always been a slow process, but it gives you a sense for how systems work or don’t work.
As an aside, at no point in my testing did I go back to look for old news stories about where the market “might go.” Do you know why? That’s right . . . because they don’t matter. If they don’t matter when we’re testing, why should we care about them now?
In testing it was interesting to see how much the market has moved in the past couple of years. Equities haven’t moved far directionally, but they’ve moved around quite a bit on their path to nowhere. That movement has created a challenging period for systems with a great data set for validating ideas.
Volatility:
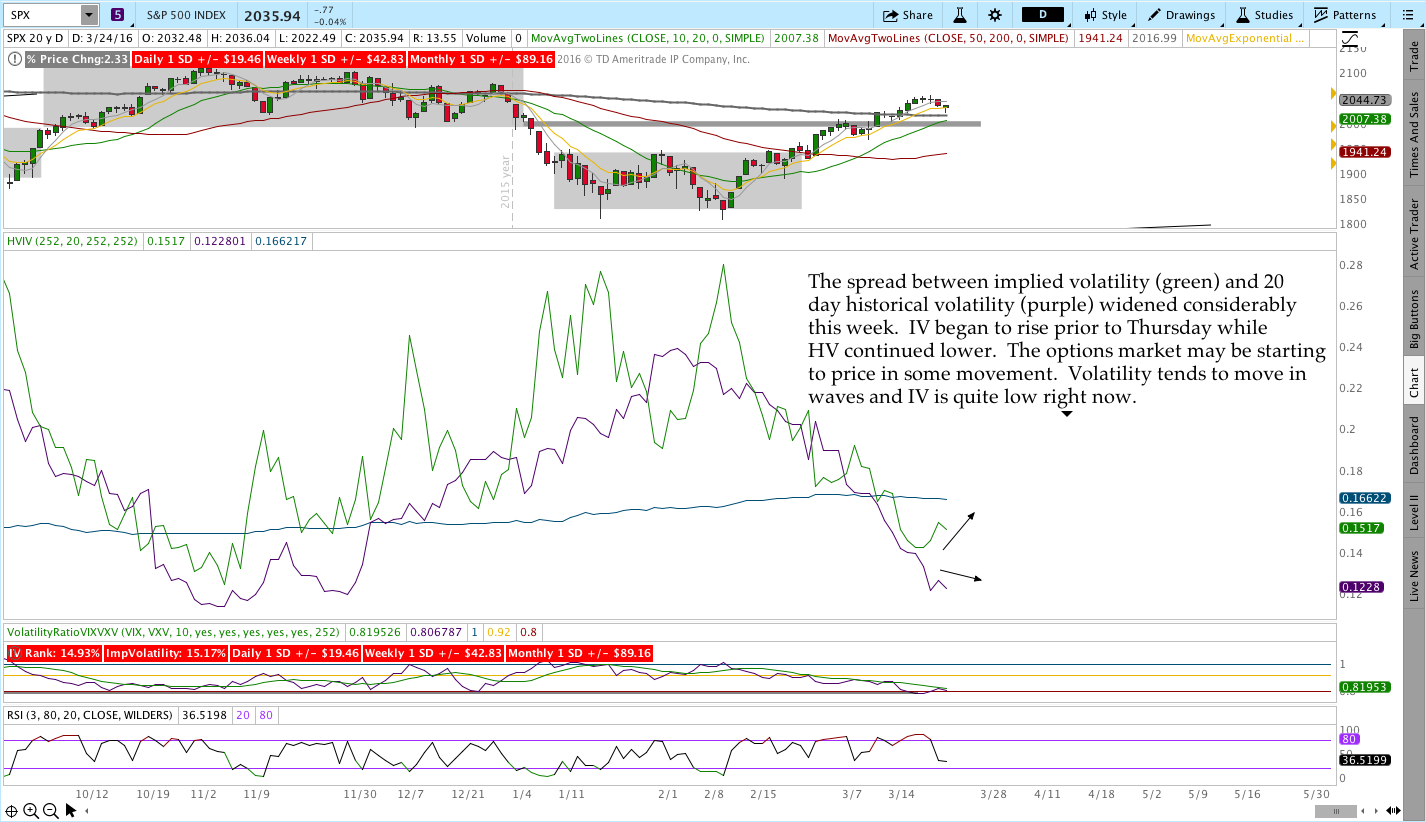
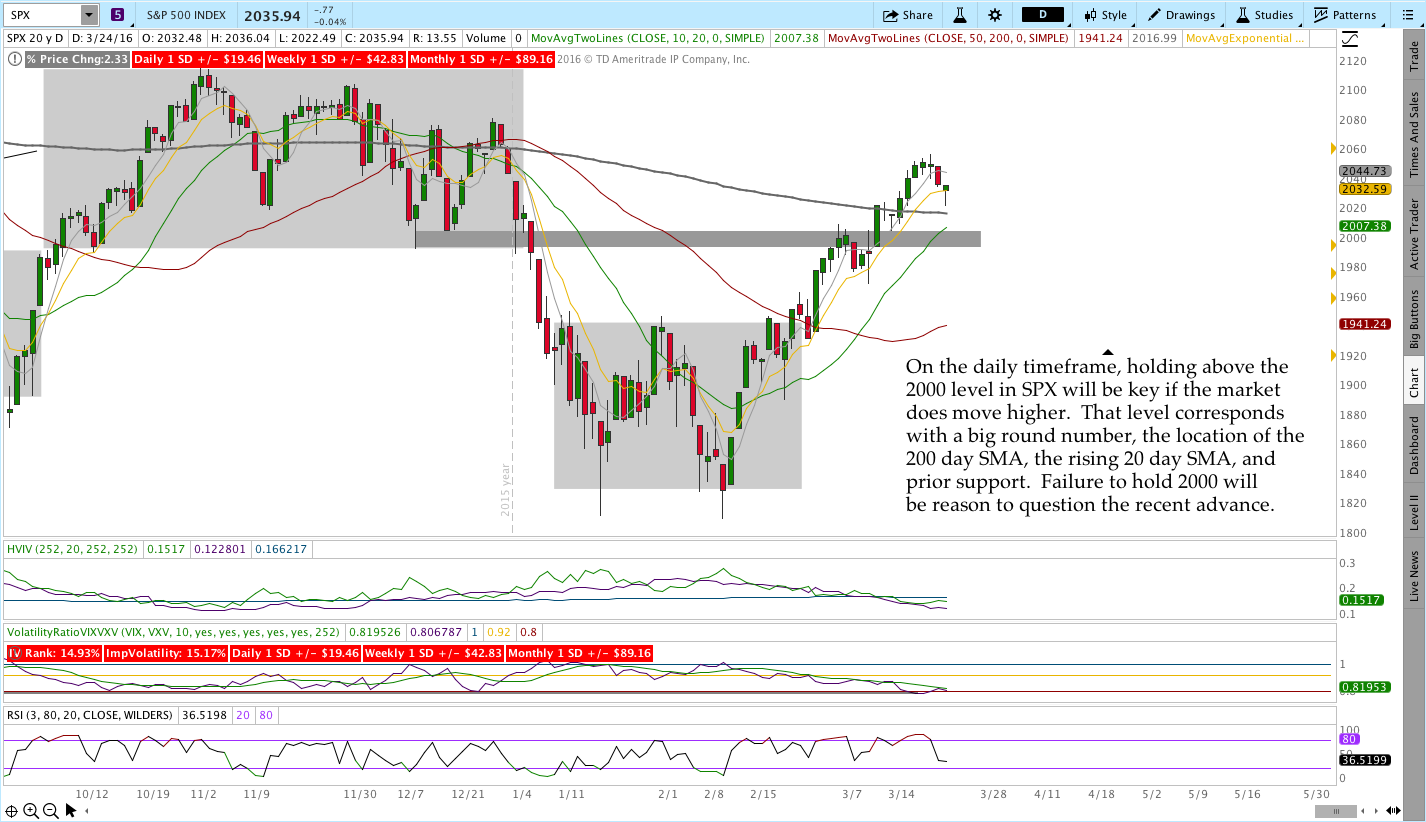
Volatility has been pretty quiet lately in confirmation of the move higher. One bit of information that’s worth taking note of is the slight increase in the implied volatility to historical volatility spread (see HVIV below). Early this week that spread began to widen. Implied volatility is at a very low level in terms of the IV Index and an increase wouldn’t be surprising, but the ratios aren’t showing any significant signs of concern.
Levels of Interest:
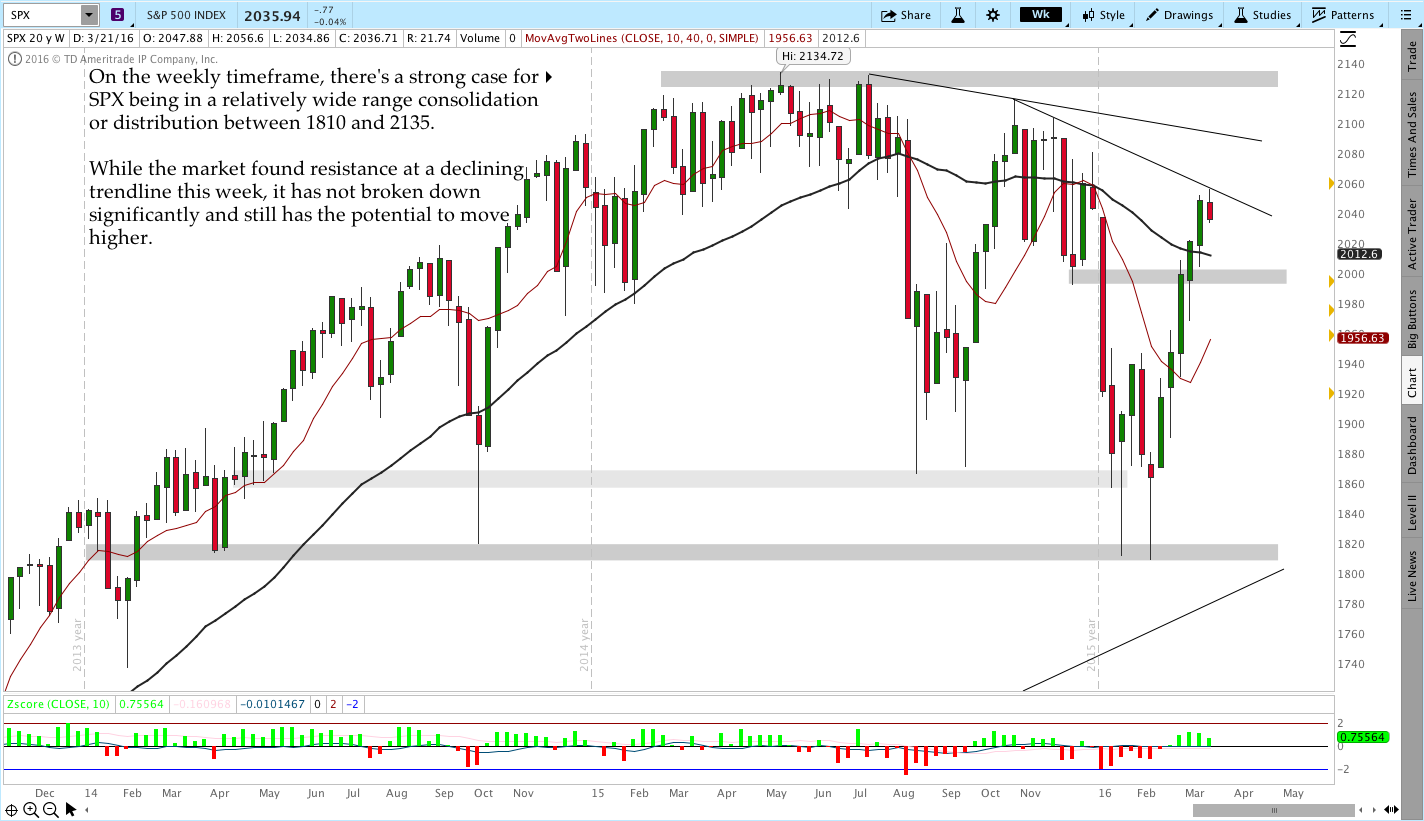
In the levels of interest section, we’re drilling down through some timeframes to see what’s happening in the markets. The analysis begins on a monthly chart, then weekly chart, moves to a daily chart, and finishes with the intraday, 65 minute chart of the S&P 500 (SPX)). Multiple timeframes from a high level create context for what’s happening in the market.
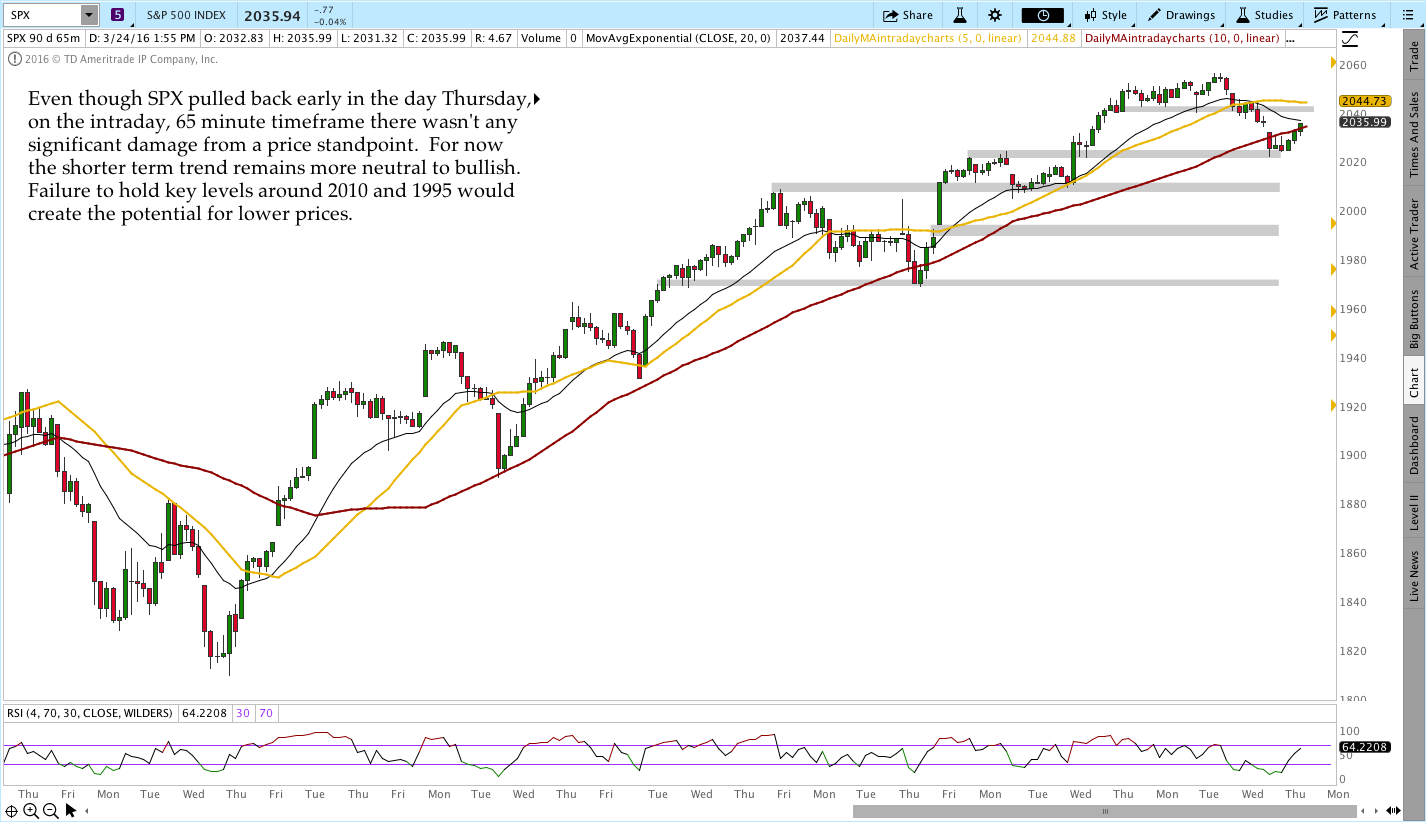
S&P 500 – $SPX (Weekly, Daily, and 65 Minute Charts):
Live Trades . . .
The “Live Trades” section of the commentary focuses on actual trades that are in the Theta Trend account. The positions are provided for educational purposes only.
——————————
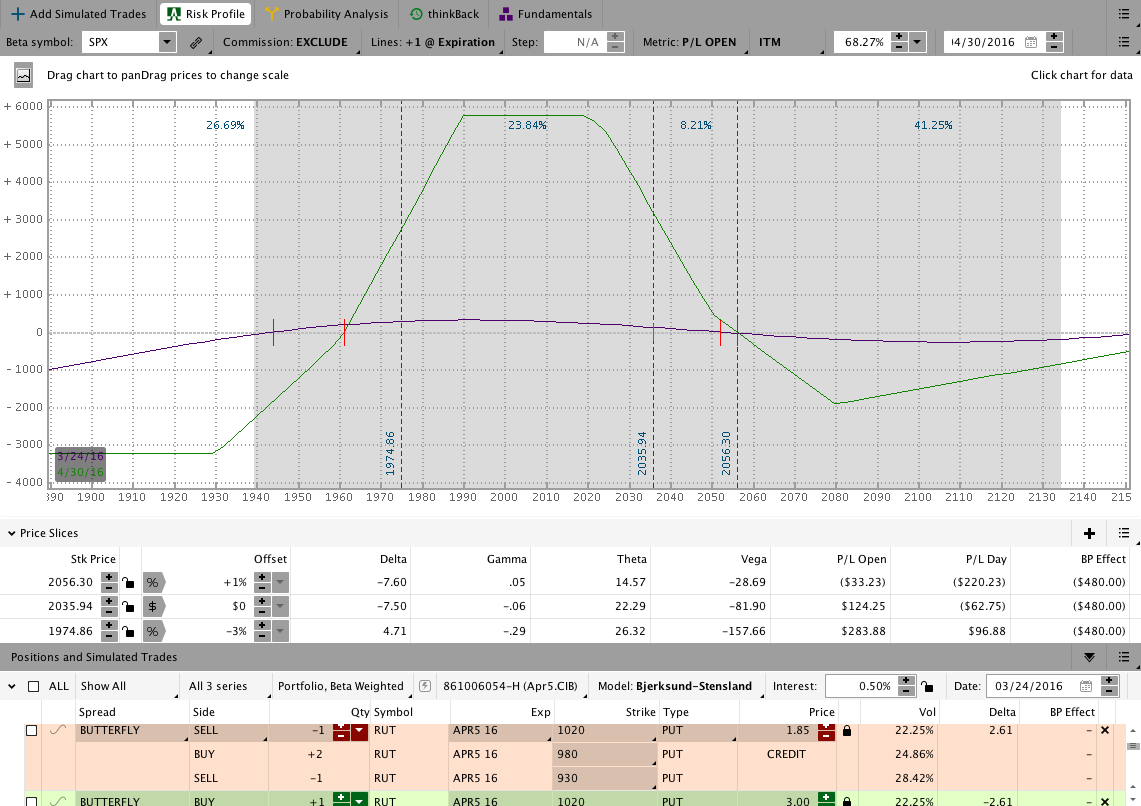
The April5 $SPX CIB is open and healthy, but the trade is starting to get a little shorter delta than I want. An image of the position as of Friday is shown below.
For more information on this trade, check out the Live Trade Page with daily video updates and comments.
$SPX April5 2016 Core Income Butterfly Trade:
If you want to learn a safer, less painful way to trade options for income, check out the Core Income Butterfly Trading Course.
Looking ahead, etc.:
This week I’ll be sitting around managing open positions. I’d be thrilled to have a sideways to slightly lower week, but I never get to choose. We’ll see how it plays out.
Have a great weekend and please share this post if you enjoyed it.
Click here to follow me on Twitter.
Want to receive an alert as soon as the next market commentary is posted?

Sign up for my email list and stay up to date with the latest information on options trading.
Click here to sign up for the list, get a copy of the Theta Trend Options Trading System, the Trade Tacker I use, and information about new systems.
Even better . . . it’s all totally free.