Weekend Market Commentary 2/5/2016 – $RUT, $SPX, $RVX, $VIX, $VXV
Big Picture:
Markets are constantly changing and changing with them is essential for long term success.
In 2009 the U.S. Equity markets and most risky asset classes were coming off of a pretty bad year. 2008 was not kind to stocks and for the first few months of 2009 it seemed like the markets would continue lower. On March 10, 2009, the S&P closed up 6.37% and hasn’t really looked back until maybe now.
Once the market made that first of many V-Bottoms in March, a relentless rally took place that lasted through the end of 2014. Even though higher prices seem to promise opportunity, many traders lost money in 2009 betting the decline wasn’t over. It seemed “smart” to be skeptical of the move higher and anticipate another move lower. The reason traders lost money on the move higher in 2009 is that they failed to acknowledge that the environment had changed and that the primary trend was higher. I know because in 2009 I was one of those traders.
Over the next few years, we learned that the market tends to rebound from oversold levels fairly quickly and many traders learned to buy the dip. What we need to recognize is that buying the dip only works in certain market environments and, at least for now, that strategy is likely to fail.
While it’s certainly true that stock prices have risen over time, we’ve also seen periods of sharp decline where strong counter trend rallies materialize before they subsequently fail. As traders, it’s more important to recognize both when change has taken place and when the market has the potential to change. During 2015 the markets began to change as they transitioned to sideways price action and this year the market has continued to change as the primary trend has shifted lower.
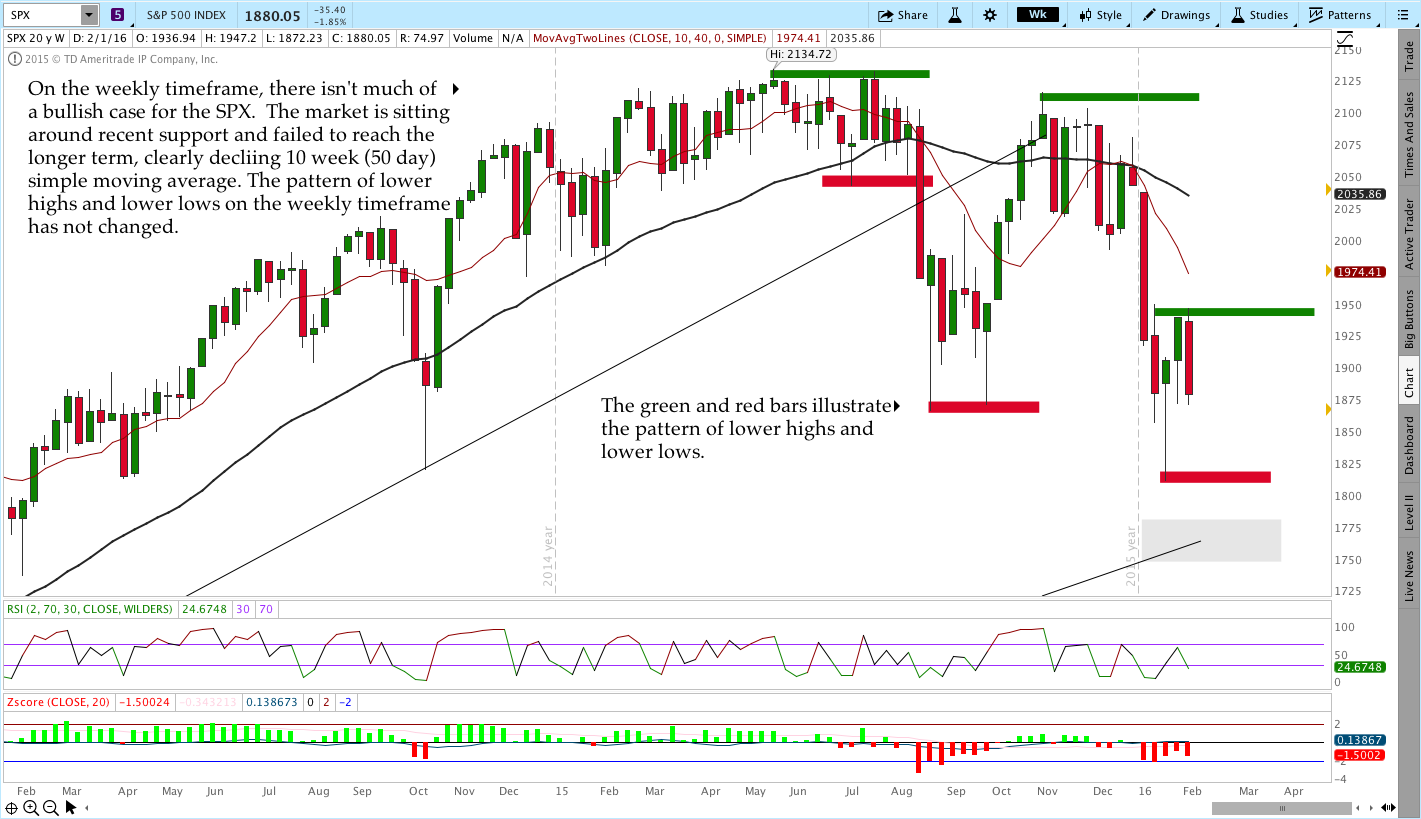
We’ve seen the rate of decline slow over the past few weeks with a little stability coming back into the market. At the same time, we can only assume that the stability is temporary. The daily ranges we’re seeing are large in percentage terms, but most of the significant short term levels have held in both directions. On Friday, both the Russell 2000 and the S&P 500 went into the weekend sitting around recent support. That being said, support is only support if it holds and we never know until after the fact. Sitting at support really means that the market has the potential to change.
In the current environment, the potential for fast moves in either and both directions is great. Those moves tend to draw in participants only to reverse and stop them out leading to feelings of frustration. When we feel frustrated in trading it usually means we’re imposing our view of what “should” happen on the market. Do I even need to tell you what the market thinks about that?
Volatility:
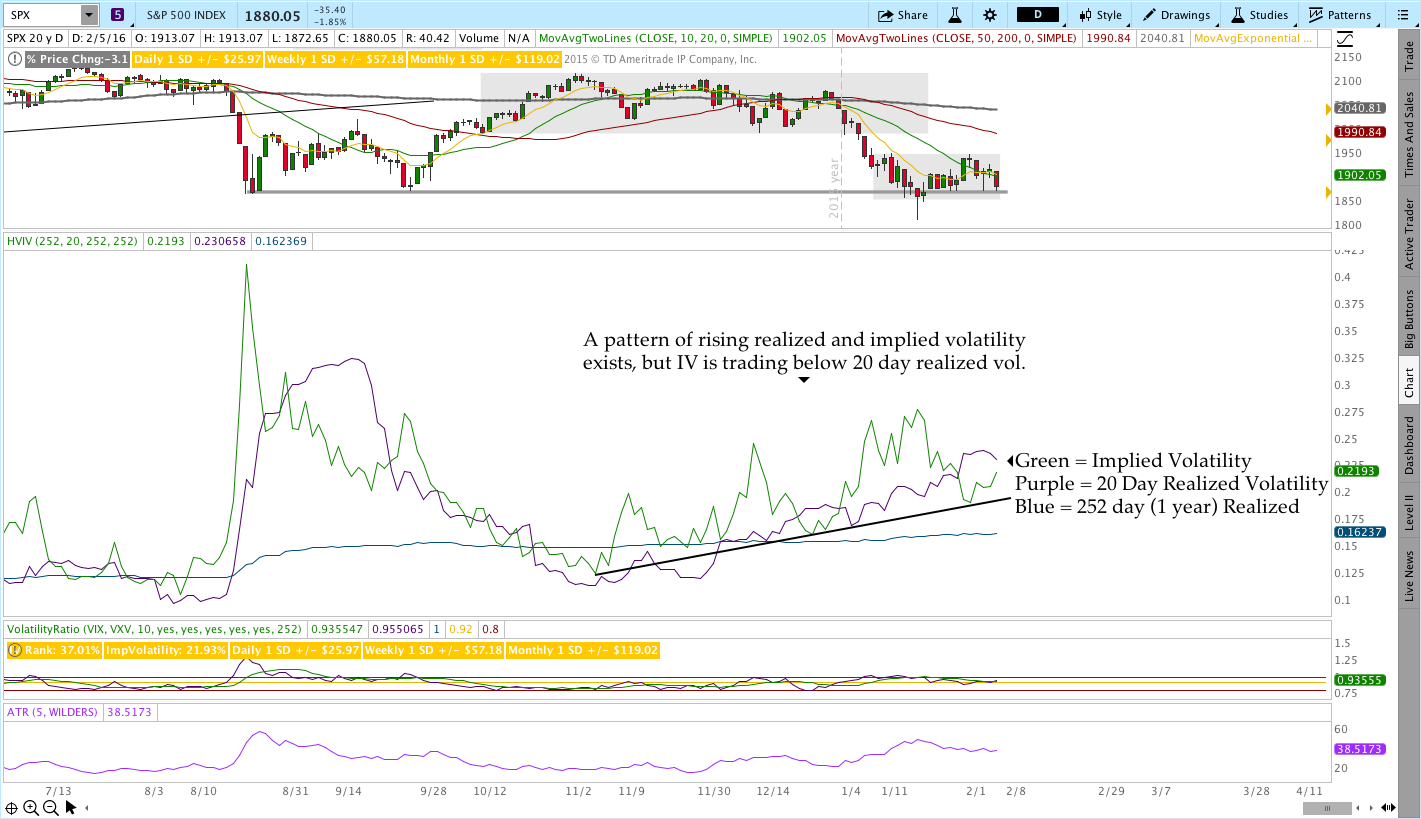
Volatility doesn’t really seem to care about this move lower. From a raw value standpoint, RVX is under 30 and VIX went into the weekend a touch over 23. If a strong bear market materializes we can expect to see an explosion in volatility. If the slow grind lower continues, we might not.
Market Stats:
Levels of Interest:
In the levels of interest section, we’re drilling down through some timeframes to see what’s happening in the markets. The analysis begins on a weekly chart, moves to a daily chart, and finishes with the intraday, 65 minute chart of the S&P 500 (SPX) and the Russell 2000 ($RUT). Multiple timeframes from a high level create context for what’s happening in the market.
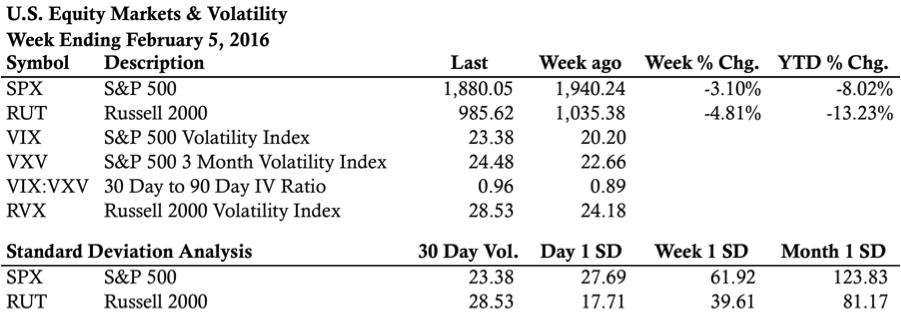
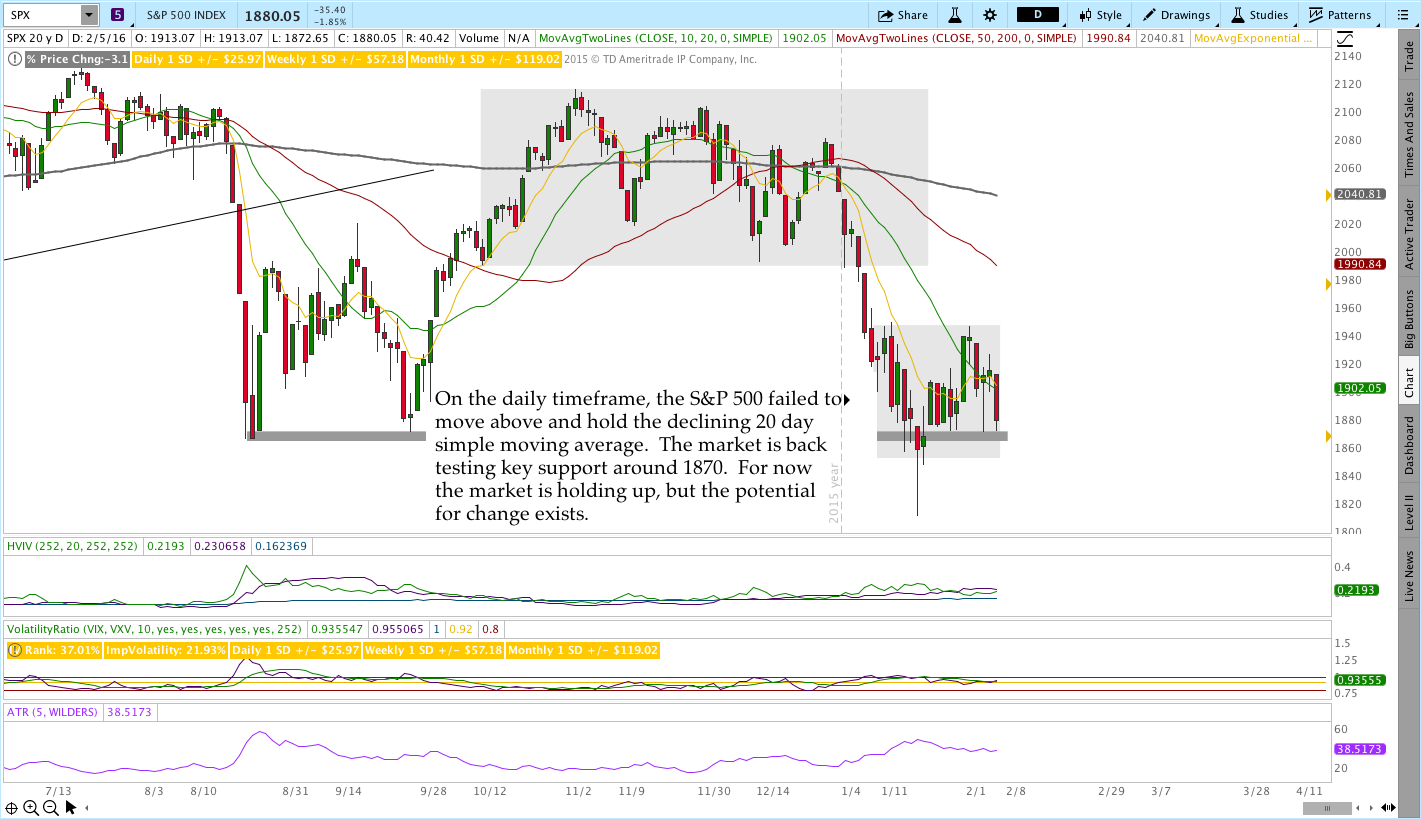
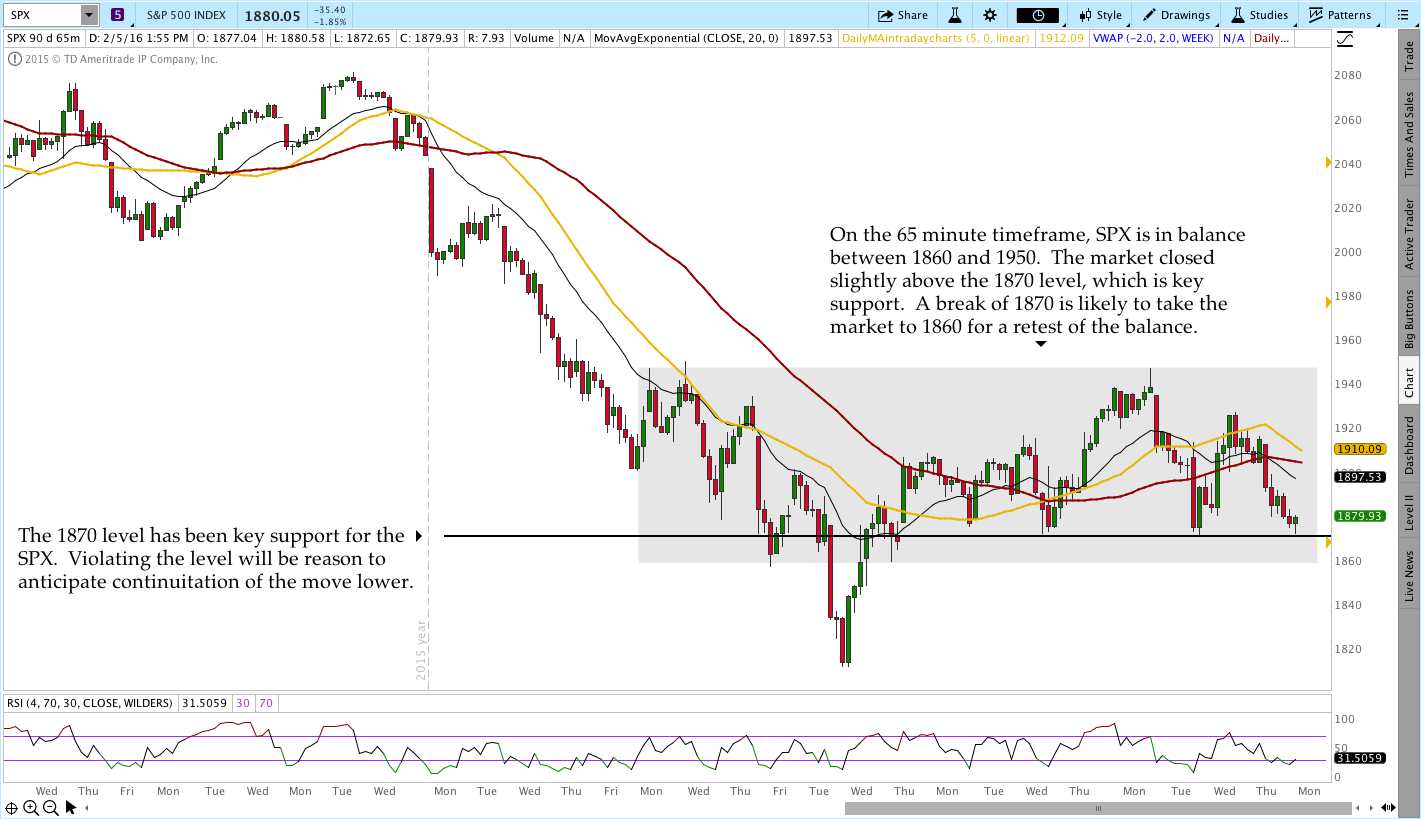
S&P 500 – $SPX (Weekly, Daily, and 65 Minute Charts):
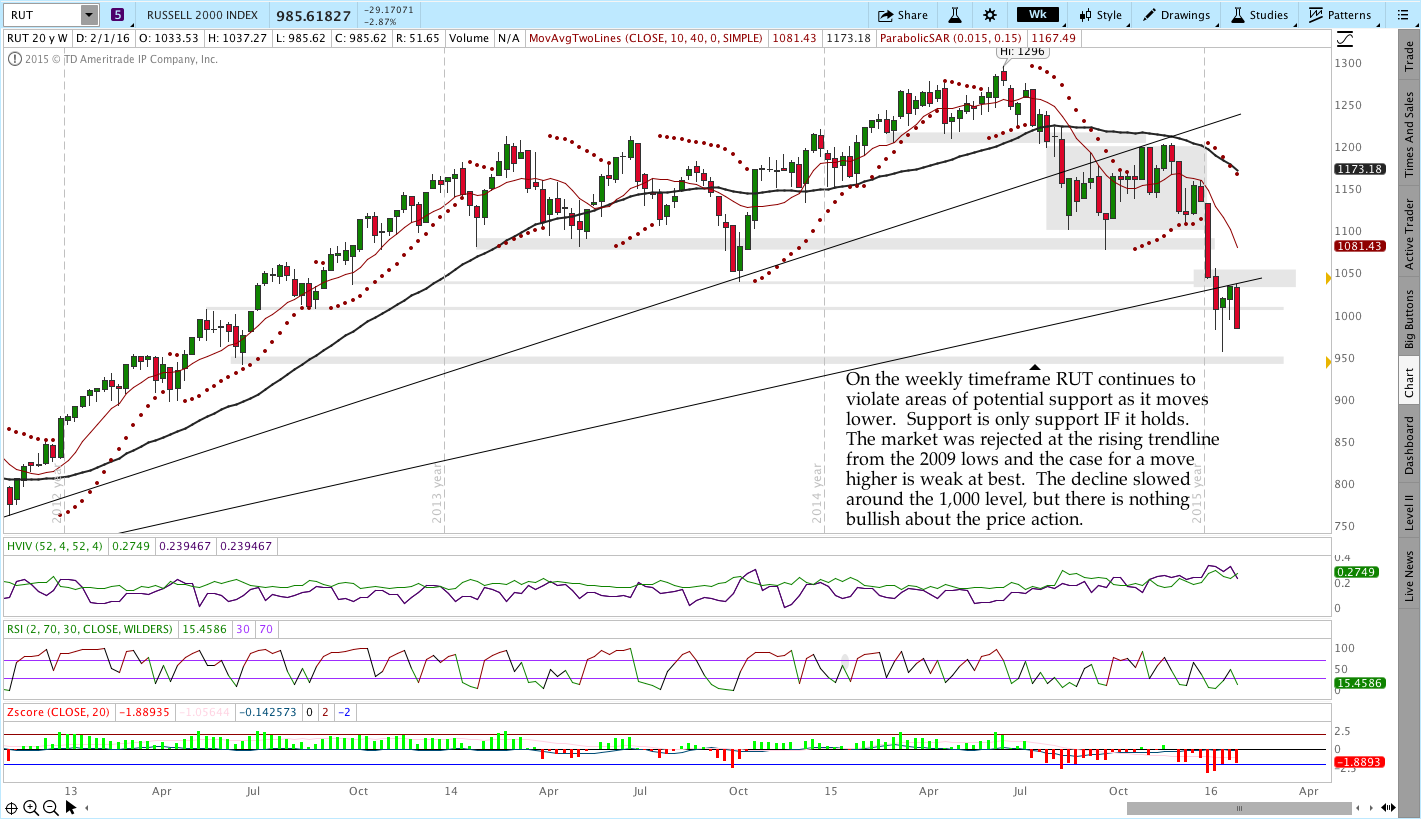
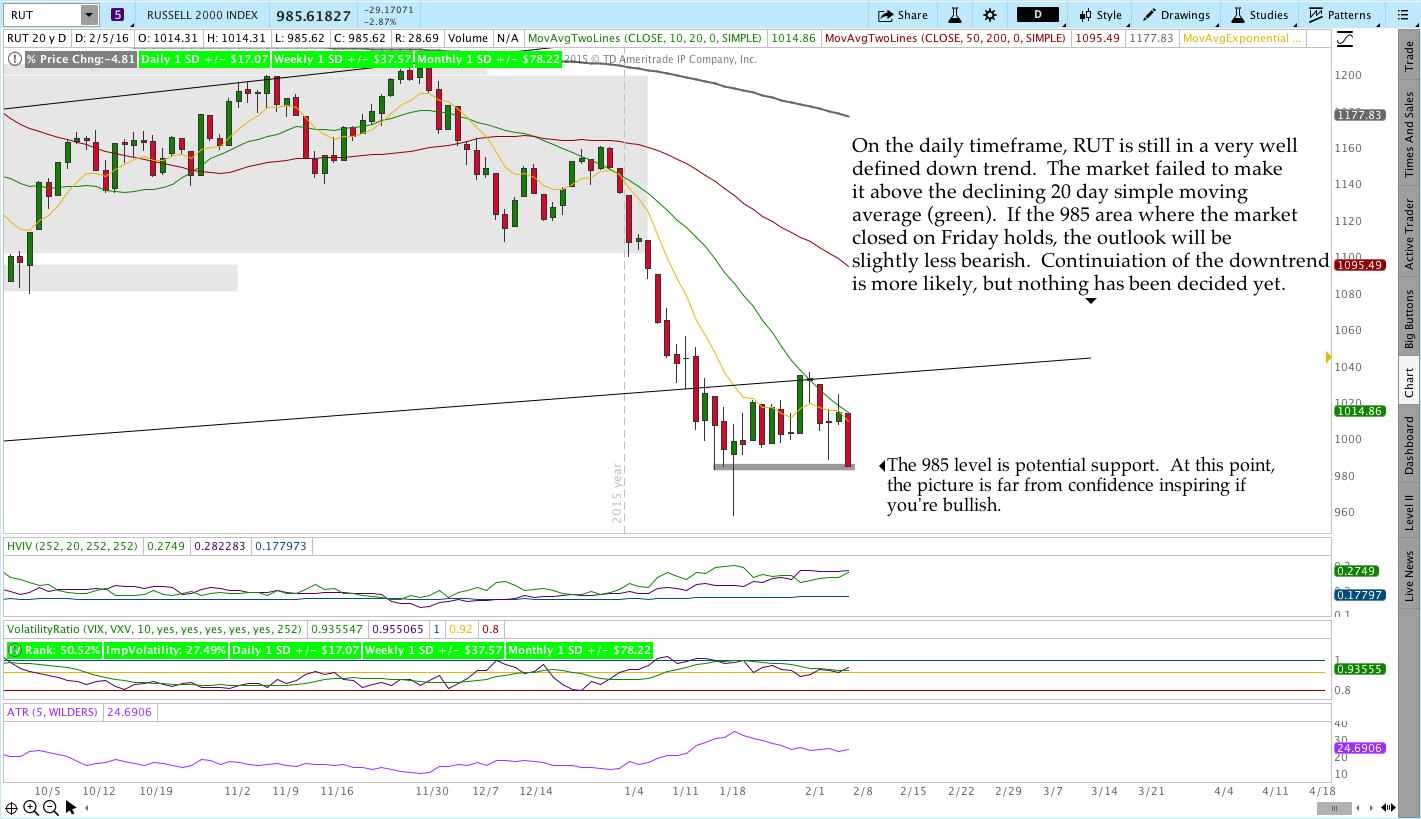
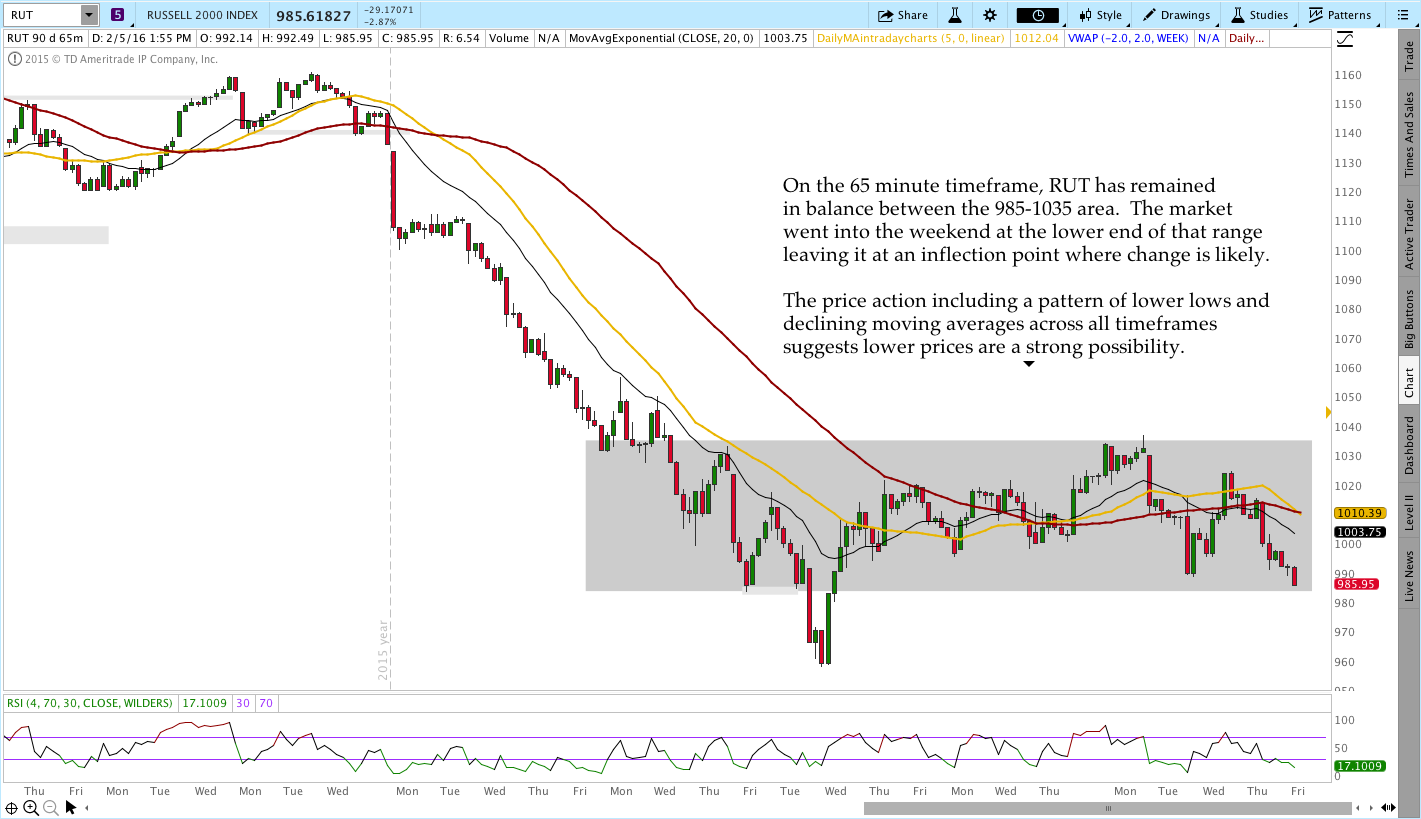
Russell 2000 – $RUT (Weekly, Daily, and 65 Minute Charts):
Live Trades . . .
The “Live Trades” section of the commentary focuses on actual trades that are in the Theta Trend account. The positions are provided for educational purposes only.
——————————
The Theta Trend sample account ended January with a 1.48% gain. Check out the Results Tab for fill prices and order specifics.
The March 2016 CIB trade is open and the position is around half way to the target profit. I’ve been updating the Live Trade Page every day so check out that page for a more comprehensive update on the position.
If you want to learn a safer, less painful way to trade options for income, check out the Core Income Butterfly Trading Course.
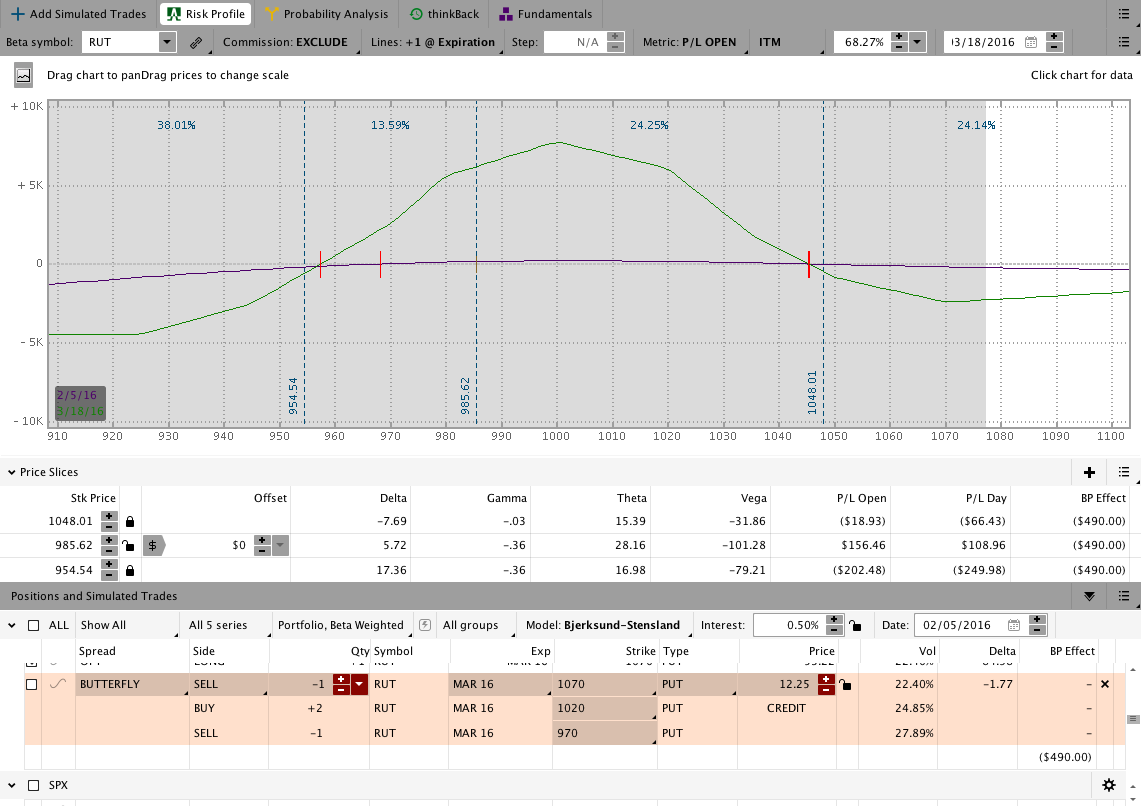
March 2016 Core Income Butterfly Trade:
The Results Spreadsheet is up to date as of Friday. All of the trades mentioned there are actual trades that I’ve taken. There are no paper trades or fuzzy fills, they’re all real.
Looking ahead, etc.:
The market is sitting at an inflection point and that means we have the potential for a fast move. I’m certainly not going to predict direction, but I will react to whatever plays out.
Have a great weekend and please share this post if you enjoyed it.
Click here to follow me on Twitter.
Want to receive an alert as soon as the next market commentary is posted?

Sign up for my email list and stay up to date with the latest information on options trading.
Click here to sign up for the list, get a copy of the Theta Trend Options Trading System, the Trade Tacker I use, and information about new systems.
Even better . . . it’s all totally free.