Weekend Market Commentary 2/19/2016 – $SPX, $RUT, $VIX, $VXV, $RVX
Big Picture:
Quick reminder . . . I’ve been uploading video every day to the Live Trade Page that covers technical analysis for the Russell 2000 and the March CIB options trade. This has been a challenging cycle and there is a lot to learn about adjustments and managing the position in those videos. Check it out if you haven’t already.
—————————–
One of the more legitimate reasons I started trading options is that I wanted the ability to adapt to changes in the market by adjusting positions. In other words, I wanted to avoid hoping trades would work or simply exiting when the didn’t immediately work. February has been a challenging month for trading, but that has everything to do with wide ranges and whipsaws rather than trends.
The reality of the market is that price can have significant moves in one direction (the primary trend) with strong moves in the opposite direction (counter or shorter term trend). At the same time, the market can be bound by ranges or balances where price advances and declines without follow through to the frustration of directional participants. Saying we’re bullish or bearish is completely meaningless without timeframes to create context.
The media generally focuses on whatever happened today. In most cases, that means a green candle is bullish and a red candle is bearish. The only context is “right now” and price is used as a vehicle to drive emotions. While that simplicity might be acceptable for unsuccessful traders/investors looking for entertainment in the markets, it doesn’t create the context necessary for success.
If we think about the market as being like a natural system, the themes we see are similar to the weather. In the fall, temperatures slowly start to decrease as winter approaches. At the same time, there can be warm weeks and months that make it seem like winter might be mild or won’t arrive. The warm spring like weather on the East Coast around the holidays in 2015 is the perfect example. However, eventually winter arrives and even a mild winter won’t be as warm as the summer.
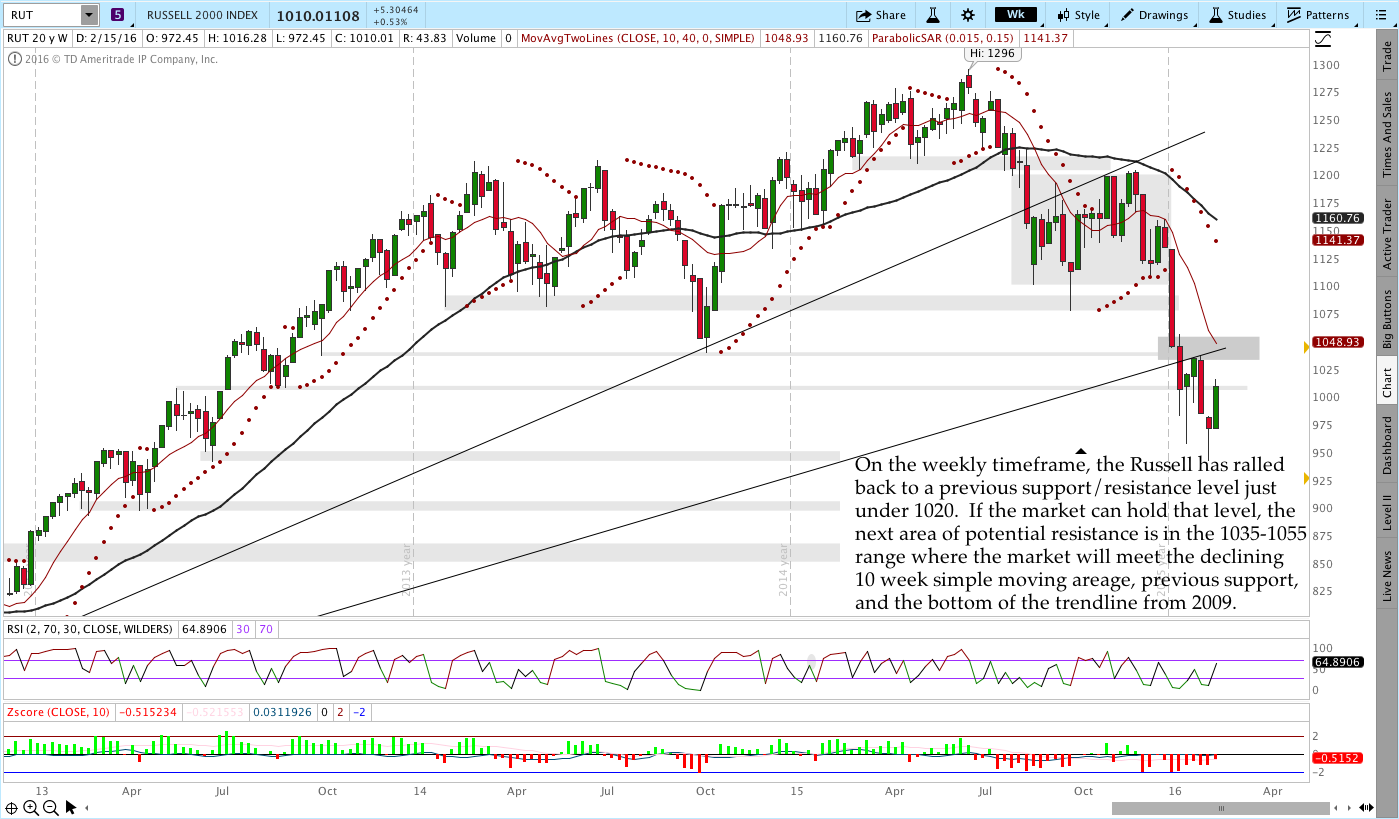
What we’re seeing in the markets right now could be like a warm week in the fall or early winter. Sure, the markets had a solid rally in the past week or so, but the bigger picture hasn’t changed significantly. On the weekly and daily timeframes we see price trading in a wide range. In that sense, the market is simply ranging, rather than declining, at the moment.
When we’re in the middle of trading, it’s easy to get caught up in the emotions of what’s happening “right now,” but we need to step back and look at our positions in the context of the market. As non-directional traders that means we simply move our positions when they aren’t working.
The market doesn’t exist to validate levels we think are important and the only way to survive is to control risk while maintaining a sense of context. Right now the short term signals are mixed while the longer term theme remains weak.
Volatility:
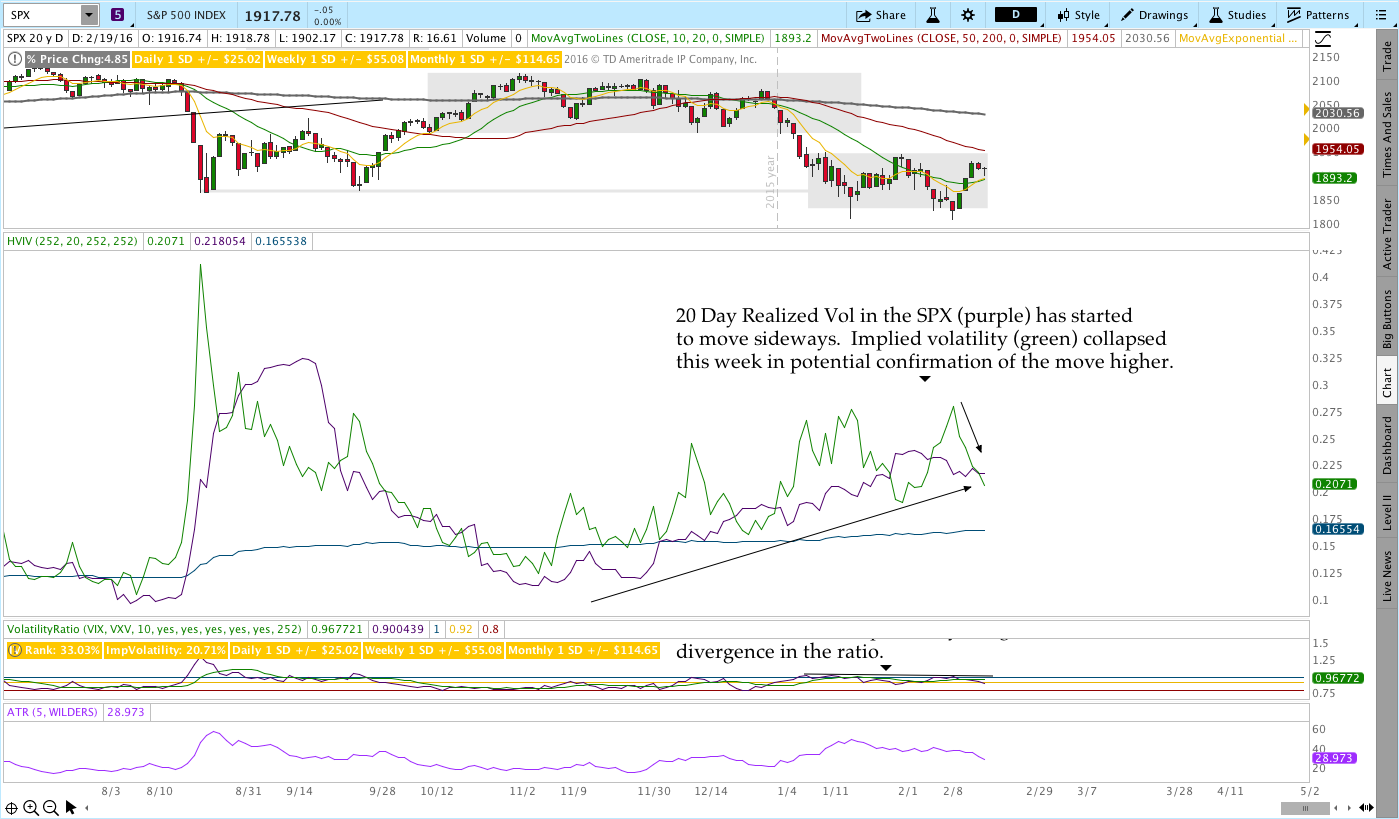
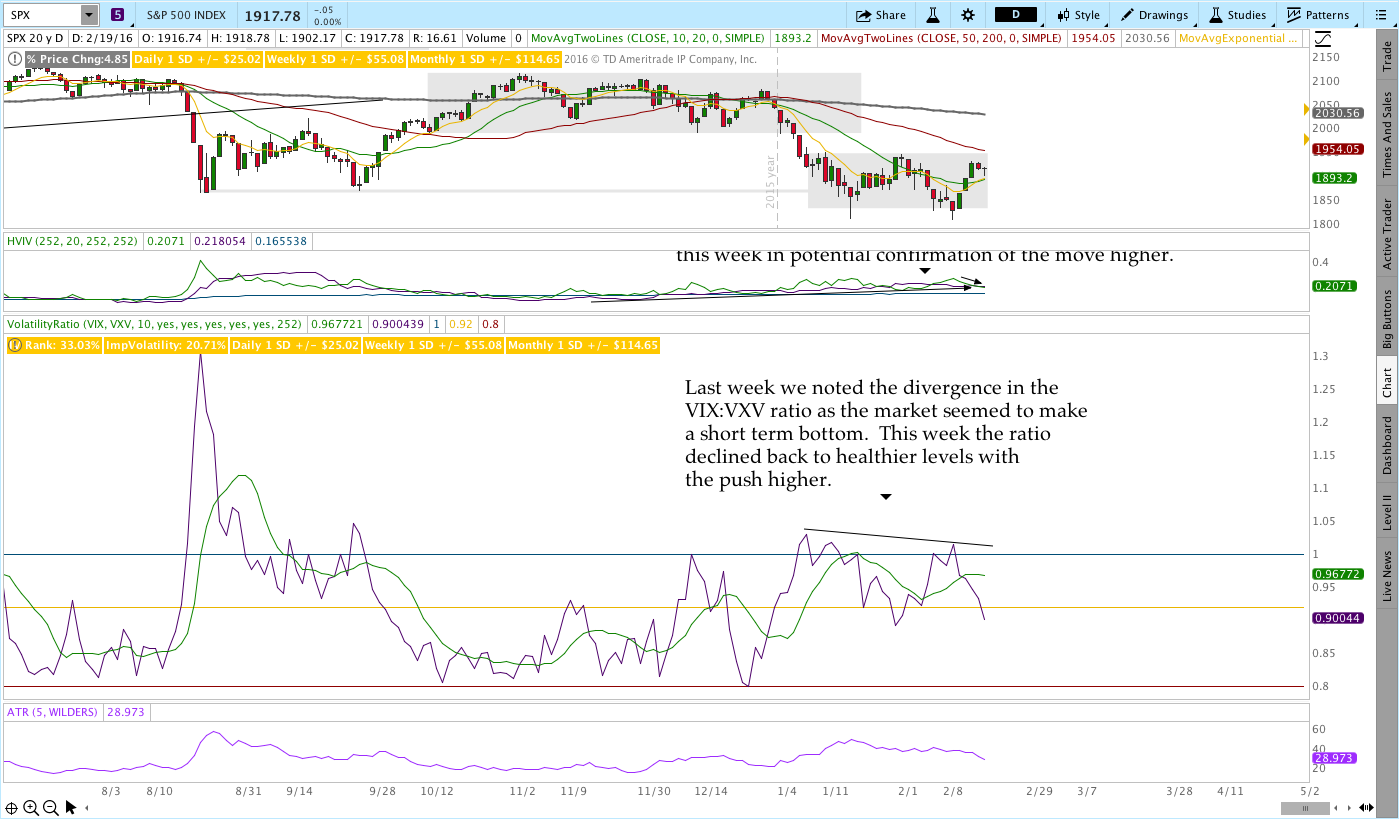
Volatility continues to be a great confirming indicator in 2016. Last week we saw a divergence in the VIX:VXV ratio that was validated this week. We also saw a drop in implied volatility that preceded the IV collapse this week. If volatility is right, the market has the potential to move higher in the short term.
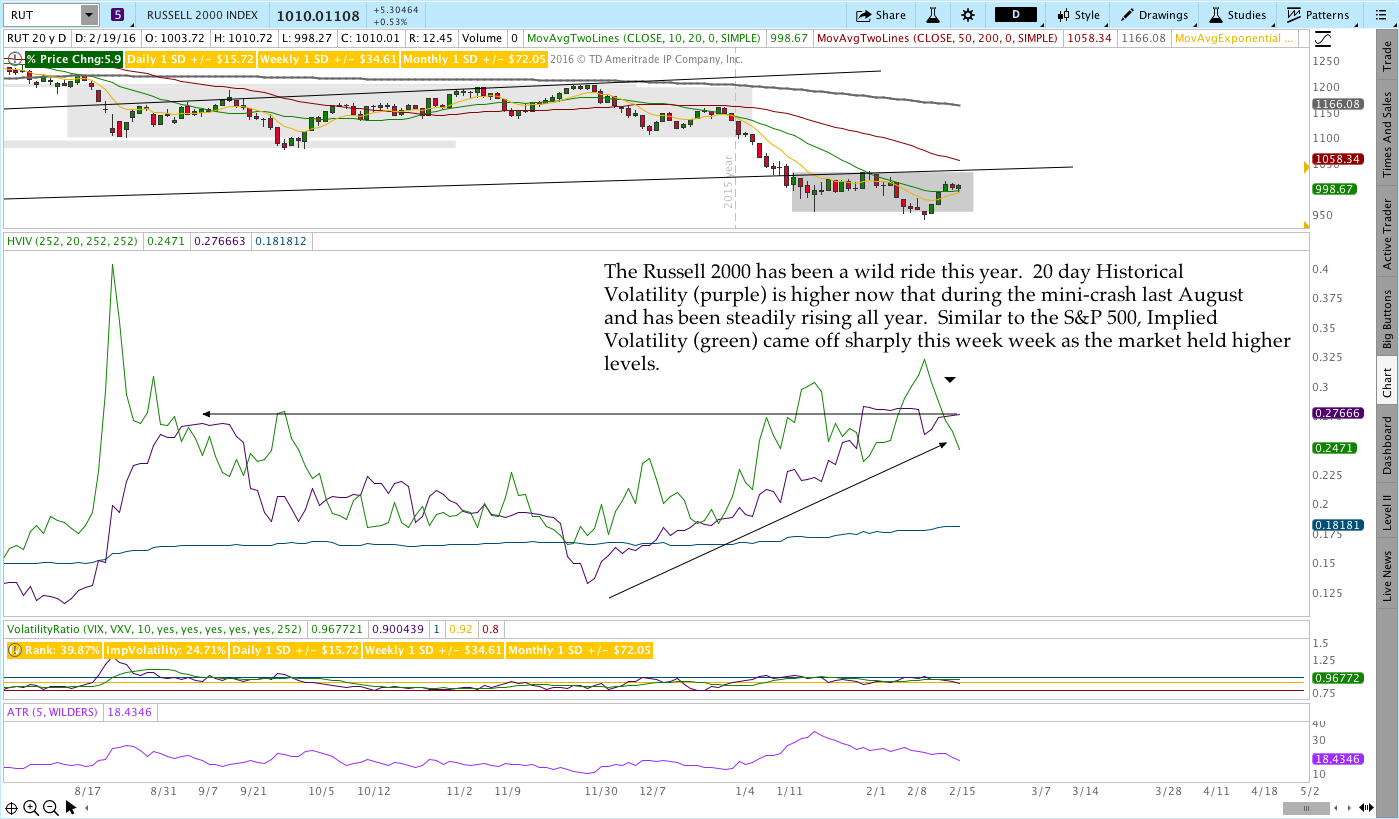
Even though IV is under control, elevated Historical Volatility in the S&P 500 and especially the Russell 2000 is reason for concern. HV in $RUT is trading higher than last August following the mini-crash. At the same time, Implied Volatility is trading at a discount to 20 day HV. Generally IV falling below 20 Day HV is somewhat bullish, but the elevated level of HV is a little troubling and makes me wonder if the recent short covering rally will fail. I’ll have more confidence in the potential for higher prices if HV begins to decline.
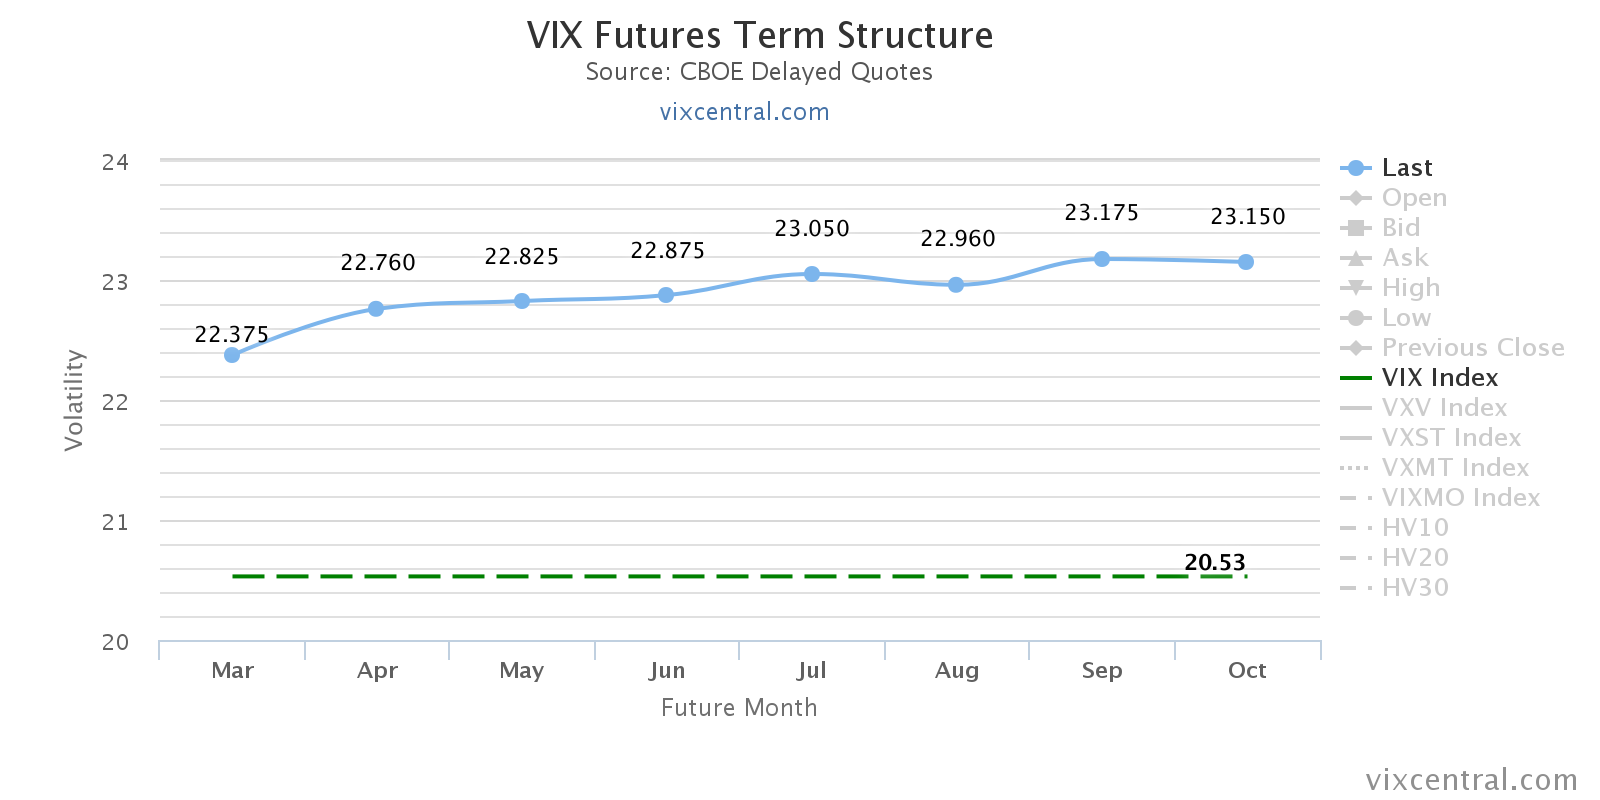
The VIX Futures term structure returned to Contango, which validates the move higher this week, but the curve is relatively flat and still subject to scrutiny. As an analogy, think about price closing above a declining long term moving average. Even though a close above a long term average is somewhat bullish, the direction of the moving average is reason for concern. Even though Contango is “healthy,” a flat curve in a broken market doesn’t inspire the same level of confidence as a steeper curve in a healthy market.
Market Stats:
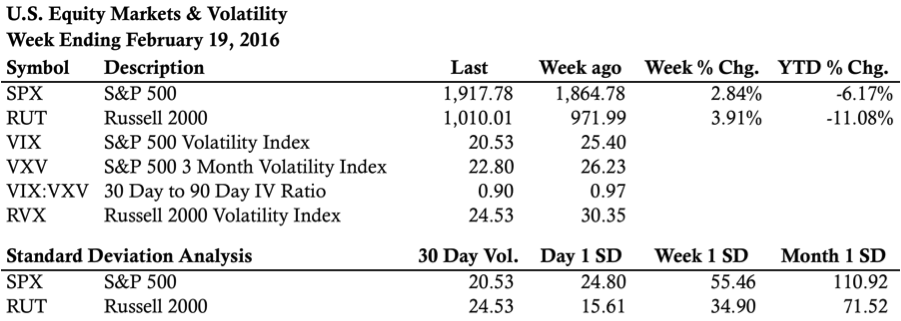
Levels of Interest:
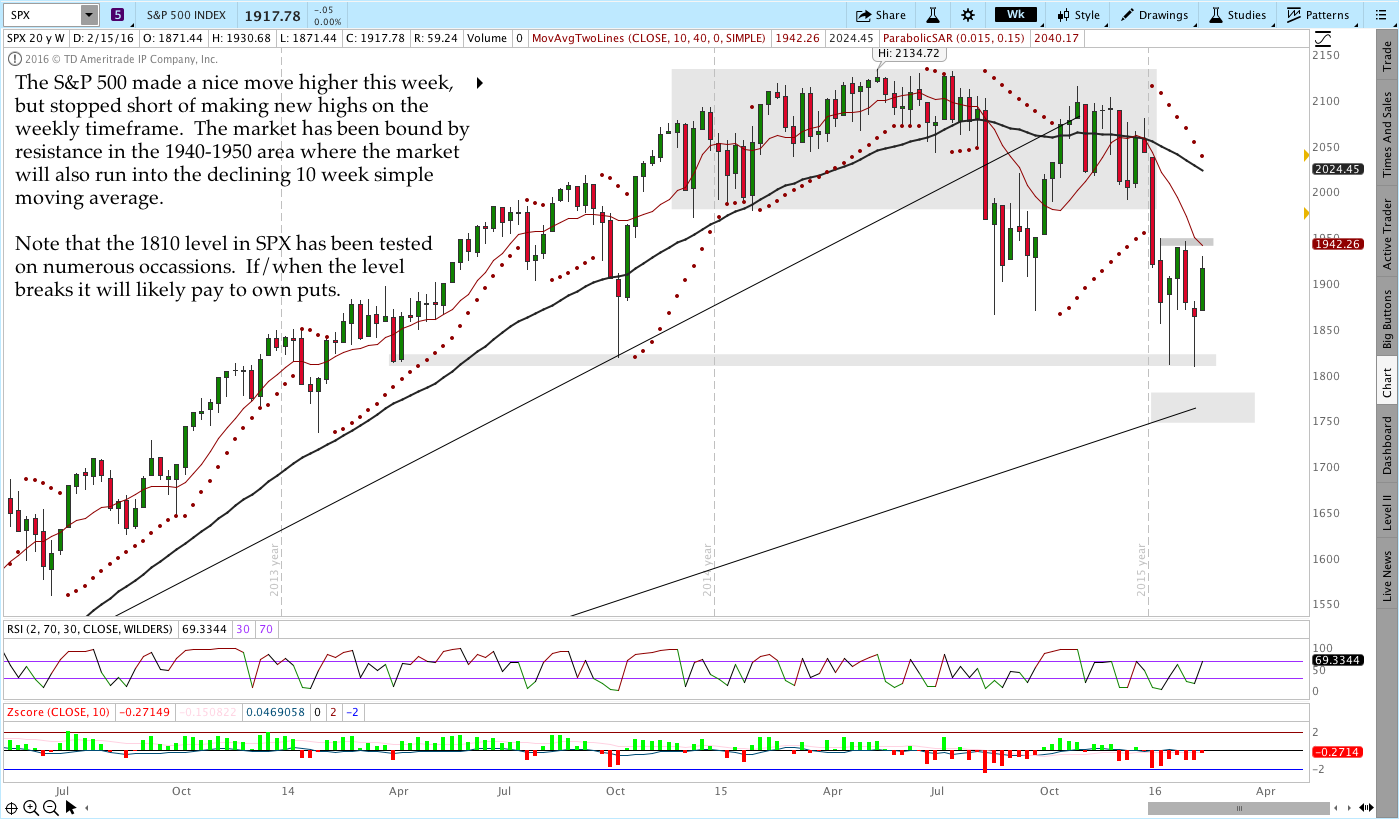
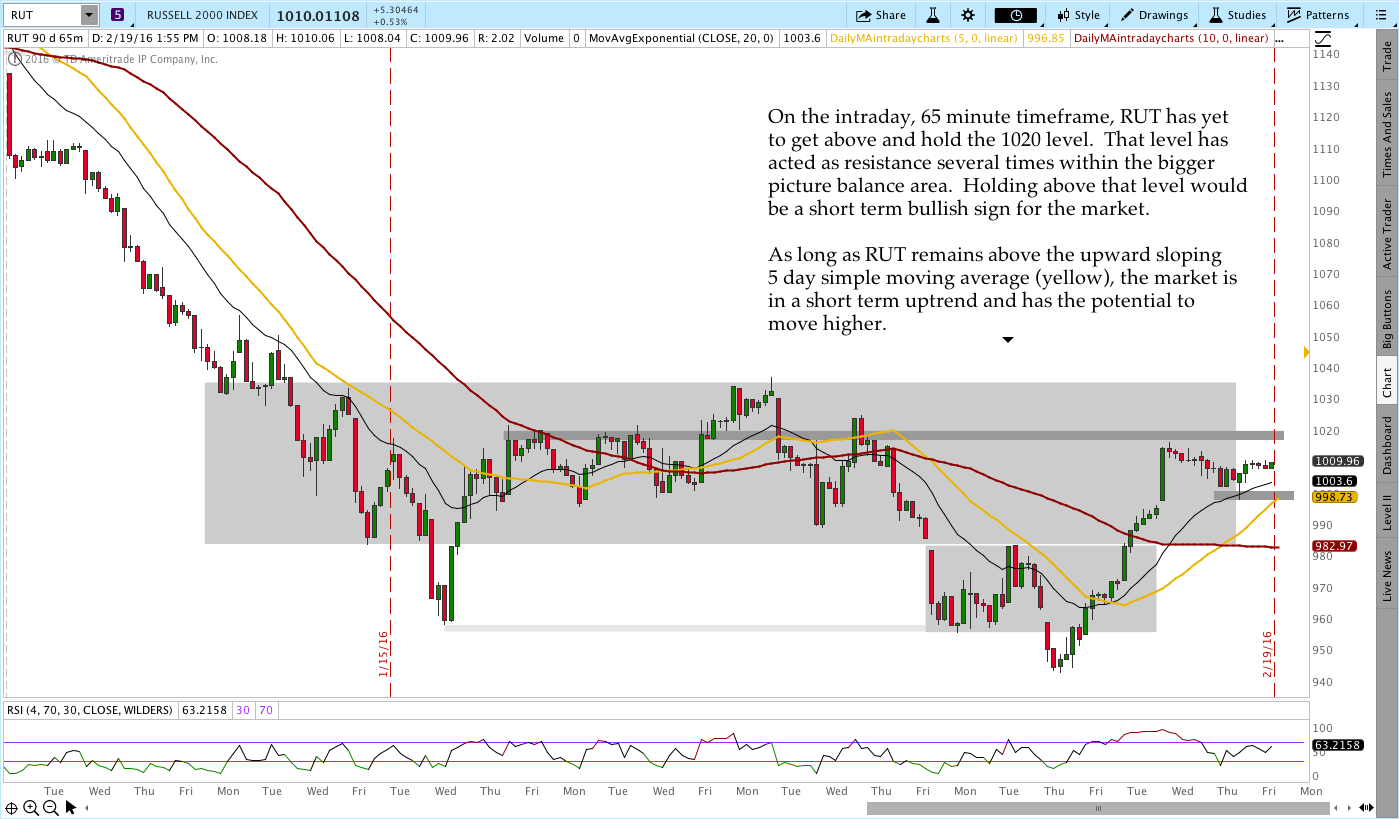
In the levels of interest section, we’re drilling down through some timeframes to see what’s happening in the markets. The analysis begins on a weekly chart, moves to a daily chart, and finishes with the intraday, 65 minute chart of the S&P 500 (SPX) and the Russell 2000 ($RUT). Multiple timeframes from a high level create context for what’s happening in the market.
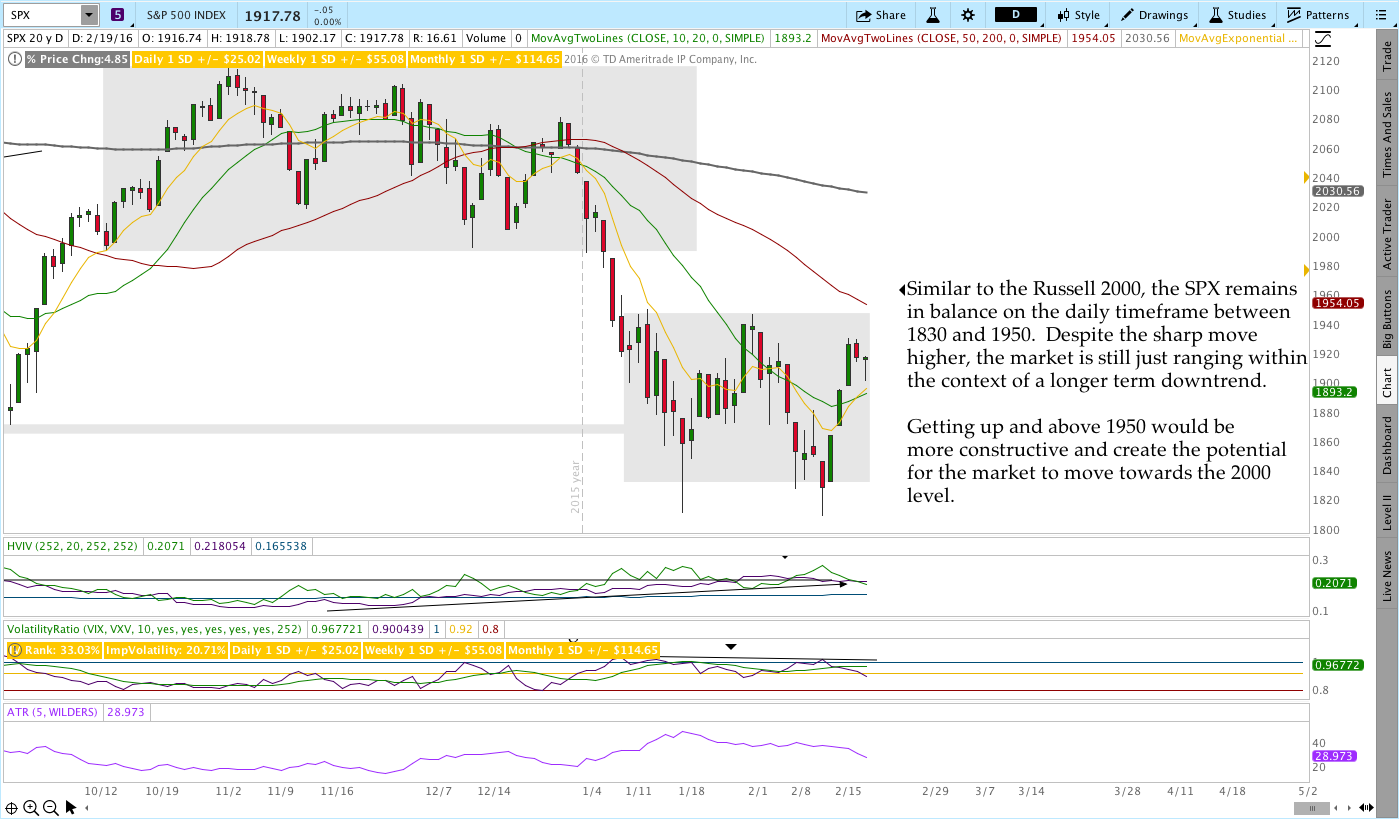
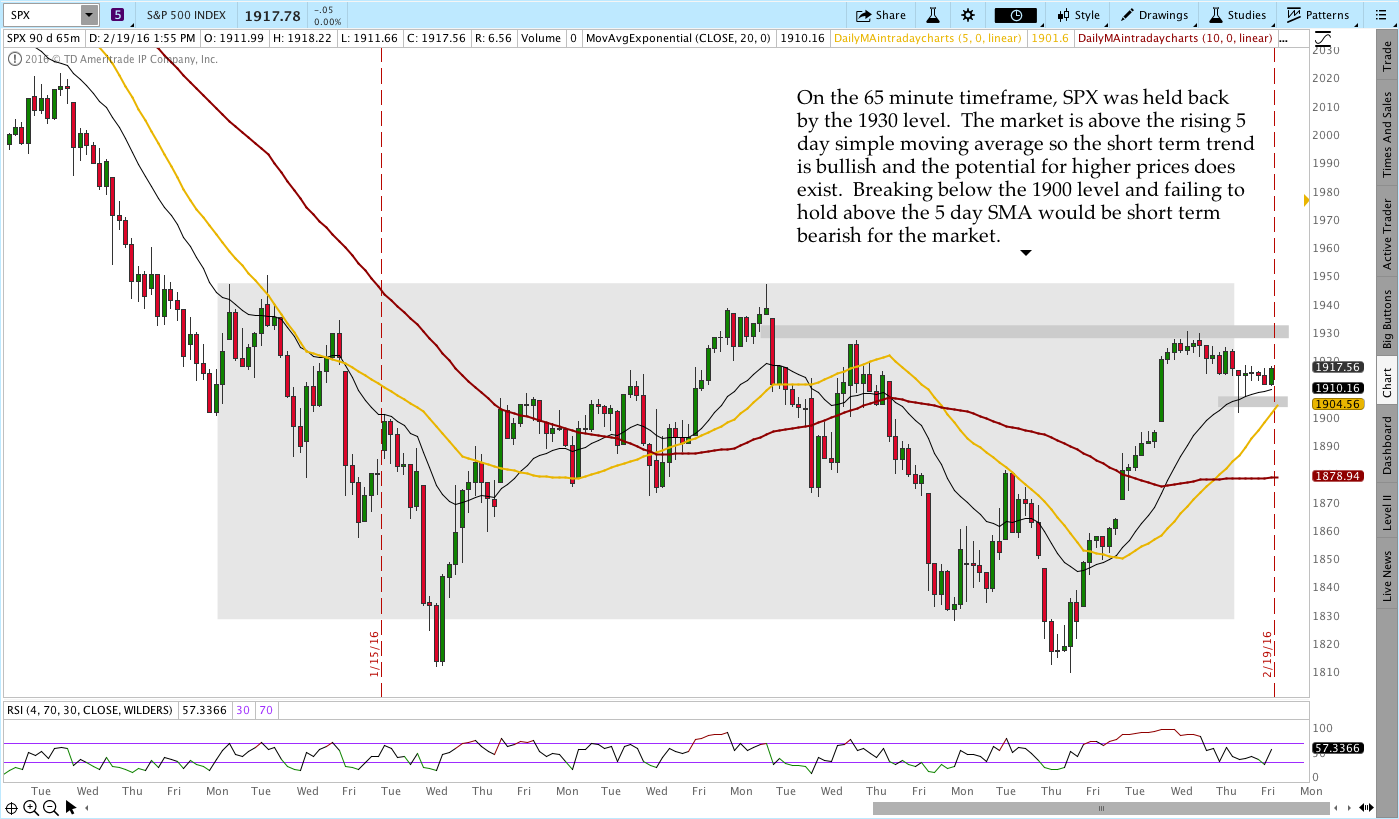
S&P 500 – $SPX (Weekly, Daily, and 65 Minute Charts):
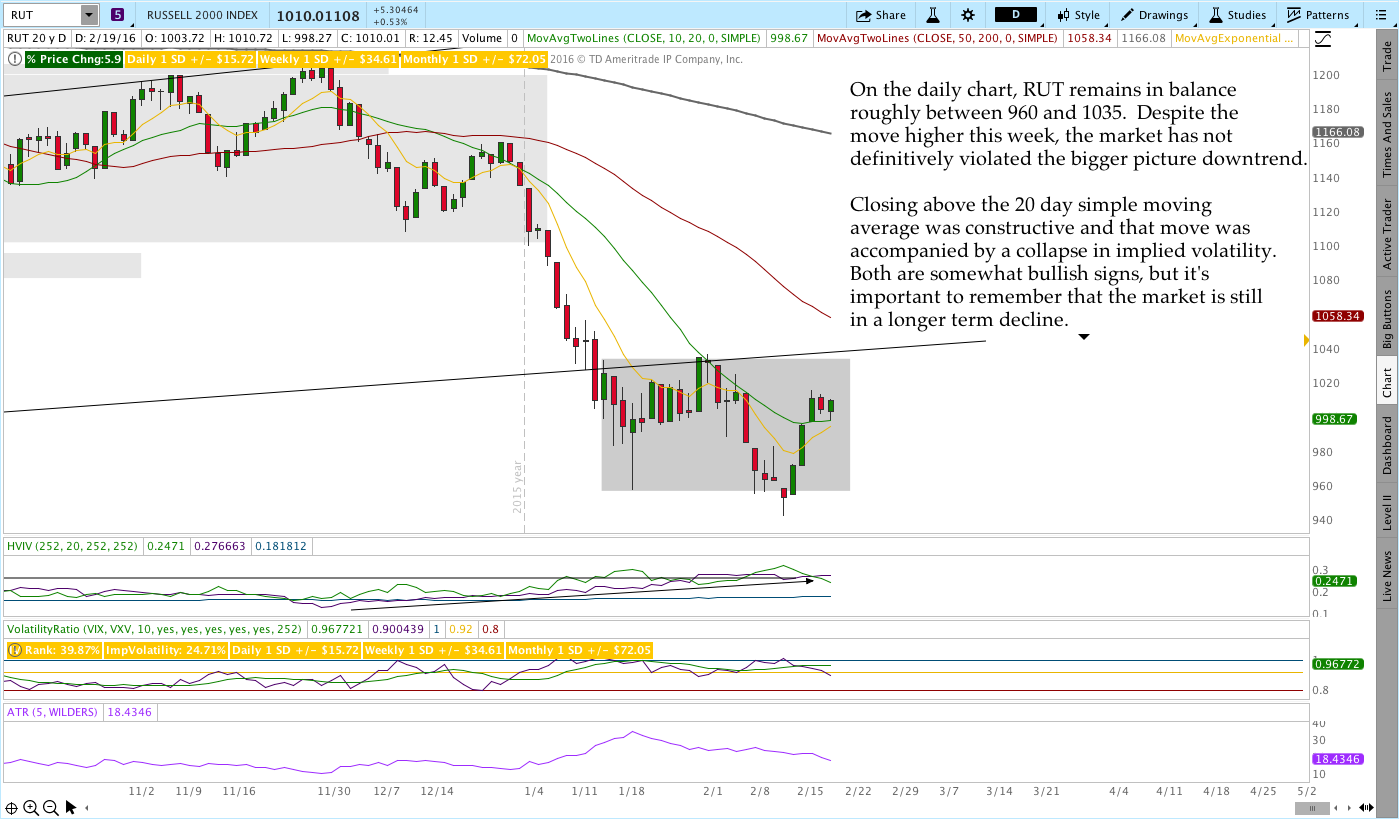
Russell 2000 – $RUT (Weekly, Daily, and 65 Minute Charts):
Live Trades . . .
The “Live Trades” section of the commentary focuses on actual trades that are in the Theta Trend account. The positions are provided for educational purposes only.
——————————
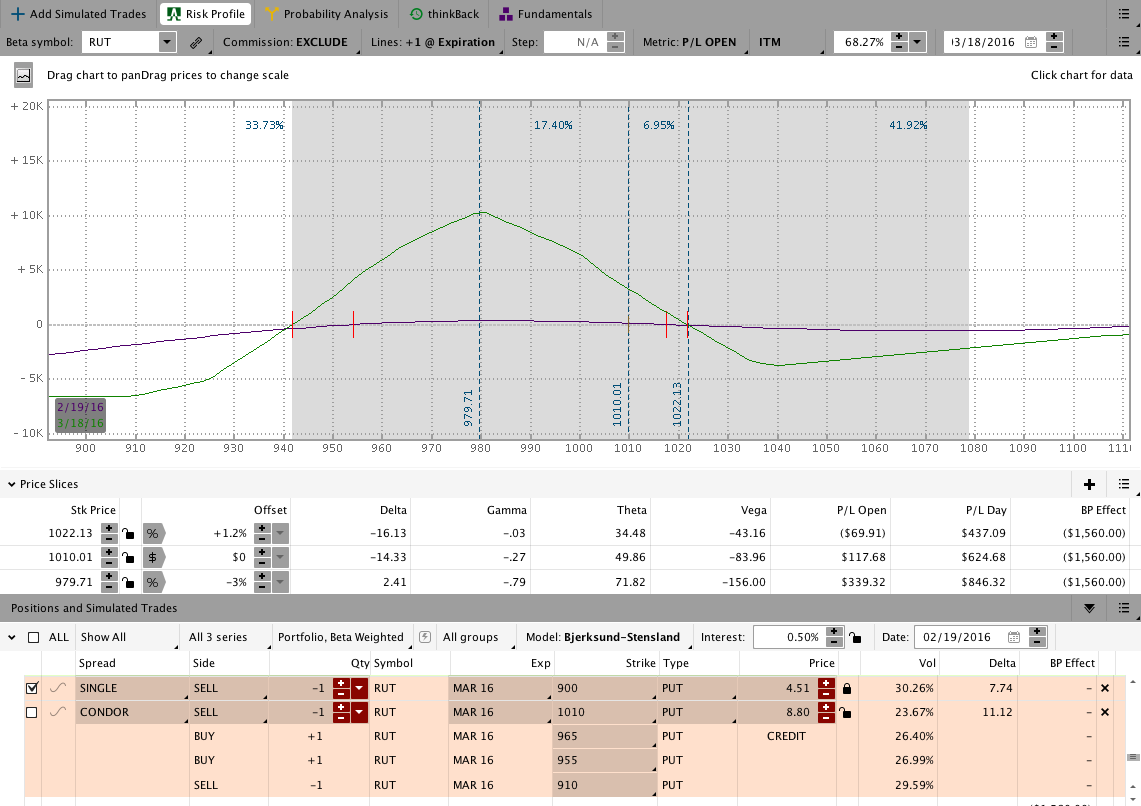
The March 2016 CIB trade is open and okay for the time being. The trade had a challenging week with the fast move higher, but the position is showing an open profit again and we’re well inside of 30 DTE. I’ve been updating the Live Trade Page every day so check out that page for a more comprehensive update on the position.
This week I’ll be looking to enter an April trade.
If you want to learn a safer, less painful way to trade options for income, check out the Core Income Butterfly Trading Course.
March 2016 Core Income Butterfly Trade:
The Results Spreadsheet is up to date as of Friday. All of the trades mentioned there are actual trades that I’ve taken. There are no paper trades or fuzzy fills, they’re all real.
Looking ahead, etc.:
This week I’ll be keeping a close eye on the market in case it decides to make new short term highs. My positions are all under control and I’d definitely prefer a little bit of a pullback, but I don’t get to choose what happens. Since we’re inside of 60 DTE, I’ll be looking for an opportunity to open an April CIB.
Have a great weekend and please share this post if you enjoyed it.
Click here to follow me on Twitter.
Want to receive an alert as soon as the next market commentary is posted?

Sign up for my email list and stay up to date with the latest information on options trading.
Click here to sign up for the list, get a copy of the Theta Trend Options Trading System, the Trade Tacker I use, and information about new systems.
Even better . . . it’s all totally free.